

Cellular network market
Analysys Mason & Light Reading: cellular data traffic growth rates are decreasing
According to Analysys Mason, the telecoms industry is fixated on the idea of a constant and dramatic increase in data consumption by cellular network users. However, the growth rates are no longer increasing. The annual growth in cellular data traffic slowed, worldwide, from more than 90% in 2018 to 34% in 2021 and again to around 22% in 2022.
These figures include a surge in cellular data traffic generated by customers with fixed–wireless access (FWA) services. FWA customers (due to time spent watching TV and video streaming) often generated more than 200–500GB per month which is 16 times more than an average mobile cellular data customer, in 2022.
This means there is an even steeper decline in the growth of data traffic generated by mobile handsets, decreasing from an annual rate of 104% in 2018 to 21% in 2022.
Figure 1: Cellular data traffic growth rates by region, 2017–2022
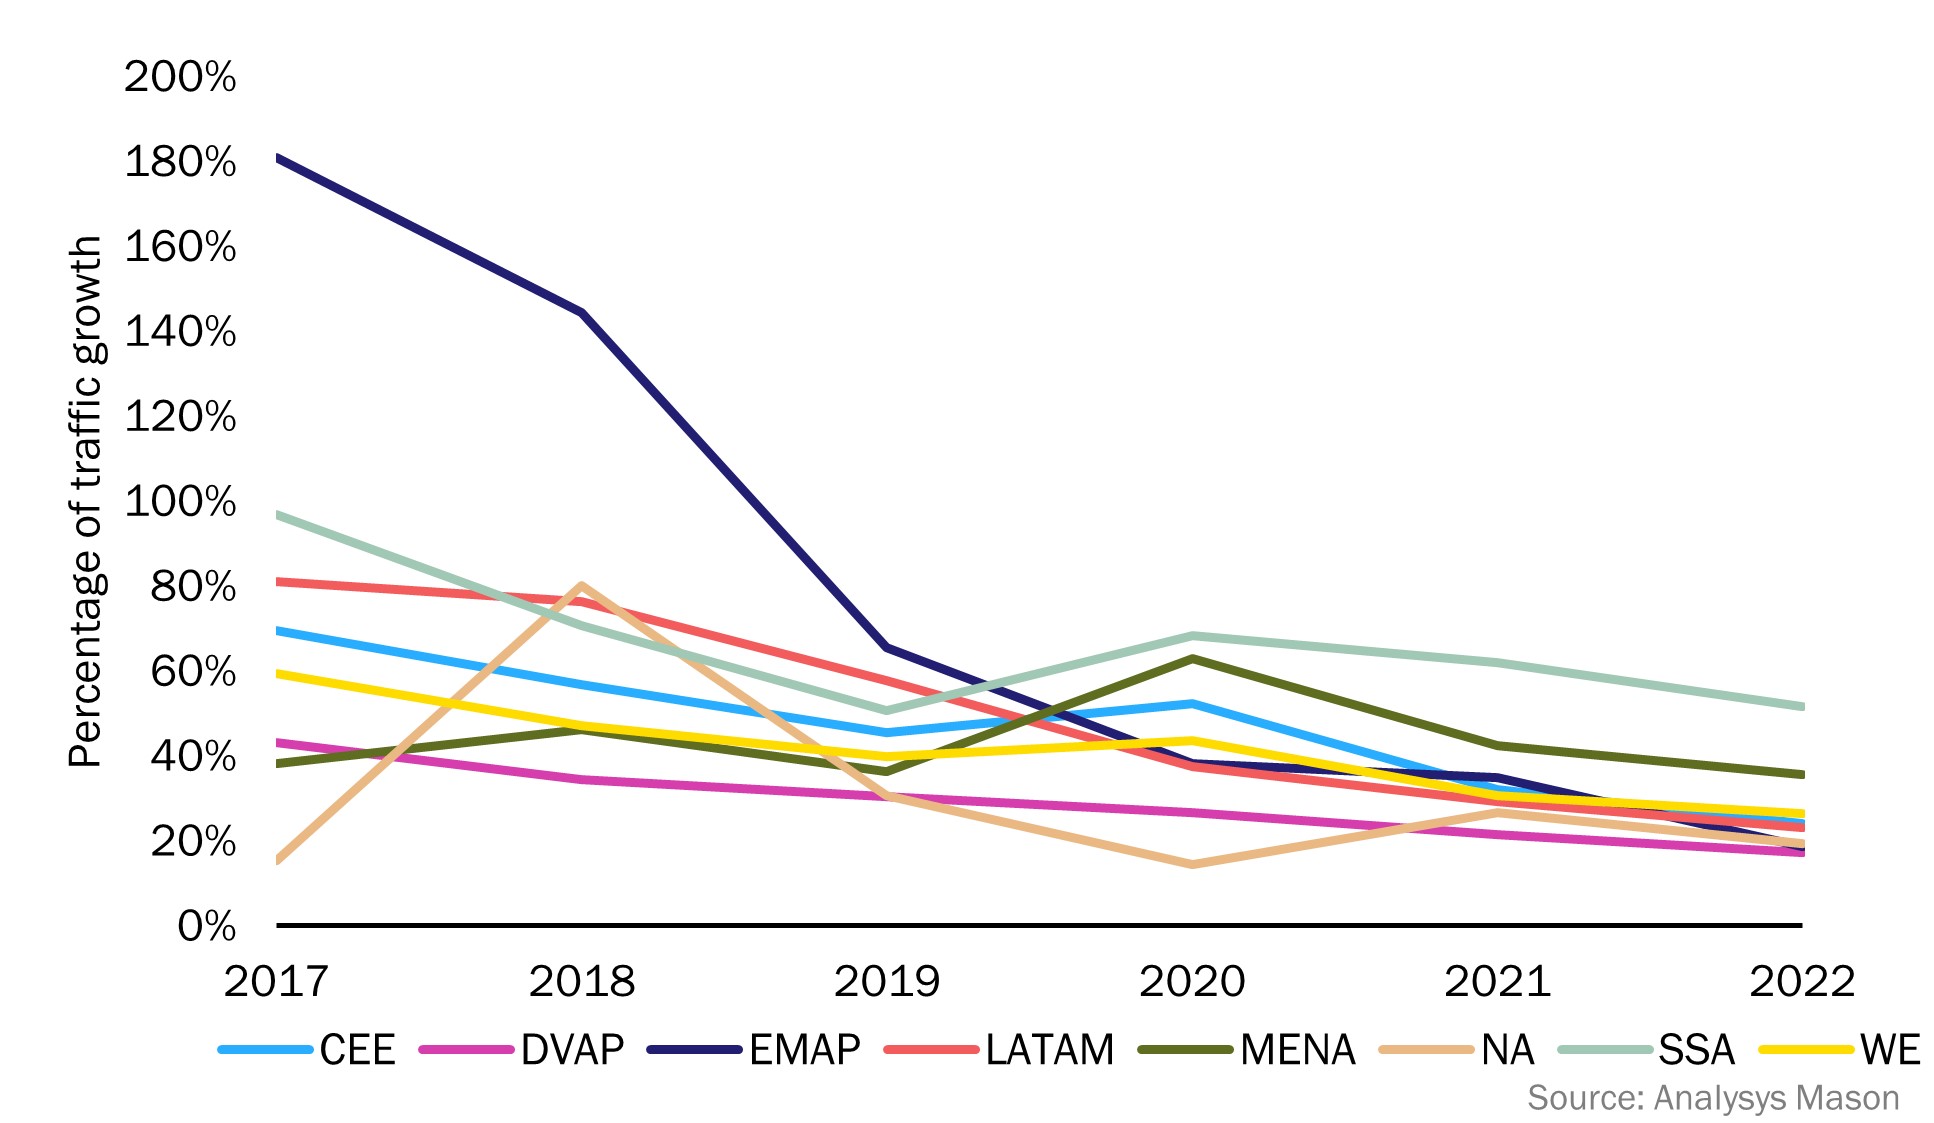
CEE = Central and Eastern Europe, DVAP = Developed Asia–Pacific, EMAP = Emerging Asia–Pacific, LATAM = Latin America, MENA = Middle East and North Africa, NA =North America, SSA = Sub-Saharan Africa, WE = Western Europe
……………………………………………………………………………………………………………
From Light Reading:
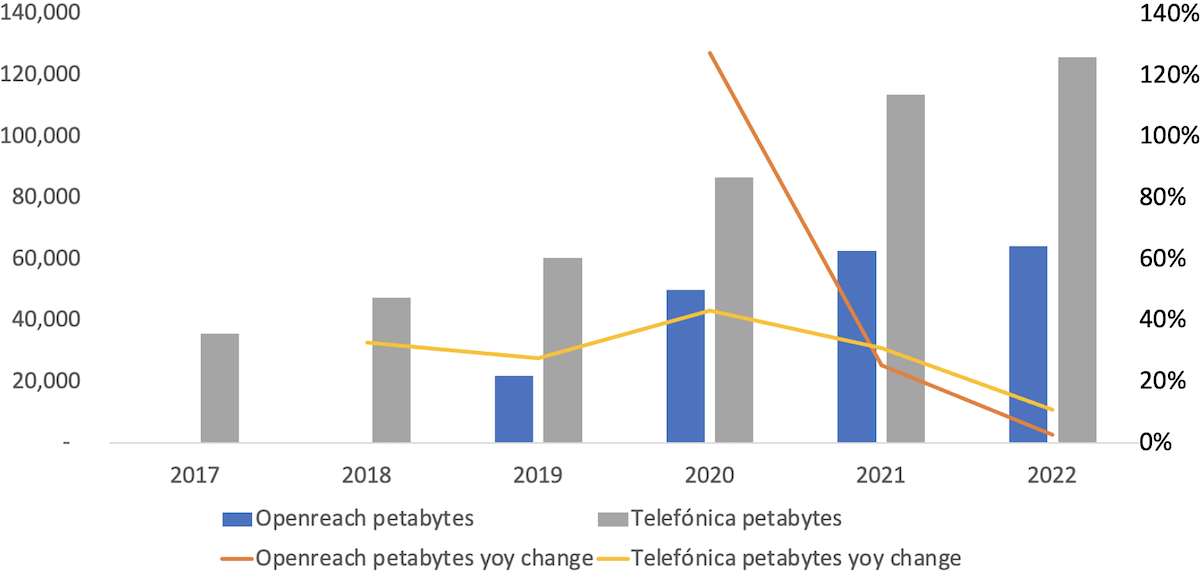
- Data traffic on Openreach, the UK’s main broadband network, grew just 3% last year after rising 25% in 2021 and 127% in 2020 (the year of mass pandemic induced lockdowns).
- A similar trend is observable across the various fixed and mobile networks operated by Spain’s Telefónica. Traffic surged 43% in 2020, but the rate of increase dipped to 11% last year. If the trend persists, the petabytes will soon be dropping.
……………………………………………………………………………………………………………………………….
5G was expected to propel cellular data usage onto a new growth trajectory. However, this is not taking place at all.
Following the launch of 5G services, operators reported very high initial 5G data usage rates. This was primarily caused by the heaviest LTE users upgrading to 5G handsets and services. This migration simultaneously caused a decline in the average traffic generated by users with LTE handsets. The impact of the early adopters was subsequently diluted as less-intensive users upgrade to 5G handsets and services. Then, organic growth in usage started to mask some of the effects of the migration. Over time, though, we can look at whether the total growth in usage across all handset types is sustained. South Korea is a good example to look to. In South Korea, there was an initial surge in data usage the year 5G was introduced, but this effect was short-lived. Average data use by subscribers with 5G handsets fell from its high starting point, became flat and then started to rise once more but only at a low single-digit rate. Average usage by LTE handset owners has been steadily decreasing. Overall, average data traffic growth across all handset types has slowed for 3 years in a row.
Figure 2: Cellular network data traffic growth, South Korea, December 2018–December 2022
| Monthly usage (MB) | December 2018 | December 2019 | December 2020 | December 2021 | December 2022 |
| 4G smartphone traffic per subscriber | 8177 | 9753 | 9650 | 8619 | 7591 |
| 5G smartphone traffic per subscriber | 27 282 | 26 744 | 26 834 | 27 589 | |
| 4G smartphone usage growth | 21% | 19% | –1% | –11% | –12% |
| 5G smartphone usage growth | –2% | 0% | 3% | ||
| Average growth (2G, 3G, 4G and 5G handsets) | 23% | 38% | 18% | 15% | 10% |
Source: Analysys Mason
Operators are currently using FWA to fill the gap between capacity and demand in their 5G networks, but the revenue per megabyte that they generate from FWA services is much lower than that for mobile cellular data services. Relying on FWA traffic to fill 5G networks will not satisfy mobile operators’ investors in the long run. Some operators will also need to limit FWA availability because without the careful management of FWA traffic on 5G networks, there could be negative impacts on the quality of service for non-FWA users.
Only new applications and services will unlock future annual growth rates of 30% or more. However, it is unlikely that the types of services that could significantly accelerate cellular data traffic growth will have a substantial near-term impact.
- Higher definition video and TV services could potentially drive a new wave of data usage. Device capability is an obstacle to this possibility, as most mobile handsets are either not capable of displaying high-definition content or the screen size is too small for users to see the difference. A surge in the use of tablets to view TV on mobile networks could change this – although tablet users tend to use Wi-Fi as their primary means of connectivity. A few mobile operators have introduced mobile cellular data packages that include subscriptions to on-demand TV. This has the potential to drive up data traffic, but there are limits to the amount of time people can spend watching TV when they are away from their homes. Lack of time is likely to prevent excessive mobile TV consumption away from the home. Within the home – even when they have unlimited mobile data packages – users don’t tend to switch to their mobile networks. They typically continue to use devices connected to their home fixed broadband and Wi-Fi for extended TV viewing.
- Connected cars have been regarded as a potential source of high-volume data traffic. But this will likely not happen soon. Most new cars equipped with a mobile connection still only have LTE capabilities, and most of those are only used for telematics. Some original equipment manufacturers (OEMs), as well as operators, have introduced service packages to encourage in-car use of services (based on embedded and aftermarket connections). Even still, usage volumes have been low even in luxury vehicles. Other potential drivers of traffic are C-V2X systems for intelligent transport networks and autonomous vehicles. But despite numerous tests and trials, C-V2X infrastructures are years away, and fully autonomous vehicles still have technical and regulatory hurdles to overcome before they are deployed in meaningful numbers.
- Metaverse services – including AR and VR, and services using haptics – have the potential to generate a high volume of data traffic. In the next 4 or 5 years, the number of users with AR and VR headsets is expected to reach 300–400 million , but faster take-up will be restricted by the cost of end-user equipment, and most image processing will be done using equipment within the home. Eventually, metaverse use cases could involve vast numbers of customers, with cloud processing of fully immersive environments and services requiring very low latency and very high bandwidth.
- However, most of the usage will take place indoors where a combination of fibre and Wi-Fi seems much more suited to the service requirements.
The volume of cellular data traffic is increasing in absolute terms, but the annual change measured in percentage terms is going to be much lower than what is has been historically. Analysys Mason’s new report Wireless network data traffic: worldwide trends and forecasts 2022–2028 evaluates the prospects for cellular data growth over the coming 5 years, with global cellular data traffic nearly tripling worldwide to 2.7ZB in 2028, with a limited metaverse uptick at the end of the period.
References:
https://www.analysysmason.com/research/content/articles/cellular-data-traffic-rdnt0/
Blues Wireless Raises $32M To Accelerate Adoption of Cellular IoT for Enterprises
Embedded connectivity startup Blues Wireless (Blues), today announced a $32 million Series A1 funding round led by Positive Sum, and including new investors Four Rivers, Northgate, and Qualcomm. Previous backers Sequoia, Cascade, Lachy Groom and XYZ also participated.
By using the Blues Notecard and Notehub, businesses can quickly, securely, and cost-effectively connect their physical products to the cloud via a cellular network (LTE Cat 1, LTE Cat M1, or NB-IoT).
- The Notecard is a low-code data pump embedded within a customer’s products. The Notecard combines prepaid cellular connectivity, low-power design, and secure “off-the-internet” communications in one 30mm x 35mmSystem-on-Module.
- The Notehub routes that data to the customer’s cloud. A hosted service for securely routing Notecard data to your cloud application of choice. Manage fleets of devices, update host and Notecard firmware over-the-air.
- Serving enterprise customers and developers alike, Blues is a hyper-scaler focused on 5G cellular Internet of Things (IoT).
“Even in these difficult economic times, enterprises will not hesitate to invest in transforming their physical products to be capable of remote monitoring and control,” said Ray Ozzie, Founder and CEO of Blues (inventor of Lotus Notes). “To date, connecting products to the cloud using cellular has been a time-consuming and expensive endeavor, fraught with risk. Complexity kills. Blues has taken a unique, developer-centric approach that simply eliminates complexity, from device to cloud, enabling products realistically to go from prototype to scale deployment in months instead of years.”
“We are thrilled to be partnering with Blues. They are well positioned to create an inflection point in IoT,” said Alison Davis Riddell, Partner at Positive Sum. “Blues is clearly the culmination of Ray’s life’s work, bringing to bear all of his experience and passion. The company has strong market signal, with rapid growth and demand from some of the world’s leading companies to connect their products to the cloud securely, economically, and with unprecedented speed. Having worked directly in the IoT space for six years, I can confidently say that Blues’ approach is unlike anything we’ve seen, and the opportunity is tremendous.”
Blues will be exhibiting at CES in Las Vegas (Booth #10752, North Hall) from January 5-8, 2023 with the message that any company can cloud-connect their product using cellular. Customers and partners will be alongside Blues in a shared exhibit space to demonstrate their industry-changing products, and to discuss the Notecard’s and Notehub’s role in helping them to win in the market.
Blues Wireless (Blues) is a hyperscale cellular IoT solution provider founded in 2019 by serial entrepreneur Ray Ozzie. Their flagship products, Notecard and Notehub, work together to provide a complete high-scale device-to-cloud data pump. Blues reduces the cost and complexity of building connected products by including provisioning, security, and cloud device management as standard features, with the simplicity and flexibility enabling it to be incorporated within new and existing designs. More than 800 forward-thinking companies, from startup to enterprise, use Blues to securely cloud-connect their products.
Email [email protected] or visit blues.io for more information.
Notecard Cellular Modem SoMs:
| Image | Manufacturer Part Number | Description | Supplied Contents | Available Quantity | View Details | |
|---|---|---|---|---|---|---|
 |
 |
NOTE-WBNA-500 | NOTECARD, LTE CAT 1 (N AMERICA) | Board(s) | 95 – Immediate | View Details |
|
|
NOTE-WBEX-500 | NOTECARD, LTE CAT 1 (EMEA) | Board(s) | 122 – Immediate | View Details |
|
|
NOTE-NBGL-500 | NOTECARD, NB-IOT/LTE-M (GLOBAL) | Board(s) | 99 – Immediate | View Details |
|
|
NOTE-NBNA-500 | NOTECARD, LTE CAT M1 (N AMERICA) | Board(s) | 123 – Immediate | View Details |
References:
https://www.digikey.com/en/product-highlight/b/blues-wireless/notecard-cellular-modem-som
Ericsson expects RAN market to be flat with 5G build-out still in its early days; U.S. cellular industry growth to slow in 2023
Ericsson is planning for a flat RAN market and is structuring its cost base and operations accordingly. Underlying the flat market is a technology shift to 5G from earlier generation. 5G build-out is still in its early days with only about 20% of all base station sites outside China installed with 5G mid-band. Because 5G is still in its early days, vendors like Ericsson and Nokia are seeing lower margins. Therefore, they are relying more heavily on patent royalties to boost profits. Because 5G is still in its early days, vendors like Ericsson and Nokia are seeing lower margins. Therefore, they are relying more heavily on patent royalties to boost profits.

Given the rapid increase in network traffic levels, operators’ investment in performance and capacity is expected to remain robust. The 5G RAN market is expected to grow by over 11% per annum over the next three years, with potential further upside from areas such as Fixed Wireless Access, Enterprise connectivity, XR and Mission Critical Services (which require URLLC which meets performance requirements in ITU M.2410).
In Networks, Ericsson expects to expand its global footprint and enhance gross income through continued investments in technology for performance and cost leadership and, in addition, improve productivity and capital efficiency across the supply chain. In particular the Segment will continue investing in enhanced portfolio energy performance, enabled by Ericsson Silicon and innovating next-generation open architecture, such as Cloud RAN – key areas of strategic importance for its operator customers. Cloud RAN also offers potential in the enterprise segment.
…………………………………………………………………………………………………………………………………………………………………………………………………………………………………………………………………………………………..
Separately, Morgan Stanley analysts forecast that the U.S. wireless industry growth will slow in 2023.
“Carriers could move to cut pricing in order to maintain their subscriber bases,” the Morgan Stanley analysts wrote in a report to investors issued Thursday. That could reduce the operators’ ability to make money, they noted. “A continued adoption of premium plans could also support wireless service revenue growth,” they added.
Morgan Stanley analysts expect the U.S. wireless industry – including Verizon, AT&T, T-Mobile, Dish Network and cable companies like Comcast and Charter Communications – to collectively add 8.7 million new postpaid phone customers during 2023. That’s down only slightly from 8.9 million during 2022 and just below the record 10 million that providers collectively added over the course of 2021.
“We see the biggest slowdown in 2023 adds at AT&T, while Verizon could grow adds modestly yoy [year over year] off a low base, and T-Mobile can do slightly better given this year saw the impact of the Sprint network shutdown,” the Morgan Stanley analysts wrote. “We will be watching the growing deployment of eSIM technology to see if it opens the door to higher switching activity, while it should also help carriers lower costs through an easier activation process.”
References:
https://www.prnewswire.com/news-releases/ericsson-capital-markets-day-2022-301704231.html
https://telecoms.com/519003/ericsson-expects-ran-market-growth-to-be-flat-for-years/
JD Power: US cellular network quality declines – users cite slow or failure to load content
US cellular network quality has recently declined, according to a new study released this week by J.D. Power. That metric comes as as more devices were loaded onto their respective networks and used for streaming and other types of data-hungry applications. The most common reported problem is slow or failure to load content.
“An uptick in wireless and device usage was bound to catch up to network quality,” said Ian Greenblatt, managing director at J.D. Power. “Wireless customers are increasingly adept in data usage and streaming, meaning they’re less inspired and more aware of problems. While the number of problems is significantly lower when 5G is available, the most influential problems on network quality ratings continue to be streaming audio and video quality, low loading times and calls not going through.”
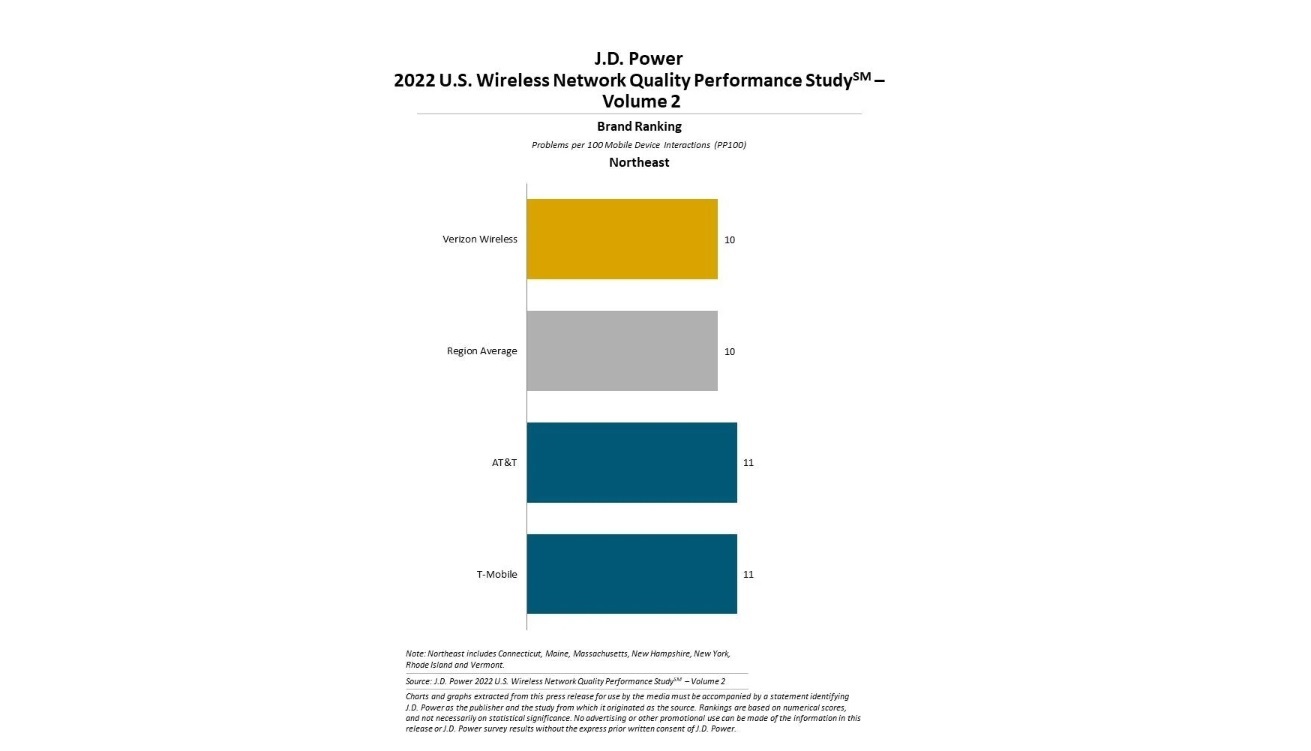
Verizon Wireless ranks highest in five regions evaluated in the study, achieving the fewest network quality problems per 100 connections (PP100) in call quality; messaging quality; and data quality in the Mid-Atlantic, North Central, Northeast, Southeast and West regions.
AT&T ranks highest or is tied in all factors in the Southwest region with a score of 11 PP100, achieving the fewest network quality problems in call quality in the region.
The 2022 U.S. Wireless Network Quality Performance Study—Volume 2 is based on responses from 34,174 wireless customers. Carrier performance is examined in six regions: Mid-Atlantic, North Central, Northeast, Southeast, Southwest and West. In addition to evaluating the network quality experienced by customers with wireless phones, the study also measures the network performance of tablets and mobile broadband devices. The study was fielded from January through June 2022.
By region, here’s how the network quality numbers compared:
- Mid Atlantic: regional average in V2 is 10; regional average in V1 was 9.
- North Central: regional average in V2 is 10; regional average in V1 was 9.
- Northeast: regional average in V2 is 10; regional average in V1 was 9.
- Southeast: regional average in V2 is 11; regional average in V1 was 10.
- Southwest: regional average in V2 is 12; regional average in V1 was 11.
- West: regional average in V2 is 11; regional average in V1 was 9.
For more information about the U.S. Wireless Network Quality Performance Study, visit
https://www.jdpower.com/business/resource/jd-power-wireless-network-quality-performance-study.
About J.D. Power:
J.D. Power is a global leader in consumer insights, advisory services and data and analytics. A pioneer in the use of big data, artificial intelligence (AI) and algorithmic modeling capabilities to understand consumer behavior, J.D. Power has been delivering incisive industry intelligence on customer interactions with brands and products for more than 50 years. The world’s leading businesses across major industries rely on J.D. Power to guide their customer-facing strategies.
J.D. Power has offices in North America, Europe and Asia Pacific. To learn more about the company’s business offerings, visit JDPower.com/business. The J.D. Power auto shopping tool can be found at JDPower.com.
References:
Media Relations Contacts:
Geno Effler, J.D. Power; West Coast; 714-621-6224; [email protected]
John Roderick; East Coast; 631-584-2200; [email protected]
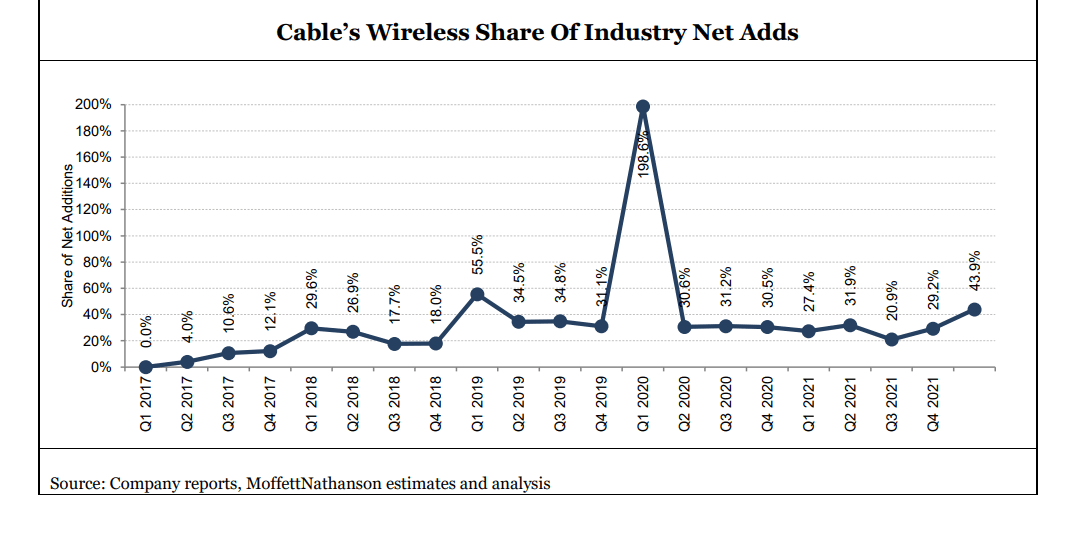
Cable companies big gains in wireless threaten incumbent cellular telcos
by Craig Moffett of MoffettNathanson (edited by Alan J Weissberger)
Cable company’s 98% share of the wireless industry subscriber growth in Q1-2022 is a little known fact. And that does not include the free WiFi they offer to their customers, e.g. Xfinity WiFi and CableWiFi® (created through a collaboration of U.S. Cable and Internet Service Providers including Cox Communications, Optimum, Spectrum, and XFINITY. It allows each other’s eligible Internet customers free access to a collective network of more than 500,000 WiFi hotspots across the nation).
Until Q1-2022, Cable’s gains were almost exclusively from Comcast and Charter. Altice has now renegotiated its contract with T-Mobile, and they have moved to pricing that is even more aggressive than Comcast and Charter. [Interestingly, Altice’s contract allows Altice to name T-Mobile in their advertising as the underlying network, a contract term we’ve not seen before.]
Cox Communications, the nation’s third largest cable operator, is poised to join Cable’s ranks in offering wireless service, as well. The company won a Delaware Supreme Court decision in March, reversing a lower court decision that had previously upended their launch plans by finding they were bound to launch using T-Mobile’s instead of Verizon’s network, even if doing so was under less favorable contract terms. [They have not yet announced precise timing for their expected wireless relaunch.]
The pending addition of a wireless offering from Cox, and the more aggressive posture from Altice, will certainly compound the pressure Cable is putting on cellular telcos (e.g. Verizon, AT&T, T-Mobile, US Cellular, etc).
Cable’s 703K combined net additions were their best ever, and they have grown their subscriber base to 8.4M customers incredibly quickly. But those 8.4M subscribers still represent less than 3% market share of the U.S. market. They have a very long runway ahead.
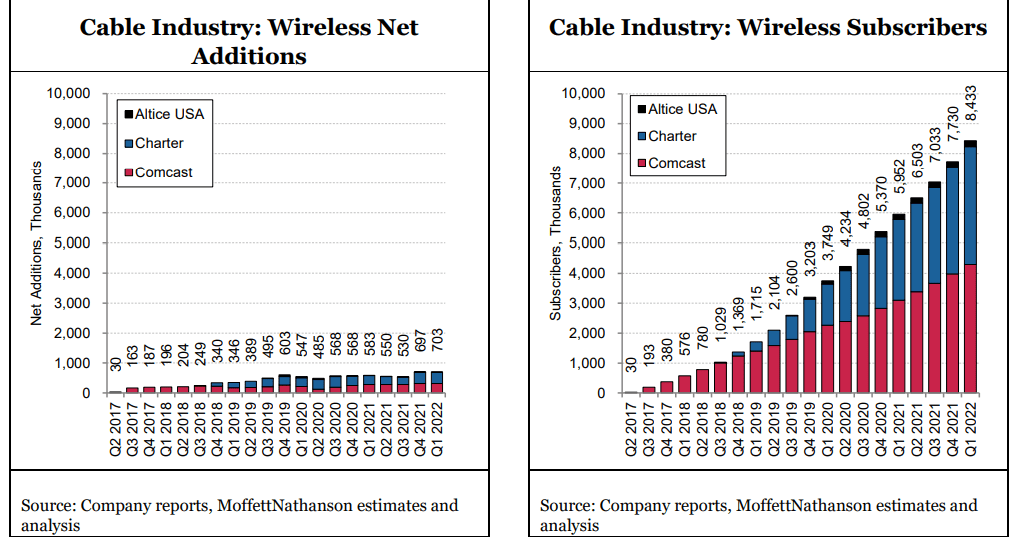
Cable has achieved these gains without offering handset subsidies, something that seems inevitable sometime before the end of the year (Cable’s originally-BYOD subscribers will eventually demand new devices). Handset subsides from Cable, if and when they come, will only put more pressure on the cellular telco incumbents.
It is through this lens that one must view Verizon’s attempt to lead the industry to higher pricing [1.]. Subscriber growth is slowing. Cable’s share gains are accelerating. Cable has made clear that they do not plan to increase pricing. Nor does the industry price leader, T-Mobile. And Cable’s promotionality is likely to increase. That is a very tough backdrop against which to assume that price increases will “stick.”
Note 1. Verizon’s price increase, which will drop directly to the bottom line, will increase Verizon’s
service revenue and EBITDA by roughly $750M over the balance of the year, and by approximately $1.5B for next year, neither of which was contemplated in their previous guidance.
After accounting for 3G terminations, AT&T’s growth fell to just 360K net additions, leaving T-Mobile once again the industry’s fastest growing cellular telco. Not only is T-Mobile taking the industry’s largest share of gross additions – the best measure of customer choice – their churn rate is falling faster than any in the industry, as well, as they complete the transition of Sprint subscribers to their T-Mobile Magenta network. T-Mobile’s falling churn rate starves the industry gross add pool of what had been a critical source of “supply.”
The company is now most of the way through their migration of Sprint customers, and they have repeatedly suggested that churn on their Magenta network is the lowest in the industry, suggesting that churn should continue to fall, even if at a slightly slower pace going forward.
Only T-Mobile is growing ARPU at the moment, as more customers opt for higher value plans (Magenta Max). In contrast to the positive ARPU trend at T-Mobile, ARPU growth has been negative for eight straight quarters at AT&T (with the moderation in the rate of decline in Q1 largely attributable to the aforementioned extension of customer lives, which reduced amortization of historical promotional subsidies, and an easier comp against the same period last year).
ARPU growth at Verizon is not only negative, it is accelerating downward. For Verizon to post both negative subscriber growth and ARPU growth is a shock, and it points to the challenge facing the industry in getting ARPU increases to stick. Absent their wholesale contract with Cable, Verizon’s anemic 1.5% service revenue growth would be close to zero.
Verizon’s price increase comes at a time when industry unit growth is slowing, and at a time when Cable’s market share gains are accelerating both at the gross addition and net addition level. Without broad industry buy-in, and with subscribers looking harder to come by, we find it unlikely that Verizon’s price increases – even if AT&T does initially follow – will “stick.”
If wireless industry growth continues to decelerate, and Cable’s growth rate remains high, Cable’s share of growth will remain elevated, and the wireless industry will increasingly resemble a zero sum game for the Big Three incumbents, where one player’s gain (T-Mobile’s) will necessarily be another’s (Verizon’s and AT&T’s) loss. Huge losses at Dish Network’s Boost unit, and losses at U.S. Cellular, have helped soften the blow, but they are only so big. The pressure of falling industry growth and falling market share unavoidably falls on the cellular telco incumbents.
References:
Wireless Q1 2022: The Elephant in the Room, MoffettNathanson report to clients
Juniper Research: Cellular IoT market expected to hit $61B by 2026
A new study from Juniper Research has found that the global value of the cellular IoT market will reach $61 billion by 2026; rising from $31 billion in 2022. It identified the growth of 5G and cellular LPWA (Low-power Wide Area) technologies as key to this 95% increase over the next four years.
The new study, Cellular IoT: Strategies, Opportunities & Market Forecasts 2022-2026, predicts that, LPWA solutions, such as NB-IoT and LTE-M, will be the fastest-growing cellular IoT technologies over the next four years. It anticipated that the low cost of both connectivity and hardware will drive adoption for remote monitoring in key verticals, such as agriculture, smart cities and manufacturing. In turn, LPWA connections are expected to grow 1,200% over the next four years.
The report urged operators to migrate IoT connections on legacy networks to networks that support LPWA technologies. It anticipated that demand from enterprises for low-cost monitoring technologies, enabled by LPWA networks, will increase as these legacy networks are shut off over the next four years.
Research co-author Charles Bowman commented: “Operators must educate users on the suitability of LPWA as a replacement technology for legacy networks. However, many IoT networks cannot solely rely on LPWA technologies. More comprehensive technologies, such as 5G, must underpin IoT network architectures and work in tandem with LPWA technologies to maximize the value of IoT services.”

5G to Generate $9 Billion for the IoT Market by 2026 (???):
The report predicted that 5G IoT services [1.] will generate $9 billion of revenue by 2026; rising from $800 million in 2021. This represents a growth of 1,000% over the next five years as 5G coverage expands and operators benefit from the increased number of 5G IoT connections. To capitalise on this growth, it recommended operators offer value-added services, such as network slicing and edge computing, to IoT users to maximise the value of 5G adoption.
Note 1. We believe that premium 5G-based IoT services must use the ultra-reliable low-latency communication (URLLC) 5G use case for which the 3GPP spec URLLC in the RAN has yet to be completed. Mission critical apps need ultra high reliability while real time control of IoT devices require ultra low latency. That won’t happen till the spec is complete, performance tested and implemented widely. URLLC will also required a 5G SA core network to prioritize URLLC traffic ahead of eMBB data flows.
Premium 5G URLLC services are expected to command a higher price and therefore generate proportionally more revenue per connection. However, they will likely still be in the early stages of deployment and uptake in 2026.
…………………………………………………………………………………………………………………………………
In contrast to Juniper’s bullish cellular IoT forecast, others have forecast non cellular LPWAs to be the big IoT connectivity winners.
- Ericsson predicted in a November 2020 Mobility Report that by 2026, cellular will account for 5.9 billion of the expected 26.9 billion IoT connections.
- Transforma Insights’ most recent forecast is for 19.9 billion IoT connections by 2026, with 3.2 billion of those being cellular connections. That implies the majority of LPWAs will not be cellular based, e.g. LoRA WAN, Sigfox, others.
We agree with Nick Wood’s of telecom.com who concluded, “Juniper’s forecast implies that 5G is not about to make a meaningful contribution to operators’ IoT revenues any time soon.”
References:
https://www.juniperresearch.com/press/cellular-iot-market-value-to-exceed-61b-globally
Omdia: Global smartphone shipments plunge in Q1-2020; Mobile communications revenue to drop 4.1% in 2020
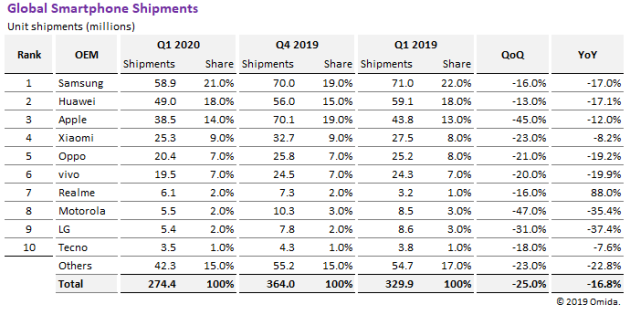
Omdia reported today that global smartphone shipments dropped by 16.8 percent in the first quarter of 2020 as vendors struggled to manage coronavirus-driven production shutdowns, product-launch delays and depressed consumer demand.
Shipments in the first quarter fell to 274.4 million units, down from 329.9 million during the same period in 2019, according to the Omdia Smartphone Intelligence Service. This plunge impacted all the major smartphone brands, with nine of the top-10 OEMs suffering shipment declines compared to the first quarter of 2019.
Editor’s Opinion: The decline will be much greater in Q2-2020 due to all the lockdowns all over the world. Who needs a smartphone when you’re confined to your residence? I hardly use mine at all as I prefer a laptop or tablet when at home.
“Early in the first quarter, the smartphone market was sent reeling by the shutdown of production at facilities in China, which halted the manufacturing of phones and their key components,” said Jusy Hong, smartphone research and analysis director at Omdia. “While concerns about this situation have been alleviated, the smartphone brands also faced new challenges, including disrupted launch schedules for new phones. Even more troubling for smartphone makers is a major decline in global demand due to government lockdown mandates.”
Despite expected rebounds in some countries, the rest of the year is expected to be challenging for smartphone OEMs. Omdia forecasts global smartphone shipments will decline to 1.20 billion units this year, down 13.1 percent from 1.39 billion in 2019.
OEMs feel the pain in the first quarter
Almost across the board, smartphone OEMs faced significant declines in unit shipments compared to the first quarter of 2019.
Samsung retained the top position, with 58.9 million units shipped during the first quarter—a 17 percent decline compared to the first quarter of 2019. Second-ranked Huawei saw its shipments decline by more than 17 percent, to 49 million units, down from 59.1 million in the first quarter of 2019.
Apple, in third place, saw shipments decline to 38.5 million units, down from 43.8 million a year earlier. The 12.0 percent decline comes during the first quarter, historically the weakest period of the year for Apple.
Rounding out the Top 5 are Xiaomi and OPPO. Out of the Top 10, Xiaomi experienced the second least severe decline in the quarter, of 8.2 percent. Only Tecno, in 10th place, attained a lower decrease better with a 7.6 percent year-over-year decline. Xiaomi shipped 25.3 million units in the first quarter, compared to 27.5 million units in 2019. OPPO, on the other hand, suffered a 19.2 percent decline, with shipments falling to 20.4 million units, down from 25.2 million a year earlier.
Realme bucks the downturn
The rest of the Top 10 is made up of vivo, Realme, Motorola, LG, and Tecno. The bright spot here is Realme, which achieved year-over-year growth based on its continued success in India. seventh-ranked Realme was the only top-10 OEM to attain growth during the quarter, with shipments totaling 6.1 million units, up 88 percent from 3.2 million during the first quarter of 2019.
For the others in this group, the first quarter brought significant challenges. Looking at vivo, company shipments declined 19.9 percent, falling from 24.3 million units last year to 19.5 million this year. Motorola, in eighth place, saw shipments decline 35.4 percent to 5.5 million units. While Motorola finally launched its updated RAZR, featuring a foldable display, the publicity surrounding that high-profile device was not enough to support the overall performance of Motorola’s product portfolio.
With or without the impact of the pandemic, LG continues to struggle with its mobile handset division. Shipments declined to 5.4 million units, down from 8.6 million units a year ago—a drop of 37.4 percent. Rounding out the top 10 is Tecno, which saw units decline by a relatively modest 7.6 percent, declining from 3.8 million units last year to 3.5 million units in the first quarter.
First-half struggles
“The smartphone market will face major struggles in the first half of 2020 as different countries experience the initial shock and recovery periods at different times. That’s why OEMs are more afraid of second-quarter sales results,” Hong said. “However, Omdia does expect the smartphone market to start to recover in some countries and regions in the second half of the year.”
Early in the first quarter, the most severe impact on the smartphone market was the shutdown of production and supply chain facilities in China. However, fears over a prolonged closure of essential production, supply chain and logistics operations in China have been alleviated, as signs point to economic activity ramping up quickly in the country.
Smartphone makers in the first quarter also had their product-launch plans disrupted by the cancellation of the Mobile World Congress event in Barcelona, Spain, where many companies had planned to roll out new products.
“Because of the cancellation of the Mobile World Congress, and uncertainty in the supply chain, original product schedules had to be re-evaluated,” said Gerrit Schneemann, senior analyst, smartphones, at Omdia. “However, OEMs seem to have found their footing on how to address new device launches going forward.”
Demand disaster
The impact of the outbreak on the smartphone business has now shifted almost completely to the demand side of the equation.
“Although handsets can be produced at nearly normal levels, the markets for these handsets are mostly in some state of shutdown,” Hong said. “Some countries have made more progress in dealing with the outbreak, while others are still in the midst of fighting the pandemic, and still others won’t feel the full effects of the pandemic until later in the year.”
In Europe, where some countries have been under strict lockdown rules for some time, initial efforts have been made to ease restrictions. Similarly, South Korea has taken steps to open up. In other countries, like in some parts of the United States, only the last few weeks of the quarter were impacted by broad stay-at-home orders, while consumer behavior had remained unrestricted until then.
………………………………………………………………………………………………………………………………
Earlier today, Omdia issued this press release:
Coronavirus crisis deals a $51 billion blow to the global mobile communications industry outlook Mobile revenue to drop 4.1 percent worldwide; regional impact to vary
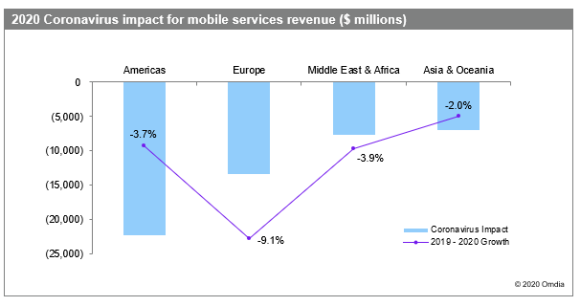
LONDON (April 30, 2020) — Mobile services represent critical infrastructure that’s allowing people to stay connected during the coronavirus crisis. However, that doesn’t mean these services are immune to the pandemic’s economic shock, with 2020 market revenue now expected to come in about $51 billion short of the previous forecast, according to Omdia.
Worldwide mobile communications services market revenue will total $749.7 billion this year, down from the prior forecast of $800.3 billion. This compares to $781.5 billion in 2019. Annual revenue will fall by 4.1 percent this year, with the decline amounting to $31.8 billion.
“Mobile phone companies around the world are experiencing usage spikes as more countries encourage or enforce social distancing and work-from-home rules to slow the spread of the COVID-19,” said Mike Roberts, research director at Omdia. “However, the spikes aren’t enough to overcome the impact of the pandemic on consumer behavior. These rules are having a dramatic impact on various regions of the world, halting new subscriptions and upgrades in the United States, while slashing revenue for operators in Europe.”
Consumer uptake of 5G will be slower than previously forecasted, due to the economic situation as well as the possibility of delays in 5G network deployment and in the availability of 5G devices. Omdia will release more details on 5G shortly.
In the Americas, mobile service revenue is set to decline by 3.7 percent to $237 billion in 2020. Most of that loss will come in the United States as both net additions and upgrades to higher data plans slow or stop altogether.
Europe will suffer the largest impact of the crisis, with mobile service revenue falling 9.1 percent to $131 billion, representing a downgrade of 9.3 percent compared to Omdia’s previous forecast. This decline will be driven by significant reductions in mobile prepaid revenue and a dramatic drop in inbound roaming revenue.
Vodafone UK, for example, said mobile Internet traffic has increased by 30 percent and mobile voice traffic by 42 percent due to the crisis. At the same time, mobile service providers are seeing new business grind to a halt as retail stores close and consumers stop buying new phones as job losses mount. One example of this widespread trend is AT&T, which is closing 40 percent of its retail stores in the United States.
The Middle East and Africa will see a 3.9 percent decline in mobile service revenues to $84 billion, representing a downgrade of 8.4 percent from Omdia’s previous forecast. Major factors for the decline include the impact of low oil prices on Gulf economies and the fragility of economies and health care systems in parts of Africa.
While the impact of the coronavirus on the mobile market is significant in every region, it pales in comparison to the impact the crisis is having on sectors such as travel, tourism, hospitality and retail, which have suffered partial or complete shutdowns. The International Monetary Fund now expects the global economy to contract by 3 percent in 2020, according to its latest World Economic Outlook, which was released earlier this month.
“The massive contraction will clearly impact every segment of the economy, including mobile, but how long it will last in each country and region is virtually impossible to predict,” Roberts said. “One bright spot is that in China, the first country hit by the pandemic, there are signs that the mobile market and broader economy is starting to come back to life.”
Given the high level of economic and commercial uncertainty created by the COVID-19 pandemic, Omdia will be producing a full revision of its global mobile forecasts next quarter.
About Omdia
Omdia is a global technology research powerhouse, established following the merger of the research division of Informa Tech (Ovum, Heavy Reading and Tractica) and the acquired IHS Markit technology research portfolio*.
We combine the expertise of over 400 analysts across the entire technology spectrum, analyzing 150 markets publishing 3,000 research solutions, reaching over 14,000 subscribers, and covering thousands of technology, media & telecommunications companies.
Strand Consulting: Why the Quality of Mobile Networks Differs
Many believe that a mobile application can measure the quality of the mobile and fixt network. Strand Consult’s new report “The Moment of Truth – Why the Quality of Mobile Networks Differs” describes the many factors that affect the network’s capacity and coverage and the user’s experience.
It assesses and compares the mobile apps which claim to measure network quality at a time when mobile networks are evolving from 2G, 3G and 4G to a combination of 4G and 5G. The next generation mobile networks are more complex and use technologies such as carrier aggregation, spectrum management, and multiple input/multiple output (MIMO). These innovations change how a network is built and operated and therefore also how the networks performance can be measured.
As each cellular network is constructed differently, making comparisons across operators is difficult. The simple measurements collected and presented on a glossy app and the user’s experience will also differ considerably for various reasons.
While the effort to bring facts and evidence to policy and regulatory discussions is welcome, network measurement data from mobile apps is increasingly presented without adequate scientific and methodological background. Users of the various apps are perplexed about wildly differing measurements reported by the individual app even if the tests are run at the same time, in the same location and on the same device.
The same data may be used to praise a mobile operator one day but then to rank it in the bottom the next. Moreover, the performance of mobile operators varies widely across different apps. Vodafone, Orange, EE, Telia, Telenor, AT&T, Verizon, and Telefonica, and others have appeared either at the top or bottom of any one app report. This says more about the design of the app than the quality of any one network.
The report “The Moment of Truth – Why the Quality of Mobile Networks Differs” reviews the mobile apps and provides a common framework to judge their usefulness and applicability by better understanding they inner workings, potential and pitfalls.
Strand Consult’s report “The Moment of Truth – Why the Quality of Mobile Networks Differs” is offered either with or without a workshop. The report focuses on the many factors that influence the experience of network coverage, quality, and the capacity.
The report’s chapters include:
- A review of the leading mobile network measurement apps. We describe and categorize how and which data the apps collect. We assess the marketing strategies of the apps in what they purport to measure versus the scientific state of the art of what can be measured.
- An analysis of how the app interacts with the mobile phone and how the phone’s specifications can influence resulting network measurement. International examples are provided to demonstrate how wildly measurements can vary.
- A review of the question of network quality in light of the relevant market factors. Network performance is mapped against factors such as gross domestic product (GDP), churn, ARPU, and so on.
- An examination of the conditions for infrastructure development in the relevant country and different policies used by government actors for network deployment. It details how rollout policies vary considerably and compares these results to reported network quality, coverage, and capacity.
- The report also examines measurement tools either mandated or preferred by telecom regulatory policies. The report examines the scientific basis for these tools and whether they can measure what they claim.
- Viewpoints and analysis which is helpful to improve the discussion about the quality of mobile coverage and its measurement and can help to increase the scientific understanding of policymakers, press, and the public.
Strand Consult’s new report “The Moment of Truth – Why the Quality of Mobile Networks Differs” provides valuable scientific, policy, and market background to bring context to the growing popularity of network quality measurement by mobile apps. The report will help policymakers focus on the facts and other important scientific information when deciding how to measure network quality and what role apps should have in policy.
The report demonstrates that relying on mobile apps to measure network quality provides an incomplete and inaccurate picture of the network. It is based in part upon 7 years of experience of working with mobile coverage policy, regulatory issues and mobile measurement app initiatives across several countries.
If you want to know more, please request more information about our unique new report.
Juniper Research: Cellco revenues to fall by $50B over next 5 years
Juniper Research has identified a series of new revenue opportunities and cost savings which collectively could enable operators to sustain, or even increase, margins. Here are two of them:
The study claimed that the opportunities afforded by the IoT (Internet of Things) should enable operators to increase revenues from that sector by over $8 billion by 2022. It also argued that A2P messaging adoption across a number of key verticals including marketing, banking and healthcare should result in a similar uplift in revenues from that source.
Meanwhile, the report highlighted a series of measures by which costs could be reduced, including network virtualization, the implementation of next-generation firewalls and improving customer relationship management.
The research also assessed the extent to which 15 leading operators across Europe and North America were in a position to implement innovation strategies. The Juniper Operator Innovation Index identified 2 main players, AT&T and BT, as “Leaders” in this space.
According to research author Dr Windsor Holden, “AT&T is a market leader in terms of IoT implementations and adoptions, while both AT&T and BT are at the forefront of research into (and deployment of) virtualizsation of the network.”
For more insights, download Juniper’s complimentary whitepaper, ‘Mobile Operators ~ 5 Mission Critical Strategies to Future-proof Your Business.’
…………………………………………………………………………………
Intriguing claim: Cellco IoT revenue grows fast, but not fast enough
Operators’ enterprise reporting is poor and reporting on IoT is even worse. We are aware of only four operators (Telstra, Telefónica, Verizon and Vodafone) that regularly report IoT revenue, and only 11 that report connection numbers. For a segment that is supposedly key to future growth, operators are remarkably shy about providing progress updates.
The operators that do provide information are, by definition, atypical. That they are providing data at all probably skews the sample. We can, however, still glean some useful insights by exploring the data that is available.