

2016 Telecom Capex Flat with Asia Pacific Largest Spender
By Stéphane Téral, senior research director, mobile infrastructure and carrier economics, IHS Markit
Bottom Line:
- There will be flat to very moderate growth in global service provider capital expenditures (capex) in 2016
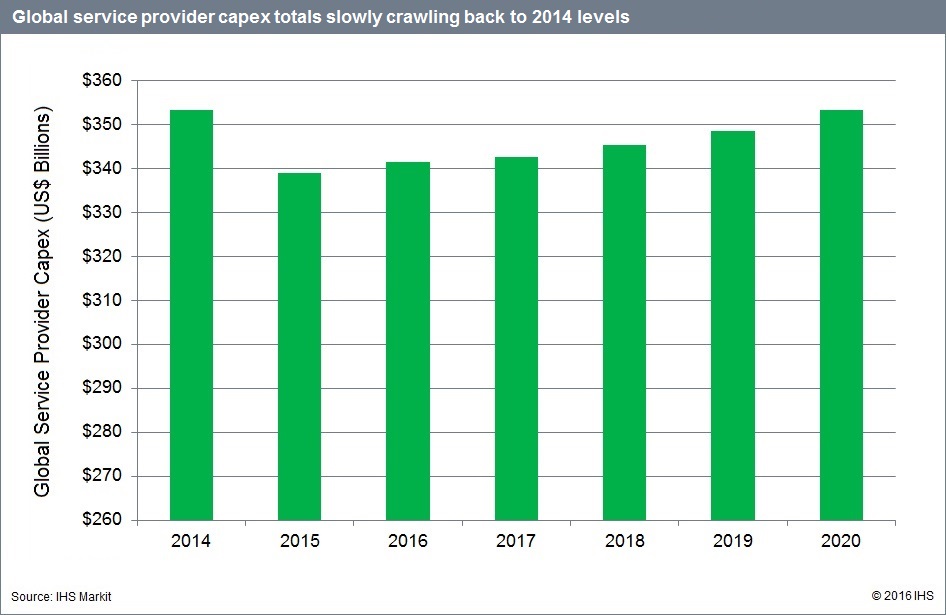
- However, worldwide service provider capex spending is slowly crawling back to 2014 levels
- Asia Pacific is the world’s largest telecom spender and revenue contributor
IHS Analysis:
The telecom industry has been cyclical since the great telecom crash of March 2000, which is typical of deregulated industries. Investment goes through cycles of ups and downs that are more or less pronounced depending on how the major players react.
For 2016, large differences in regional investment agendas point to regional and national cycle de-synchronization—and, consequently, global flatness to very moderate growth in capital expenditures. This is a result of low-digit growth in North America, Europe, the Middle East and Africa (EMEA) and the Caribbean and Latin America (CALA) that is offset by a China-driven decline in Asia Pacific.
We forecast worldwide service provider capex to rise just 0.7 percent to US$341 billion by the end of this year, mainly propelled by a much-needed wave of investment in wireline broadband—for example, fiber to the X (FTTX)—in Europe. Spending on every type of hardware equipment except wireless and time-division multiplexing (TDM) voice will rise in 2016. Meanwhile, capitalized software that is captured in the non-telecom/datacom category—around half of total capex—is expected to grow by double-digit percentages.
As illustrated in the chart below, the service provider capex growth rate slowed down in 2015 followed by a pickup in 2016 that signals long-term flatness triggered by the combination of moderate desynchronized regional investment cycles, themselves triggered by very distinct agendas.
Telcos continue to account for the lion’s share of capex, at more than 88 percent. And from a geographic standpoint, Asia Pacific will remain the world’s largest spender (42 percent share), while North America stays roughly even, followed by EMEA and CALA.
Looking at earnings, the telecommunications service revenue picture remains mixed and contrasted across geographical regions. While global telecom service revenue declined 4 percent year-over-year in 2015, we project it to grow by over a percentage point this year to US$1.93 trillion. Asia Pacific is the world’s largest telecom revenue contributor, shadowed closely by North America—the globe’s most lucrative market.
Capex Report Synopsis:
The biannual IHS Markit service provider capex report provides worldwide and regional market size, forecasts through 2020, analysis and trends for revenue and capex by service provider type (telcos and cable operators) and capex by equipment type (broadband aggregation equipment; wireless infrastructure; IP routers and carrier Ethernet switches; optical equipment; IP and TDM voice infrastructure; video infrastructure; all other telecom/datacom network equipment; and CPE non-telecom/datacom network equipment).
For information about purchasing this report, contact the sales department at IHS Markit in the Americas at (844) 301-7334 or[email protected]; in Europe, Middle East and Africa (EMEA) at +44 1344 328 300 or [email protected]; or Asia-Pacific (APAC) at +604 291 3600 or [email protected]
Related articles:
Telecom’s Capex Tailspin Is Leaving Few Firms Unscathed
Ovum: Communications Provider Revenues & Capex Forecast: 2016–21
