

Month: May 2013
IEEE Tour to Sprint’s M2M Collaboration Center & Fiber Optic POP in Burlingame, CA
- Offer new tools and capabilities
- Enable development through a universal framework and via partners
- Embrace, advocate and leverage open operating systems
- Accelerate speed to market
- Support and manage the ecosystem
- Ensure enabled services work in the most efficient manner
- Develop polices to guarantee “best in class” customer experience
- Accelerate time to market to realize potential revenue quicker (e.g. from 9 months to 4 months)
- Enablement and choice of 2G/3G/4G networks and related features
- Working with Sprint on the proper data plan for M2M communications (it’s not at all based on commercial cellular network data plans. Instead, it is a custom plan for each M2M partner company, depending on their bandwith and and latency/priority traffic requirements
- Sprint provides it’s lab resources and applications engineers (at the Center) free of charge to partner companies. They hope that will establish sufficient trust, so that the company developing and/or testing their M2M products/proto-types will use Sprint as their wireless carrier of choice.
Bob Metcalfe’s Closing Keynote at Ethernet Innovation Summit – May 23, 2013, CHM in Mt View, CA
Bob Metcalfe’s keynote wrapped up the 2 day, information packed Ethernet Innovation Summit, organized by NetEvents.org. It can be viewed at:
http://www.netevents.org.uk/celebrating-40-years-of-ethernet-innovation-closing-keynote
Here are Professor Metcalfe’s main points, which summarized this excellent event:
-A key lesson learned from the early development of Ethernet (at XEROX PARC) was how to innovate.
-In 2012, Carrier Ethernet (CE) data traffic eclipsed the sum of ALL legacy wire-line traffic, including T1 private lines! And CE traffic continues to increase rapidly.
-$70B CE equipment and services is estimated to be $70B in 2013; growing to over $100B by 2017 (Source: Vertical Systems Group)
-Verizon just announced it will be extending its fiber optic network to 120K new office buildings. That will facilitate a lot more fiber based Carrier Ethernet services to business customers.
-The MEF Services Operations committee was announced. It will seek to provide guidelines to manage operations for mutli-carrier Ethernet networks. The results will hopefully be more consistent contracts and clarification of different CE providers’ capabilities and a standardized ordering process that takes into account national regulatory factors as well as the greater diversity of CE services.
-Formation of the Cloud Ethernet Forum was announced as well as its relationship with the MEF. The new Forum will address the specific issues of scaling and applying suitable Ethernet services to meet the stringent demands of delivering cloud services. http://online.wsj.com/article/PR-CO-20130523-912875.html
NOTE: This new Cloud Ethernet Forum should NOT be confused with the MEF’s spec on CE Delivery of Private Cloud Services.
-“Our goal (at Xerox and 3Com) was to make Ethernet a commodity. And it’s been happening- in both silicon and boxes,” Metcalfe said.
-Interoperability ethic of Ethernet brand helped make it successful. It’s possible to conform to a standard, but not interoperate, because of different vendor equipment implementing different options in the standard. Interoperability “plug fests” for all versions of Ethernet went a long way to establish this ethic and thereby increase Ethernet’s market size.
-Rapid evolution of the Ethernet standard (IEEE 802.3), while maintaining backward compatibility was very important to Ethernet’s success. Different speed versions of Ethernet could be sorted out and determined by an auto-negotiation capability used at start-up time (before the information transfer phase).
-The reason Ethernet first ran at 2.94M b/sec (i.e. the version developed in 1973-74) was because there wasn’t room on the network interface card for a clock circuit, so he and co-inventor Dave Boggs derived the Ethernet clock signal from the system clock on the backplane (used to connect printed circuit boards). It turned out to be 2.94M b/sec.
-The next version of Ethernet (designed in 1978-79 by Ron Crane), ran at 10M b/sec and was the basis for the so called DIX (DEC, Intel, Xerox) specification published on September 30, 1980: “The Ethernet, A Local Area Network. Data Link Layer and Physical Layer Specifications.” Later that year, the spec was submitted to IEEE 802* as the proposed single standard for LANs.
*Note: From 1980-1982, the IEEE 802 committee had not yet been divided into working groups. The first IEEE 802.3 Ethernet standard – 10BASE5 (10 Mb/sec, Baseband transmission, 500m without repeaters) – was published in 1983.
-Panelists and Metcalfe observed that U.S. government and Corporate research is not what it used to be (it’s greatly decreased in the past few years). That’s not good for the innovation process.
During the Q & A part of this closing session, the audience was captivated by Bob’s war stories – like being told the commoditization of Ethernet would doom 3Com. In fact, the higher volumes of Ethernet products sold by 3Com enabled the company to survive and thrive. “3Com is most successful acquisition HP ever made,” Metcalfe said to applause from the audience.
Metcalfe told the now famous Ron Crane “ceiling tile” story -at least his version of it. (The author has heard Crane’s version). He then acknowledged Crane’s foresight by telling the “lightniing strikes” story. Crane insisted on designing lightning protection into 3Com’s Ethernet NIC for the IBM PC, which was neither in the IEEE 802.3 Ethernet standard, 3Com’s design spec, nor was it requested by 3COM’s customers. 3Com then sold 1,000 cards to a New York City bank which hedged its bets by buying 1,000 cards from a different Ethernet NIC vendor. Lightning struck the NYC building, the 3Com cards continued to work, while the competitor cards were fried by the power surge. 3Com sold another 1,000 cards to the bank immediately thereafter, as a result of the built-in lightning surge protection.
Note: There is also a 1993 “kite flying” story that measured RF interference from nearby radio stations for the version of 100 M b/sec Ethernet that used telephone grade unshielded twisted pairs (UTP-3). Ron insisted that such interference was an issue, even though “IEEE 802.3 Fast Ethernet” was not intended for outdoor deployments. But that is a story for another time, or maybe never.
“Why did 3Com win in the LAN wars of the mid to late 1980s?” this author asked. Metcalfe responded, “We had a time machine. Our Ethernet team at Xerox PARC went into the future and then came back. As a result, we knew what the future would look like. Others, like as Ralph Ungermann (co-founder of Ungermann-Bass) worked on Ethernet concentrators for dumb (ASYNC ASCII) terminals but at 3COM we designed Ethernet cards for PCs cause we knew there would soon be PCs on everyone’s desks.”
And why would Ethernet keep getting faster and used more widely in so many different ways? Metcalfe’s philosophy was: “Build it, and they [the network configurations and applications] will come.” Today, we have Ethernet dominating the: workgroup (wired) LAN, campus LAN, Data Center switching, enterprise networks, access to IP-VPNs, Carrier Ethernet and other market segments. You can’t argue with success and ubiquity!
References:
http://www.netevents.org.uk/ethernet-innovation-summit
http://www.netevents.org.uk/celebrating-40-years-of-ethernet-innovation-closing-keynote
http://www.eweek.com/innovation/ethernet-invention-revealed-the-origins-of-innovation/
http://www.theregister.co.uk/2013/05/22/metcalfe_on_moocs/
http://scriptpirates.com/topic/1024-as-ethernet-turns-40-some-seek-to-take-it-to-the-cloud-ethernet/
Videos of the 2 day event: All video content can be found at the following URL’s :
http://www.netevents.org.uk/celebrating-40-years-of-ethernet-innovation-day-2-introduction
http://www.netevents.org.uk/celebrating-40-years-of-ethernet-innovation-session-5
http://www.netevents.org.uk/celebrating-40-years-of-ethernet-innovation-session-6
http://www.netevents.org.uk/celebrating-40-years-of-ethernet-innovation-session-7
http://www.netevents.org.uk/celebrating-40-years-of-ethernet-innovation-session-8
http://www.netevents.org.uk/celebrating-40-years-of-ethernet-innovation-session-9
http://www.netevents.org.uk/celebrating-40-years-of-ethernet-innovation-closing-keynote
NetEvents announces 2013 Innovation Award Winners at Ethernet Innovation Summit
These prestigious awards recognise the very best in the Technology industry and reward the leading individuals and organisations for innovation and performance in the networking and telecommunications sector.
An independent panel of highly respected judges (including this author) voted for 1st, 2nd and 3rd place nominees in each category.
Innovation 2013 Award Winners by Category:
- Carrier Ethernet Business Services- Verizon – Transparent LAN service
- Telecoms Product- RAD Data Communications – MiNiD
- Enterprise Wireless Solutions – Xirrus – Enterprise Wireless
- Cloud/Datacenter Solution-Arista Networks – 7500 ‘E’ Series Data Center Switch
- Security Solution- Click Security – Realtime Security Analysis
- SDN Solution- HP – Sentinel Security Application
- Hottest ‘NEW’ Networking Company – Gigamon
- ‘Ethernet Idol’-Andy Bechtolsheim of Arista Networks
References:
Pics of Innovation Award Winners: http://www.netevents.org.uk/portfolio/innovation-awards-2013
Ethernet Innovation Summit Program at:
http://www.netevents.org.uk/portfolio/global-press-analyst-summit
Day 1 videos can be viewed at: http://www.netevents.org.uk/global-netevents-summit-live
Related articles at:
Infonetics and Frost & Sullivan on Optical Network Hardware and 100G WAN Market
1. Infonetics Research released vendor market share and preliminary analysis from its 1st quarter 2013 (1Q13) Optical Network Hardware report. (Full report published May 24). This new report provides worldwide and regional market size, market share, forecasts through 2017, analysis, and trends for metro and long haul SONET/SDH and WDM equipment, Ethernet optical ports, SONET/SDH/POS ports, and WDM ports. Companies tracked: ADVA, Alcatel-Lucent, Ciena, Cisco, Cyan, ECI Telecom, Fujitsu, Huawei, Infinera, NEC, Coriant (Nokia Siemens Networks), Tellabs, Transmode, Tyco Telecom, ZTE, and others.
OPTICAL MARKET HIGHLIGHTS:
. Worldwide, the overall optical network hardware market, including SONET/SDH and WDM equipment, totaled $2.6 billion in 1Q13
. North America was the only region to post growth in overall optical hardware revenue on a quarterly basis in 1Q13, up 7.5% from 4Q12
. Topping the optical market share leaderboard in 1Q13 are, in alphabetical order, Alcatel-Lucent, Ciena, Fujitsu, Huawei and ZTE
. Ciena is now a larger supplier of WDM gear than Alcatel-Lucent and is 2nd only to Huawei
. Cyan, now publicly traded, grew revenue 86% year-over-year (and is now tracked in Infonetics’ Optical Network Hardware report)
. Nokia-Siemens completed its divestiture of its optical division, now called Coriant (also tracked in Infonetics’ optical report)
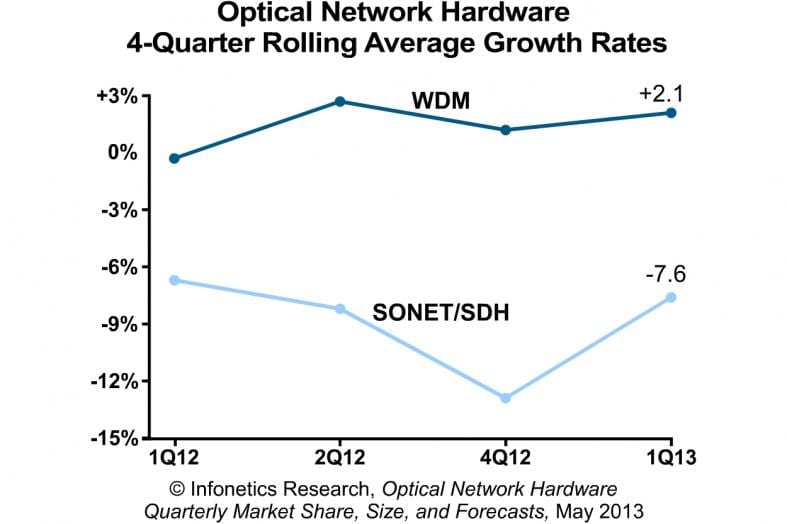
“The 4-quarter rolling average for global optical WDM equipment revenue notched a third consecutive quarter of growth in 1Q13, and we believe the market will continue trending in a positive direction this year,” notes Andrew Schmitt, principal analyst for optical at Infonetics Research.
Schmitt adds: “On a year-over-year basis (1Q12 vs. 1Q13), total optical spending is down 5%, but this is only a result of massive cuts in legacy (SONET/SDH) spending over the past 12 months (down 30%). The WDM segment is up 10% year-over year, a welcome sign that spending in this more relevant segment is returning to long-term trend levels. I won’t call it a recovery until WDM revenue is up by double-digit percents for several quarters on a year-over-year basis, but 2013 is looking good, especially in North America and China, where 100G rollouts are picking up speed.”
To buy the report, contact Infonetics: http://www.infonetics.com/contact.asp
INFONETICS WEBINARS
Visit https://www.infonetics.com/infonetics-events to attend, view on demand, or sponsor Infonetics webinars. Topics available for sponsorship include 100G, OTN, P-OTS, and ROADMs. See http://www.infonetics.com/downloads/Infonetics-Webinars-Available-for-Sponsorship.pdf.
. 100G Optics: Why Operators Are Upgrading Now (Available on demand)
. Leveraging Next-Gen Policy Management Solutions (June 11)
. Integrating SDNs Into the Service Provider Network (June 26)
RELATED OPTICAL RESEARCH from Infonetics:
. Latest Infonetics Optical research brief: http://bit.ly/14JNNRg
. OTN switching reaching mainstream status with service providers
. 100G optical transceiver shipments more than doubling in 2013 and 2014
. Optical transport network (OTN) market to top $13 billion by 2017
. Breakout growth ahead for OTN switching
. Optical transceiver market bolstered as 100G arrives in force
2. Frost & Sullivan Estimates Global 100G Market to Continue to Grow, Reaching $4.8 Billion by 2016
Enterprises and data centers are fueling the global 100G optical network market, which is predicted to increase at a 52.2 percent compound annual growth rate (CAGR), reaching $4.8 billion by 2016, according to market research firm Frost & Sullivan. Since its inception in 2010, the market has growth by 210 percent in 2011 and 387 percent in 2012, according to the research firm.
Alcatel-Lucent, Huawei, Infinera, Ciena and ZTE are the top five 100G vendors, accounting for over 76.2 percent of the market share by unit shipments. The research firm expects these firms to continue to dominate the market because of high barriers to market entry.
According to Frost & Sullivan, the market is mainly driven by the demand for high quality broadband network services, especially by the growing IP traffic and number of broadband subscription during recent years and in the future.
Implementing a 100G optical network results in high network efficiency and reduced per byte transmission costs for data, the research firm noted. Future 100G applications include 4G LTE broadband wireless, metro optical networks and ultra-long reach networks.
Read more: http://www.frost.com/prod/servlet/press-release.pag?docid=278508117
Last week, DukeNet Communications, a regional fiber network provider in the southeastern United States, announced the deployment of 100G across its service area.
http://www.lightwaveonline.com/articles/2013/05/dukenet-communications-touts-100g-capabilities.html
MoCA driving growth in home networking market. Why not ITU G.hn or any version of WiFi?
Introduction:
Market research firm Infonetics Research released excerpts from its latest Home Networking Devices vendor market share and forecast report, which tracks residential gateways; broadband routers; HomePlug Powerline adapters; multimedia over coax (MoCA) set-top boxes (STBs), optical network terminals (ONTs), and coax-Ethernet adapters; and HPNA/G.hn adapters.
HOME NETWORKING MARKET HIGHLIGHTS:
. The global home networking device market totaled $4.9 billion in the second half of 2012 (2H12)- a 5% increase over the first half of 2012 (1H12)
. Sales of set-top boxes with embedded MoCA technology grew 23% in 2H12, while MoCA adapters, though
still shipping in small amounts, soared 129%
. Broadband router revenue grew 6% in 2H12, thanks to shipments of higher-end 802.11ac and 802.11n WiFi routers in North America and EMEA (Europe, the Middle East, and Africa )
. In the race for broadband router revenue market share, Actiontec saw the biggest jump, up 30% from 1H12
. North America is the home networking device revenue share leader, capturing 45% of global 2H12 revenue
. Infonetics expects MoCA STBs to account for 46% of home networking device sales by 2017
“MoCA (multimedia over coax) is again driving growth in the home networking device market, particularly shipments of video gateways in North America,” notes Jeff Heynen, directing analyst for broadband access and pay TV at Infonetics
Research.
“Deployments of cable and satellite STBs with integrated MoCA are slowly reaching a boil, and we expect DirecTV’s Genie, Dish’s Hopper, and Comcast’s XG1 set tops to see increased shipments throughout 2013 and beyond.”
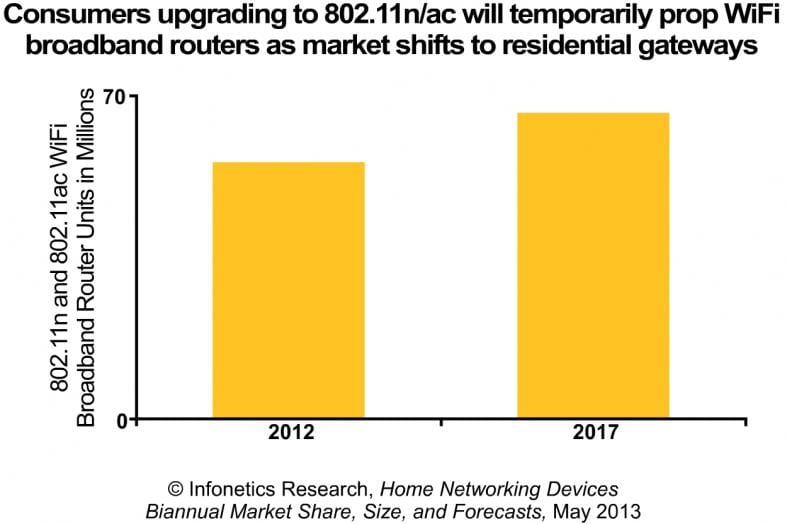
Infonetics believes the home networking market is shifting from broadband routers to residential gateways. Temporarily, the broadband router market will get propped up as consumers upgrade to IEEE 802.11n and 802.11ac broadband routers as per the graph below. “However, with the market shifting to residential gateways, the lift will not last,” according to Infonetics Marketing Director Kimberly Peinado.
AW Comment: AT&T has integrated WiFi into its U-Verse residential gateway, which connects home PC/gadgets and the U-Verse TV set top box to/from the U-Verse access network.
Alan W comment:
Note that G.hn is now 3 years old, but hasn’t picked up market traction. http://en.wikipedia.org/wiki/G.hn
Neither has IEEE 802.11n which was expected to be used for video distribution in home networks. http://www.ieee.org/about/news/2009/11september.html
REPORT SYNOPSIS:
Infonetics’ biannual home networking report provides worldwide and regional market size, vendor market share, forecasts through 2017, analysis, and trends for residential gateways; MoCA STBs, ONTs, and coax-Ethernet adapters; wired and WiFi broadband routers (HomePlug Powerline, MoCA, and HPNA/G.hn); HomePlug Powerline adapters; and HPNA/G.hn adapters. Companies tracked: Actiontec, Alcatel Lucent, ARRIS, AVM, Belkin, Cisco, Comtrend, D-Link, Huawei, Motorola, NETGEAR, Pace, Sagemcom, SMC Networks, Technicolor, TP-LINK, TrendNet, Ubee Interactive, ZTE, ZyXEL, and others.
To buy the report, contact Infonetics:
http://www.infonetics.com/contact.asp
INFONETICS WEBINARS:
Visit https://www.infonetics.com/infonetics-events to register for upcoming webinars, to view recent webinars on demand, or to learn about sponsoring a webinar.
. Securing and Managing Mobile Devices in a BYOD World (View on demand)
. Preparing Enterprise Networks for a Wireless Multi-Device World (View on demand)
. Leveraging Hotspot 2.0 for Carrier WiFi Networks (May 16: View live or on demand)
. The Transcoder Boom in a Multiscreen World (Sponsorships available)
RELATED RESEARCH: Infonetics May Broadband Access research brief: http://bit.ly/ZYr9kC
Smart Cities
Smart Cities
Mischa Dohler , Carlo Ratti, Jurij Paraszczak, Gordon Falconer
It is through Information and Communications Technologies (ICT) that Smart Cities are truly turning “smart”. This is facilitated by means of services that use, among others, networked sensors and actuators deployed in the city, allowing the monitoring of the urban environment in real-time, to react just in time if needed and to establish automated control processes with less or even without human intervention.
Given the importance of ICT, we are currently witnessing a shift of industries in the urban space: an arena prior dominated by heavy infrastructure providers, is now increasingly occupied by operators and service providers. This is being facilitated by an important transition within the ICT sector from simply providing data pipes towards designs which exploit the actual content of the gathered data. Said “Big Data”, collected from the crowd or sensors, provides unprecedented opportunities to optimize operations in a city and thus improve urban living.
This special issue, the first of its kind, focuses on ICT technologies, allowing for Smart City rollouts, deployments and growth. Part of the gamut of technologies have been researched and developed for years already, others are new. However, their composition and application in the area of smart cities is unparalleled and accounts for the tremendous upsurge of work in this area, which is mainly attributed to the unique timing between the undeniable need for making cities more efficient, and an enormous set of ICT technologies having become available and affordable.
From the large number of submissions, we have assembled nine papers which yield a fairly complementary and complete picture of the technology landscape in smart city developments: 1) smart city business models; 2) architectural implications due to business models; 3) wireless access of smart city traffic through M2M; 4) wired backbone offload of aggregated smart city traffic; 5) management of these heterogeneous technologies; 6) crowd-sourced data from/for smarter cities; 7) Big Data mining approaches; 8) Big Data exploitation through API-stores; and 9) privacy issues.
We hope that this feature issue appeals to both the academic and industrial readership, and inspires future work in the emerging area of Smart Cities.
Cisco Transitions from Network Equipment to an IT Company: Will SDN Overlays Help?
Cisco Systems, the world’s largest supplier of Internet routers and switches, has struggled over the past year as slowing product sales and sliding data-center equipment prices hurt performance in its core business. The company has responded by diversifying its revenue base with more profitable software and services—yet tight corporate budgets and government cutbacks have made the transition harder to accomplish.
“A lot of the challenge stems from weak public-sector spending, in particular U.S. federal, along with softness in financial services,” Juniper Chief Executive Kevin Johnson said last month after delivering a weaker-than-expected view of
future revenue. “We have communicated steadily over the last several quarters about expected weakness in federal. We do not expect this pattern to improve in the near term.”
“When the economy fluctuates, one of the first things people cut back on is Cisco boxes,” J.P. Morgan analyst Rod Hall said, because a large part of Cisco’s sales aren’t subject to a recurring contract. “That’s why it’s such a good bellwether.”
The slowdown in sales of routing and switching gear reflects many companies’ decisions to hold onto equipment longer, according to ISI Group analyst Brian Marshall. “Cisco is making the best of a difficult situation,” Mr. Marshall said.
“They’ve got a big chunk of their business coming from an area that’s a single-digit growth market.”
Cisco has taken steps to shuffle its product portfolio. It recently sold the Linksys home-router business to Belkin International Inc., soon after acquiring wireless-carrier software developer Intucell Ltd. for $475 million and Meraki
Inc., a provider of Enterprise WiFi equipment for midsize businesses, for $1.2 billion.
The acquisitions fit with Chief Executive John Chambers‘s effort to recast Cisco as more of an IT company than just a
seller of network equipment. The company has pledged to double its software revenue over the next few years as it diversifies its customer base beyond machines that shuttle data between computers. For example, Cisco’s data-center servers are typically less profitable than high-end routers, yet they helped support its revenue over the past year when router sales sputtered.
http://online.wsj.com/article/SB10001424127887324244304578474904040636278.html
Cisco’s Open Network Environment is the company’s response to SDN. It’s based on “Virtual Network Overlays” and is differentiated from SDN as follows (i.e. according to Cisco):
• First, network programmability and many of the use cases that benefit from it require APIs or interfaces at multiple layers of the network (not just at the control and forwarding planes). There are deeper internals in our operating systems, and even hardware and ASICs, that can be accessed to extend and enhance the network. Similarly, further up this network stack are higher level services, such as the management and orchestration APIs, for example, our Network Services Manager (NSM) API that supports orchestration and cloud portal applications such as Cisco® Intelligent Automation for Cloud (CIAC). In the Cisco environment, we imagine an application development environment that can access APIs at all levels of this stack.
• Second, many of the use cases for which organizations are looking not only require programming the network to the desired or optimal behavior, but also are seeking to extract the enormous amount of information and intelligence contained in the network infrastructure. Deeper and more insightful network intelligence can be pulled into a new class of analytical applications that can promote more sophisticated network policies and support business logic that impels the network. This ultimately makes the network more valuable and can support more innovative and revenue-generating services.
http://www.cisco.com/en/US/prod/collateral/iosswrel/content/white_paper_c11-707978.html
http://www.cs.virginia.edu/~cs757/slidespdf/757-09-overlay.pdf
http://tools.ietf.org/html/draft-drao-bgp-l3vpn-virtual-network-overlays-00
FBR’s Scott Thompson wrote in an email that “SDN Overlay solutions are gaining more traction than expected, which lessens the near term pressure on Cisco’s switch/router revenues.”
“SDN overlays provide opex savings and rapid service deployment, diminishes need for service providers to aggressively reach for cost parity with hyperscale competitors. Our discussions at Interop revealed that hybrid/overlay SDN networks are beginning to gain momentum among the service provider and large enterprises.
Overlay SDN solutions provide network-wide provisioning across both traditional and full SDN-based architectures. While we expect hybrid/overlay SDN solutions will allow large-scale networks to drive significant opex savings, they also appear to slow the transition to new architectures that could significantly affect traditional revenue streams. This is likely to allow traditional networking vendors additional time to shift to more software-based business models. For Cisco, we expect this development could drive two to four quarters of respectable returns before commodity and silicon-based network architectures begin to affect Cisco’s financials.”
“Checks indicate that both service provider and large enterprise channels have found the implementation of Network Function Virtualization (NFV) and SDN solutions more time consuming and costly than initially expected. Initial setbacks with carrier implementation of NFV and SDN technologies are likely to provide Cisco additional time to develop product that will help to transition its customer base to more software- and service-based revenue.”
Closing Comment: We are quite surprised by Thompson’s last statement regarding ” implementation of Network Function Virtualization (NFV) and SDN solutions more time consuming and costly than initially expected.” How can something be implemented if it is not fully standardized? Especially NFV where ETSI NFV ISG is NOT producing any standards!
NTT Communications Cloud Revenue up 17.9%; Total Group Revenue DOWN 1.5%; SDN Enterprise Cloud Expands
Japan’s NTT Communications posted a 12% jump in profit for the year ending in March, as subsidiary NTT DoCoMo announced a management shake-up.
NTT Com recorded a full-year net profit of 65.3 billion yen ($643.1 million). But group operating revenues fell 1.5% to 1.19 trillion yen. Total data networks revenue fell 0.7% to 427 billion yen, and group voice revenues slumped 9.1% to 320 billion yen.
NTT Com posted strong gains in cloud platform revenue (up 17.9% to 99 billion yen), as well as applications and content revenue (up 4.9% to 108 billion yen.). The company made progress with its plan of leveraging its expertise as a telecom operator to become a one-stop ICT outsourcing shop. As of the end of the year, NTT Com had global data centers in 144 locations, and was offering its Enterprise Cloud services in nine countries.
NTT Data’s revenues and operating income went up due to an increase in the number of consolidated subsidiaries. Mobile unit NTT Docomo saw revenues increase on higher handset sales and and new areas of revenues, but operating income decreased. At NTT Communications, operating revenues continued to fall but operating income reose on cost reductions.
NTT group ended the period with 17.30 million customers for its fibre optic service called Flet’s Hikari after adding 740,000 new subscribers in the year. The company aims to attract 1 million new subscribers this year. The company also had 15.17 million Hikari Denwa customers after adding 1.27 million new customers for the optical IP telephone service and the ADSL customer base continued to contract to 1.85 million. The company’s mobile unit, NTT Docomo, ended the quarter with 61.54 million subscribers, which includes 11.57 million Xi (LTE) customers. NTT also had 4.19 million TV subscribers, comprising 3 million.
Looking ahead to the current financial year, NTT Com warned that with Japan’s economy still struggling and the global economic slowdown continuing, “the future direction of the domestic economy remains uncertain.” But the company is still predicting a 2.5% increase in group operating revenues for the year to 1.225 trillion yen.
Separately, domestic subsidiary NTT DoCoMo announced significant proposed changes to its management team.
As the first service provider in the world to embrace SDN and the OpenFlow communications interface, NTT Com launched its SDN-based Enterprise Cloud in June 2012 via data centers in Japan and Hong Kong. With the addition of data centers in Singapore, England, and Virginia and California in the United States, the Enterprise Cloud became available on a global basis in February 2013. Within this spring, NTT Com’s Enterprise Cloud will include SDN in eight countries and ten locations. Clients have used the self-manageable Enterprise Cloud platform to flexibly extend their own data centers, gaining cost-optimized and secure compute capacity as a result.
“NTT Communications’ Enterprise Cloud is gaining traction in several sectors, especially among global manufacturers looking to consolidate systems and assets,” said Mr. Yukio Ito, Senior Vice President of Service Infrastructure at NTT Com. “Global enterprises continue to look to NTT Com as a partner of choice for real-world cloud transformation, relying on our foundation of advisory, migration, operational and management services.”
“Successful enterprise clouds will need to provide flexible connectivity at a speed and price point that mirrors the rapid and low-cost delivery of virtual machines,” said Caroline Chappell, Senior Analyst, Heavy Reading, a division of UBM Tech. “Current approaches to data center networking don’t scale and are expensive because of the level of manual configuration involved. NTT Com’s early adoption of SDN gives it the opportunity to transform customer experience of cloud services, as well as the operational costs associated with running them. NTT Com is therefore in a strong position to lead the global market for cloud services going forward.”
http://www.telecomasia.net/content/ntt-com-fy-profit-grows-12 and
http://www.telecompaper.com/news/ntt-sees-fy-2012-profit-grow-12–942826
TW Telecom Inc 1stQ 2013 Results with Bold Statements by CEO on Earnings Call; Commentary by FBR & Telecom Ramblings
TW Telecom Inc announced first quarter 2013 financial results, including $381.2 million of revenue, $13.1 million of net income, $136.0 million of Modified EBITDA, $81.6 million of net cash provided by operating activities and $23.9 million of levered free cash flow
“We’ve had a productive start to the year, as we commenced our growth initiatives, delivered ongoing revenue growth and cash flow generation and executed several strategic balance sheet activities,” said Larissa Herda, tw telecom’s Chairman, CEO and President. “The growth initiatives we announced in February are under way as we focus on delivering additional product innovation, increasing our sales coverage, as well as further automating the business and expanding our market reach. Everything we’re doing is to increase our sales momentum and the trajectory of our revenue growth as we continue with our comprehensive balanced approach to win market share.”
http://newsroom.twtelecom.com/2013-05-06-tw-telecom-Reports-First-Quarter-2013-Results
David Dixon of FBR Capital Markets wrote in an email: “tw telecom inc. (TWTC) reported 1Q13 results, with EBITDA and Free Cash Flow below consensus. Capex spending was in line with estimates. Management is aggressively investing in fiber deployments in growth markets and is planning to increase the sales force by 10% in FY2013, anticipating revenue improvement in 2014.”
Author’s Note: Our sources reveal that tw telecom did NOT follow through on their planned fiber network build-out in the San Jose, CA/ Silicon Valley metro area. Instead, the company was forced to resell AT&T facilities (referred to as Type 2 circuits or facilities). I guess Silicon Valley is NOT considered a growth market. Key features like “Dynamic Capacity” are not possible using Type 2 telco facilities which are actually provided by a facilities based carrier. In addition, there is no automated customer problem reporting or fault diagnosis for Type 2 facilities. Instead there’s a hierarchy of phone call escalation procedures the customer must adhere to when an outage or other problem is experienced.
Mr. Dixon of FBR added, “The trend away from dynamic network provisioning (on its own) to combined dynamic provisioning of the application AND network by major carriers (e.g. network virtualization and/or software defined networking) suggests that medium-term revenue growth will be more challenging over time.”
Bold statements by Larissa Herda, CEO and President, during tw telecom’s earnings call:
“We’re advancing the development of our Constellation platform. With this unique platform, we’re creating a powerful operating paradigm for enterprises to increase the velocity of how they buy our network services, driven by the ability to more quickly access and consume network and IT services. We’re in the process of hiring the right talent, establishing and evolving key data center and vendor relationships and developing and deploying the required technology as
we move forward with these new capabilities.”
“We’ve also continued to gain market awareness with our Intelligent Network services that are within the Constellation platform, with ongoing momentum showing up in our Ethernet revenue. And we’ve launched several new product
capabilities that enhance and freshen our current portfolio, which reflects the bread and butter of our business, with more production for later this year — “
“As we head into the second quarter, we’re executing on our growth initiatives, optimizing our capital allocation strategy and continuing to differentiate ourselves in the marketplace with capabilities that we believe will change the industry.”
[Ms. Herda turned the call over to Mark Peters- see below for his quotes]
“Let me start first with our product initiatives, including how we’re addressing our customers’ current and future network requirements, as well as some specific progress on this year’s product roadmap. We believe that the reason we keep growing is that we continue to invest, innovate and enhance our value to customers because in this business, you have to do so to remain relevant. We also believe that there is a direct correlation between our innovation and development and the fact that we posted 34 consecutive quarters of sequential revenue growth.”
“Customers are buying from us, both through our track record to serve their current needs and our integrated vision to solve their future business challenges. For instance, who else in the industry has delivered a Dynamic Capacity solution today? No one. And who else is talking about click and connect, reliable and secured network capabilities for dynamic connections between buildings, data centers and other cloud services, which we’re developing through our Constellation platform? No one.”
“Our success is driven by constantly leveraging our core strength. For example, our Dynamic Capacity, Enhanced Management and E-Access, our one-to-many Ethernet service, are all very innovative solutions. But the real power is how they enhance our Ethernet portfolio, which is foundational to our growth engine. Collectively, these products make us more differentiated and competitive, helping us to open more doors and close more deals. For example, let me give you some color on how Dynamic Capacity is driving our Ethernet sales. As a reminder, our Dynamic Capacity solution, which is part of our Intelligent Network services, is delivered via E-Line, our most advanced Ethernet offering. Looking
back over the 9 months from the initial Intelligent Network launch through the first quarter of 2013, E-Line revenue has grown by about 2.5x in that time frame. We believe our Intelligent Network capabilities, including our Dynamic
Capacity solution, greatly complement our E-Line sales and has been a factor in this revenue acceleration. And we have seen the adoption rate between E-Line and Intelligent Network steadily increase in concert with our growth.”
“In addition, this summer, we plan to expand our Dynamic Capacity from our current offering that can flex up to 1 gig to be able to provide customers the ability to flex all the way up to 10 gigs. This has been driven by interest from our large enterprise customers. Again, because of our powerful operating platform, this service will be embedded into our infrastructure scalable and available across our footprint.”
Mark Peters, Chief Financial Officer and Executive Vice President:
“Data and Internet revenue continues to be strong, and now represents 53% of our total revenue and grew 14.3% year-over-year. Data and Internet revenue grew 2.2% sequentially, reflecting the impact of the customer settlement last quarter that did not recur.”
“Modified EBITDA margin was 35.7%, compared to 36.7% in the same period last year and 36.6% in the prior quarter. The strong margin naturally will be impacted by our growth initiatives, and we expect these initiatives will continue to pressure margins in the near term until they are absorbed by higher top line growth. Additionally, we had a $4.1 million sequential cost increase, due primarily to the annual resetting of payroll taxes.”
Robert Powell wrote in a blog post: “The biggest surprise here is m-EBITDA margins of 35.7%, which is the lowest they’ve turned in since the first quarter of 2009. In the fourth quarter they took on an additional 60 headcount (40 in sales), and this quarter they added another 41 (but just 4 in sales). So it’s no secret where the extra expenses are going. They’re planning to roll out further managed services as the year goes on, as well as 40/100G (Carrier Ethernet) offerings and their constellation network platform, in the interests of a potentially higher growth rate down the line.”
“Last fall, the rumors were that tw telecom was about to be gobbled up by CenturyLink. The long term investments for growth and the resulting m-EBITDA margin compression don’t really fit with that thesis, and suggest to me that tw does not really see itself as a consolidation target at this time. But likewise, they don’t seem any more interested in pursuing inorganic growth than they have over the past few years.”
http://www.telecomramblings.com/2013/05/more-long-term-investments-for-tw-telecom-in-q1/
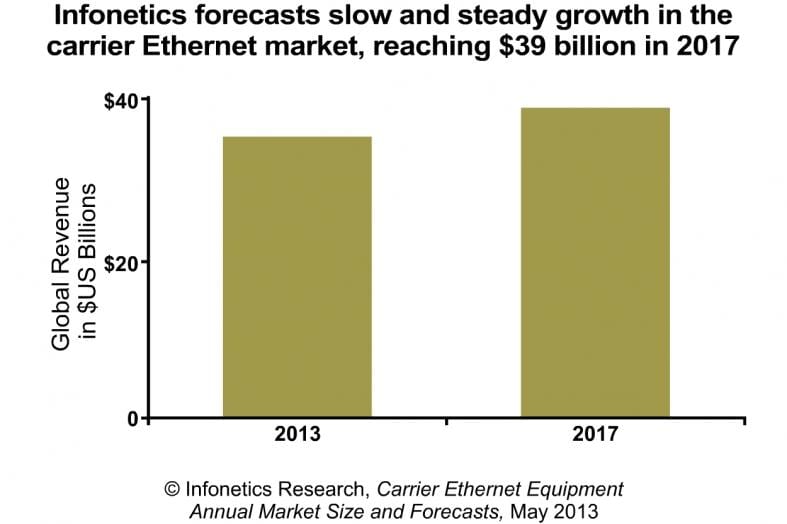
Infonetics: Carrier Ethernet market declined in 2012, but expected to be $39B by 2017
- The global carrier Ethernet equipment market declined 3% to $34 billion in 2012, following a 13% spike in 2011.
- Spending on IP edge routers totaled $9.4 billion in 2012, the most of any carrier Ethernet equipment segment.
- Asia Pacific currently accounts for the greatest portion of carrier Ethernet equipment revenue, followed by EMEA (Europe, the Middle East, and Africa); by 2017, Infonetics expects North America will have passed EMEA to become the 2nd largest carrier Ethernet market
- Infonetics projects Carrier Ethernet equipment ports will top 95 million worldwide by 2017, with 10 Gigabit Ethernet growing fast to pass 1 Gigabit Ethernet
Ethernet Access Devices (EAD) MARKET Report- released April 18, 2013
“People keep saying that copper’s dead, but it’s not—it has a limited but important role for Ethernet services, as evidenced by the continued growth of EFM (Ethernet in the first mile) bonded copper,” notes Michael Howard, principal analyst for carrier networks and co-founder of Infonetics Research. “EFM’s high capacities and reach make it a useful and effective alternative where fiber isn’t justified.”
- For the full year 2012, the global Ethernet access device (EAD) market grew 3.5%, to $860 million, with growth hesitating as a result of economic conditions and a lull in carrier spending in the 2nd half of 2012
- 10/100M copper and 1G fiber dominate EAD ports today, but 10G fiber is growing fast, forecast by Infonetics to grow at a 117% CAGR through 2017
- Though in slow decline, Ethernet over TDM (EoTDM) bonded circuits will remain a niche market, providing an inexpensive way to combine several E1s or T1s
- For the second consecutive year, the top 5 revenue share leaders in the EAD market are (in alphabetical order) Actelis, ADVA, Ciena, Overture, and RAD
EAD REPORT SYNOPSIS
Infonetics’ biannual Ethernet access devices report provides worldwide and regional market size, vendor market share, forecasts through 2017, analysis, and trends for copper and fiber EADs and ports by speed. Companies tracked: Accedian, Actelis, ADTRAN, ADVA, Canoga Perkins, Ciena, FibroLAN, IPITEK, MRV, Omnitron OMS, Overture, RAD, Tellabs, Telco Systems, Zhone, and others.
To buy the report, contact Infonetics: http://www.infonetics.com/contact.asp.
