

Custom AI Silicon: OpenAI, Anthropic, Hyperscalers and the Battle with Nvidia, AMD and Broadcom
Disclaimer: ChatGPT was used extensively to write this article.
Executive Summary:
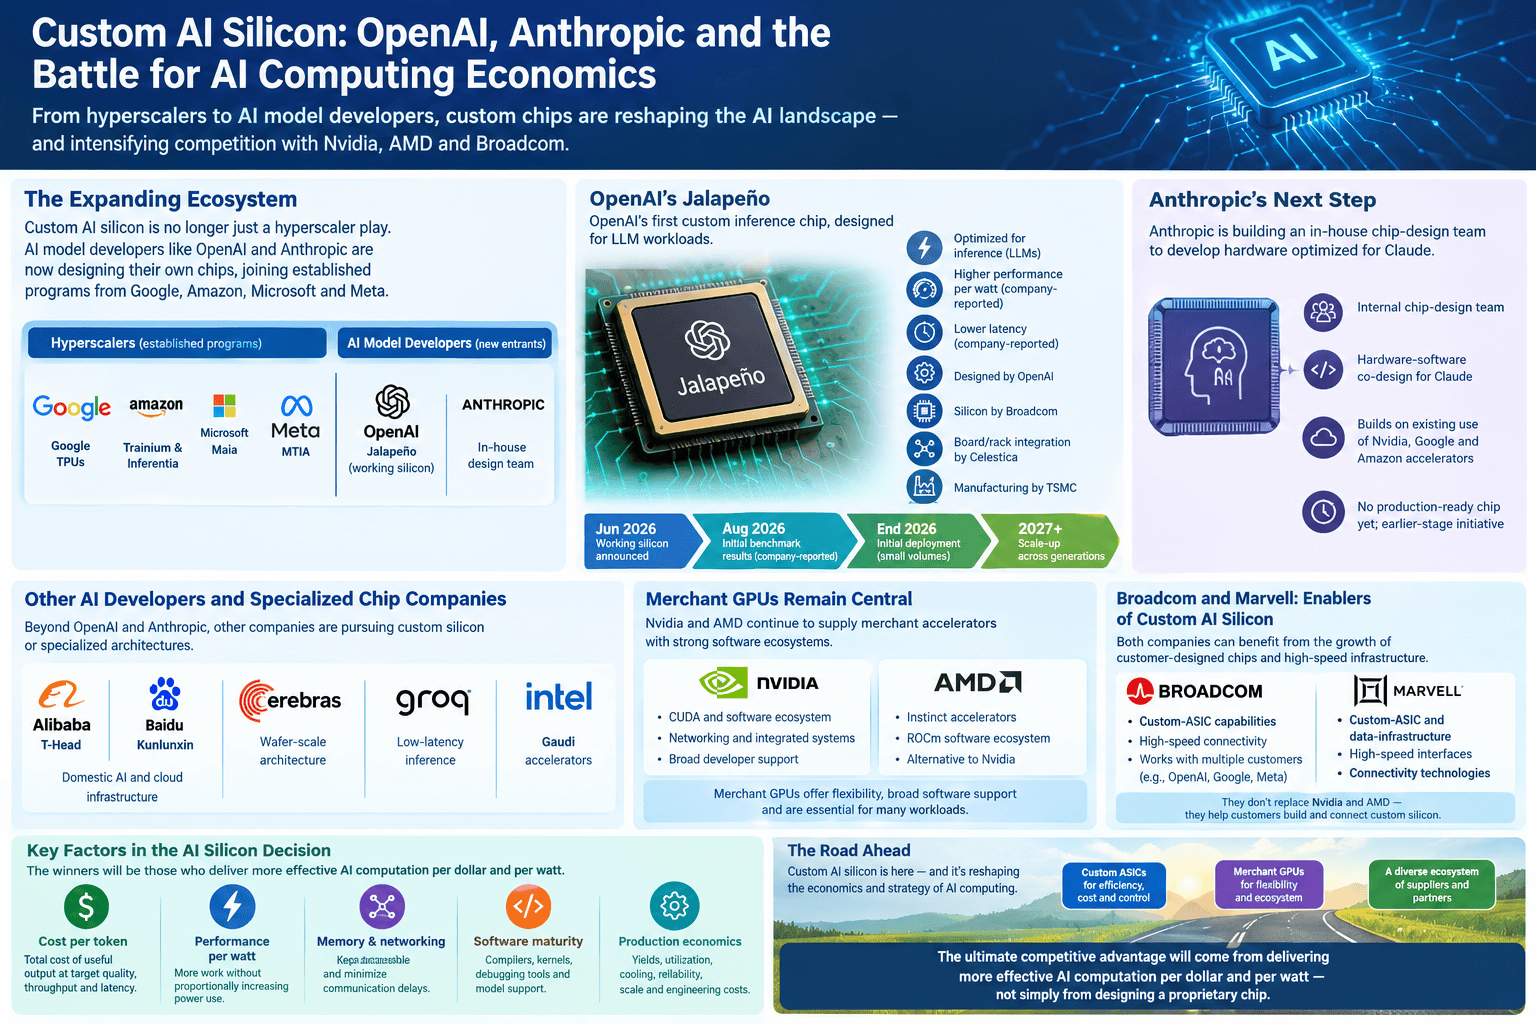
Custom AI silicon is entering a new phase. Google, Amazon, Microsoft and Meta have established proprietary accelerator programs, while OpenAI has introduced its first custom inference chip, Jalapeño, and Anthropic is assembling an in-house chip-design team.
These developments extend the industry trend examined in earlier IEEE Techblog articles, Custom AI Chips: Powering the Next Wave of Intelligent Computing and Google’s TPU Business Outpaces Rivals as Hyperscalers Accelerate Custom AI Silicon Strategies (see References for more).
The important new development is the entry of AI-model developers themselves into chip architecture and design. OpenAI is attempting to optimize hardware around the demands of its models and inference services, while Anthropic plans to pursue closer hardware-software co-design for Claude.
The competitive consequences extend beyond Nvidia and AMD. Broadcom and Marvell stand to benefit from demand for custom application-specific integrated circuits (ASICs), while Intel and specialized accelerator developers pursue alternative architectures.
The central question is whether custom silicon can deliver a sustained advantage in cost per AI token, energy efficiency and latency without sacrificing the flexibility and software ecosystem of merchant GPUs.
OpenAI – From Chip Partnership to Working Silicon:
OpenAI’s October 2025 agreement with Broadcom established a multiyear $10 billion custom-chip program for 10 gigawatts of OpenAI-designed accelerators and associated networking systems. Since then, the project has advanced from a development partnership to working silicon. On June 24, 2026, the companies unveiled Jalapeño, OpenAI’s first custom AI inference accelerator, designed specifically for large language models (LLMs). OpenAI designed the architecture, while Broadcom provides silicon implementation and networking expertise, and Celestica supports board and rack integration. TSMC will manufacture the chips. Engineering samples are running machine-learning workloads in the laboratory at targeted operating frequency and power. Initial deployment is planned for the end of 2026, followed by expansion over multiple generations.
In August 2026, OpenAI published initial benchmark results claiming substantial performance-per-watt and latency advantages over competing systems. These are company-reported results, not yet independent proof of a sustained production-scale advantage over Nvidia’s latest accelerators. Jalapeño is optimized for inference rather than general-purpose AI training, and OpenAI’s immediate priority is to meet its own rapidly growing computing demand.
The strategic significance is that OpenAI is extending its capabilities beyond AI models and software into custom hardware. By co-designing the chip, software kernels, memory movement, networking and serving systems, it aims to lower inference costs and improve responsiveness across ChatGPT, Codex and its API services. For Broadcom, the partnership reinforces the opportunity to supply custom silicon and networking technology to major AI developers without having to compete directly with Nvidia across the entire GPU market.
The distinction is significant: this is no longer simply a plan to develop proprietary silicon. OpenAI reported that engineering samples were running machine-learning workloads in its laboratories at production-target frequency and power.
Jalapeño is designed around large language model (LLM) inference rather than adapting a general-purpose GPU architecture. Its design emphasizes minimizing data movement and balancing compute, memory and networking resources. These considerations become increasingly important when serving interactive AI applications and agents that must generate responses quickly and execute multiple steps.
OpenAI designed the architecture, while Broadcom contributes silicon implementation and networking technology, and Celestica supports board and rack integration. OpenAI plans an initial deployment in small volumes near the end of 2026, with more substantial deployment expected in 2027.
The business rationale is straightforward. OpenAI operates ChatGPT, Codex and its API services at considerable computing scale. Even relatively modest improvements in inference efficiency could translate into meaningful savings if deployed across a large installed base.
However, Jalapeño’s initial benchmarks do not establish that it will outperform Nvidia’s latest systems across all workloads. Nor do they yet demonstrate its production-scale cost advantage. The relevant comparison must include complete systems, utilization, software development, power, cooling and operating costs.
The critical test is whether Jalapeño can deliver better economics at production scale. OpenAI must demonstrate that its claimed efficiency gains translate into lower total costs per AI token after accounting for manufacturing, memory, networking, power, cooling, utilization and software engineering. The initial results are promising, but the competitive outcome remains to be established.
Sources: OpenAI’s Jalapeño announcement and August benchmark results.
Author’s Note: The claims about Jalapeño’s performance are explicitly attributed to OpenAI.
……………………………………………………………………………………………………………………………………………
Anthropic – Building an Internal Design Capability:
Anthropic announced in August 2026 that it was forming an internal chip-design team to develop hardware optimized for Claude. The initiative reflects the same strategic logic as OpenAI’s: understanding a model’s architecture, inference patterns and software stack can help guide the design of more efficient processors.
Anthropic is not starting from a position of hardware independence. It already uses accelerators from Nvidia, Google and Amazon, among others. Its planned custom-silicon effort is an additional element of a multivendor strategy, not evidence that it is abandoning external suppliers.
The distinction between the two AI developers is important. OpenAI has demonstrated working silicon and published initial benchmarks; Anthropic is building a design organization and has not announced a production-ready proprietary accelerator or deployment timetable.
Designing advanced chips also requires substantial capital, specialized engineering talent and access to manufacturing and packaging capacity. Anthropic must ultimately demonstrate that the benefits justify those investments.
Source: Reuters on Anthropic’s chip-design team.
……………………………………………………………………………………………………………………………………………………..
Hyperscalers: Established Programs, Different Economics:
The major hyperscalers have already developed proprietary accelerators, as discussed in our September article. Their competitive positions differ according to the maturity of their hardware programs, their internal workloads and their ability to sell or rent computing capacity to external customers.
| Company | Custom silicon | Strategic emphasis |
|---|---|---|
| Tensor Processing Units (TPUs) | Training and inference, including external cloud customers | |
| Amazon | Trainium and Inferentia | AWS computing economics and customer choice |
| Microsoft | Maia | Azure AI inference and internal services |
| Meta | MTIA | Recommendation systems and generative AI inference |
| OpenAI | Jalapeño | LLM inference optimized around its models and serving software |
| Anthropic | In-house design initiative | Future hardware-software co-design for Claude |
Google’s position is particularly notable because it has an established TPU ecosystem and sells access to its accelerators beyond its own operations. Amazon similarly offers Trainium through AWS, giving customers an alternative to Nvidia-based infrastructure.
Microsoft and Meta are expanding their own programs, although proprietary silicon does not eliminate their need for merchant GPUs. Different workloads, development schedules and capacity requirements favor a mix of processors.
The broader point is that these companies are not necessarily trying to replace Nvidia everywhere. They are attempting to optimize selected workloads, diversify supply and improve the economics of operating AI infrastructure.
……………………………………………………………………………………………………………………………………………….
Other AI Developers and Specialized Chip Companies:
The custom-silicon movement extends beyond OpenAI and Anthropic, but announced interest should not be confused with established production programs.
Alibaba’s T-Head and Baidu’s Kunlunxin are examples of Chinese semiconductor-development efforts associated with domestic AI and cloud infrastructure. Their importance includes reducing reliance on foreign suppliers amid restrictions on advanced semiconductor exports.
Among smaller AI-model developers, the strategic choices vary. A company can optimize models, compilers and kernels for existing processors without designing a chip of its own. Developing proprietary silicon becomes more attractive when workloads are large and predictable enough to justify substantial upfront investment.
Specialist chip companies pursue different alternatives to conventional GPUs:
- Cerebras uses a wafer-scale architecture designed to place substantial computing resources on a single silicon wafer.
- Groq developed a specialized architecture targeting low-latency inference and has entered a broader ecosystem that includes partnerships and technology integration.
- Intel offers its Gaudi accelerator family as an alternative AI-computing platform.
These vendors compete through different combinations of architecture, software, throughput, latency and system economics. They should not be treated as interchangeable with hyperscaler ASICs or general-purpose merchant GPUs.
……………………………………………………………………………………………………………………………………………..
Image from ChatGPT:
…………………………………………………………………………………………………………………………………………………………………………
Merchant Market AI Accelerator Chips from Nvidia and AMD :
Nvidia’s competitive advantage extends well beyond its GPU hardware. CUDA, optimized libraries, developer tools, networking and integrated rack-scale systems make its platform difficult to displace. Customers also benefit from a broad software ecosystem and the ability to use the same general platform across many workloads.
Nvidia’s vulnerability is that large AI operators have incentives to reduce costs and dependence on a single supplier. Custom ASICs can be attractive when workloads are sufficiently stable and deployment volumes justify specialized engineering.
AMD provides a second major merchant-GPU platform through its Instinct accelerators and ROCm software ecosystem. It offers customers another source of advanced computing capacity and an alternative to Nvidia’s platform.
AMD faces the challenge of expanding software adoption and competing against Nvidia’s established ecosystem. Nevertheless, the availability of multiple accelerator suppliers is strategically valuable to cloud providers and AI developers.
Neither company is likely to be displaced solely because a few major customers introduce proprietary chips. Merchant GPUs remain useful for new models, changing workloads and applications for which custom silicon is not yet economically justified.
Broadcom and Marvell – Beneficiaries of the Custom-ASIC Trend:
Broadcom occupies a particularly important position because it can benefit from the growth of customer-designed silicon without relying exclusively on sales of a proprietary general-purpose AI accelerator.
Its custom-ASIC capabilities, high-speed connectivity and networking products support the development of customer-specific AI systems. Its work with OpenAI and Meta illustrates how chip designers can retain control of their architectures while relying on semiconductor partners for implementation and infrastructure.
Marvell offers another set of custom-ASIC and data-infrastructure capabilities, including high-speed interfaces and connectivity technologies. It can benefit as companies develop specialized processors and build the systems needed to connect them.
The distinction from Nvidia and AMD is fundamental:
- Nvidia and AMD sell merchant accelerators to a broad customer base.
- Broadcom and Marvell help customers develop customized silicon and the associated data infrastructure.
- Hyperscalers and AI developers use their knowledge of workloads to decide where proprietary hardware can improve performance or economics.
These roles can overlap. Broadcom’s custom-chip business, for example, can benefit from a customer moving some workloads away from merchant GPUs. But custom silicon does not eliminate the need for advanced manufacturing, memory, packaging, networking or other semiconductor suppliers.
…………………………………………………………………………………………………………………………………………
What Will Determine the Winners?
The decisive metric is not peak computing performance alone. AI operators need to know how much useful work a complete system can deliver at an acceptable cost and latency.
Five factors will be especially important:
- Cost per token: Total cost of generating useful AI output at specified quality, throughput and response time.
- Performance per watt: The ability to serve more workloads without proportionally increasing electricity consumption.
- Memory and networking: The ability to keep model data accessible and minimize communication delays.
- Software maturity: The availability of compilers, optimized kernels, debugging tools and support for changing models.
- Production economics: Manufacturing yields, system utilization, cooling, reliability, deployment scale and engineering costs.
Custom ASICs are most compelling when a company has large, repeatable workloads and can optimize the model, software and hardware together. Merchant GPUs remain attractive when flexibility, rapid deployment and broad software support outweigh the potential benefits of specialization.
Power availability is an additional constraint. A more efficient processor can increase the useful computing capacity delivered by a given data-center power budget, although total electricity consumption may still rise as AI demand expands.
………………………………………………………………………………………………………………………………………
Conclusions:
Custom AI silicon is becoming a more important part of the industry’s computing strategy. The entry of OpenAI and Anthropic into chip design extends a trend already established by Google, Amazon, Microsoft and Meta.
OpenAI’s Jalapeño is a meaningful milestone because it has progressed from a partnership announcement to working silicon and published initial performance results. Anthropic’s initiative remains at an earlier stage. Both illustrate the growing interest in co-designing AI models, software and hardware.
The market is likely to remain heterogeneous. Nvidia and AMD will continue supplying merchant accelerators, while Broadcom and Marvell can benefit from demand for customer-specific silicon and high-speed networking. Specialized architectures will compete for workloads where their performance and cost advantages are compelling.
The ultimate competitive advantage will come from delivering more effective AI computation per dollar and per watt—not simply from designing a proprietary chip.
……………………………………………………………………………………………………………………………………
References:
Google’s TPU Business Outpaces Rivals as Hyperscalers Accelerate Custom AI Silicon Strategies
Custom AI Chips: Powering the next wave of Intelligent Computing
OpenAI and Broadcom in $10B deal to make custom AI chips
Meta’s “Iris” AI Chip for MTIA: Implications for Telecom-Grade Optical Networking, DCI and High Capacity Ethernet Fabrics
2026 OCP Summit: Full-Stack AI Networking Silicon from Nvidia/Cisco and Broadcom; Ethernet vs InfiniBand Interconnects
The AI Infrastructure Build-Out: A $10 Trillion Bet on Compute, Power, and Networks
Will Google Cloud’s AI and data analytics revenue +TPU IP licensing income offset huge AI CAPEX to produce a decent ROI?
Dell’Oro: Private Wireless Revenue Growth Prospects and Challenges
Executive Summary:
Dell’Oro Group just published its 2Q26 Private Wireless Report [1.]. The latest findings support the premise that the momentum is slowing, particularly in the enterprise campus segment, prompting another downward revision to their forecast.
Note 1. Dell’Oro Group explicitly measures Private Wireless RAN revenue. I believe they are referring ONLY to the cellular RAN equipment market, rather than a Wi-Fi LAN or conventional WAN market. However, private cellular deployments may coexist with Wi-Fi, and the RAN revenue measure should not be presented as total private-network spending.
“Private wireless continues to grow, but the market is developing more slowly than initially anticipated,” said Stefan Pongratz, Vice President at the Dell’Oro Group. “The divergence between campus and wide-area deployments is becoming more pronounced. While enterprise adoption remains gradual, demand for larger and more demanding wide-area networks is providing an important source of growth. We remain optimistic about the broader long-term private 5G/6G opportunity, though the adoption curve is clearly more gradual than initially expected.”
Private Wireless RAN revenue increased at a mid-single-digit rate in 1H26, down from the double-digit growth recorded in 2025. The slowdown is more pronounced in the Campus Network segment. Meanwhile, Wide-Area private wireless grew at a double-digit rate, reflecting stronger momentum in larger, mission-critical networks.
Supplier concentration remains high. Huawei continues to lead globally, while Nokia and Ericsson dominate outside China. The top five suppliers accounted for approximately 95% of Private Wireless RAN revenue in the first half of 2026. Despite slowing growth and downward forecast revisions, private wireless remains one of the stronger growth opportunities within the broader RAN market, which is expected to remain relatively flat. Private Wireless RAN revenue is projected to grow at a 10 to 13 percent CAGR over the next five years [2.].
Note 2. The 10–13% CAGR is a forecast, not an observed growth rate. The reported mid-single-digit growth in 1H2026 indicates near-term deceleration, while the latest forecast revision signals that the adoption trajectory remains less favorable than previously expected.

Dell’Oro’s message has not changed. Private wireless remains a largely untapped growth opportunity, but broader adoption is proving slower and more challenging than expected. The opportunity is increasingly shifting toward larger, wide-area and mission-critical deployments, while the enterprise campus segment continues to face headwinds. Private wireless network revenues are expected to account for 5 to 10% of total RAN revenues by 2030.
Analysis- Private Cellular Growth Prospects and Adoption Barriers:
Dell’Oro’s findings highlight an important distinction between the growth of private cellular RAN equipment revenue and the broader adoption of private wireless networking. The projected 10–13% CAGR over five years is attractive relative to a largely flat overall RAN market, but it starts from a comparatively small revenue base and follows another downward forecast revision. A double-digit growth rate therefore does not, by itself, establish that private wireless will become a major RAN revenue contributor.
Several factors help explain the slower-than-expected enterprise campus adoption. Private LTE/5G networks must compete with mature, less expensive Wi-Fi solutions that already meet many enterprise connectivity requirements. Additional obstacles include deployment and integration costs, spectrum availability, a limited ecosystem of compatible industrial devices, and the expertise required to operate cellular networks. Private 5G is most compelling where coverage, mobility, reliability, security, or predictable performance justify the additional investment.
The relative strength of wide-area deployments is consistent with the requirements of utilities, transportation systems, public safety, ports, mines, and other geographically extensive or mission-critical operations. These applications can justify dedicated cellular infrastructure where conventional Wi-Fi is impractical or insufficient.
The key question is whether private cellular can move beyond specialized industrial and mission-critical applications into repeatable, economically attractive enterprise deployments. Simpler turnkey solutions, lower total cost of ownership, and stronger integration with existing IT and operational technology networks will be important to expanding the addressable market. For RAN suppliers, private wireless represents a credible growth opportunity, but its commercial scale and timing remain uncertain.
References:
Private Wireless RAN Growth Slows to Mid-Single Digits in 1H26, According to Dell’Oro Group
Private 5G’s Business Model Shifts: Ericsson’s Move Signals a Market Reset
Nokia’s ECE Divestiture: Impact on Private 5G Market & Disaggregation
Dell’Oro: 6G RAN Capex to reach $500 billion by 2034 + Counterpoint
SNS Telecom & IT: Private 5G for the Defense Sector to hit $2.5 Billion by 2029
5G infrastructure moves from coverage and speeds to cloud-native, orchestration, automation and AI-assisted networks
SNS Telecom & IT: Private 5G Market to Reach $6.6 Billion as Physical AI Takes Hold
GSA: Global private mobile networks exceed 2,000 worldwide; Ericsson Private 5G from Verizon Business extends beyond U.S.
SNS Telecom & IT: Mission-Critical Networks a $9.2 Billion Market
Dell’Oro: Fixed Wireless Access revenues +10% in 2025 & will continue to grow 10% annually through 2029
Dell’Oro: RAN revenue growth in 1Q2025; AI RAN is a conundrum
Dell’Oro: Global RAN Market to Drop 21% between 2021 and 2029
Ericsson leads SK Telecom AI RAN vs. NVIDIA’s GPU centric AI RAN Alliance
AT&T/Ericsson Demonstrate 5G-Based ISAC for Drone Detection at World Cup Stadium
AI-RAN and Agentic AI get real: Ericsson, Nokia, Verizon & other operators enter into a new network automation era
Analysis: Ericsson’s leading role in French INTENTION 6G project
Ericsson’s June 2026 Mobility Report Highlights + AI impact on network traffic
AI Power Grid Crisis Triggers $30 Billion “Fuel-Cell Boom” for Data Centers
Introduction:
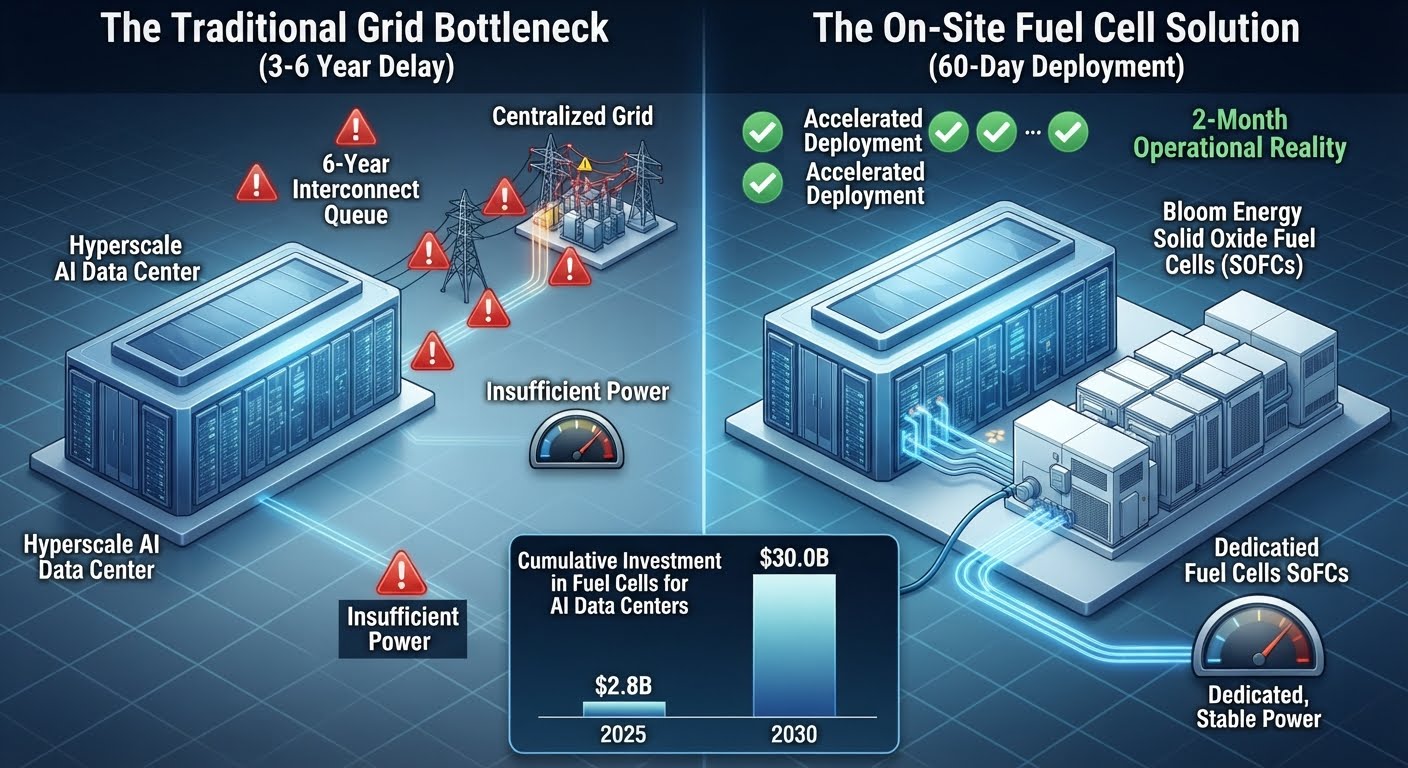
The compounding power demands of generative AI clusters have outpaced the capacity of traditional electrical infrastructure, sparking an immediate energy availability crisis for hyperscale data centers. As connection times for high-density compute facilities stretch toward a half-decade, operators are abandoning the conventional model of total utility grid reliance. This infrastructure bottleneck has catalyzed a major architectural pivot toward localized, decentralized microgrids. By deploying on-site solid oxide fuel cells (SOFCs) as primary baseload power sources, AI infrastructure engineers are effectively decoupling data center deployment schedules from utility interconnect pipelines.
- Oracle (Utah): Bypassed standard grid delays by deploying an on-site fuel-cell configuration to supply dedicated power directly to its local data center facility.
- Nebius (New Jersey): Brought a high-density AI compute site online with fully operational on-site power in less than two months.
- Fuel Infrastructure Dependence: Most current SOFC deployments rely on a continuous supply of natural gas via existing pipeline networks.
- Carbon Footprint Realities: While fuel cells eliminate local particulate emissions and are more efficient than traditional combustion turbines, utilizing natural gas still generates carbon dioxide (\(CO_{2}\)).
- The Hydrogen Transition: To achieve true net-zero operations, hyperscalers must eventually transition these fuel cells to run on green hydrogen. This pivot will require a massive buildout of hydrogen production, transport, and storage infrastructure that does not exist today.
Conclusions:
Fuel cells are becoming a significant option for developers facing lengthy grid-connection schedules. Their principal attraction is the possibility of obtaining continuous on-site power sooner than a conventional utility connection would permit. However, an individual deployment completed in less than two months does not establish a universal sixty-day time-to-power benchmark. The strategic trade-off is a shift in infrastructure dependencies—not their disappearance.
Data-center developers must weigh potential scheduling advantages against gas availability, permitting, electrical equipment, manufacturing capacity, supplier concentration, and emissions obligations. Rystad’s $30 billion forecast indicates the scale of the opportunity, while its supply-chain findings show why that opportunity should not be mistaken for assured deployment.
The explosive rise of the on-site fuel-cell market highlights a fundamental reality: the timeline for training next-generation foundational AI models cannot wait for the multi-year upgrade cycles of traditional regulated utilities. Compressing power provisioning timelines from five years down to sixty days provides a significant competitive advantage that justifies the initial capital premium of microgrid deployment. Over the long term, however, this strategy will face strict architectural and regulatory scrutiny.
If hyperscalers are to fulfill their corporate net-zero mandates, this massive fuel-cell infrastructure must eventually transition from natural gas to green hydrogen. Until that clean fuel supply chain reaches commercial scale, the AI industry’s rush for power will rely on a pragmatic compromise—trading immediate grid independence for an ongoing reliance on fossil-fuel gas networks. …………………………………………………………………………………………………………………………………………………………….
References:
MViSTA Subsea Cable Project to Select NEC or ASN; Vietnam AI Data-Center Planned
Executive Summary:
Reuters reported on October 22, 2026 that developers of the planned Malaysia–Vietnam–Singapore–Thailand subsea cable system will choose between NEC and Alcatel Submarine Networks (a private company) later this month. The proposed 2,500-km, 16-fibre-pair system targets service in late 2028. Its significance lies in additional regional connectivity, Vietnam’s international-route resilience, and the geopolitical considerations shaping its routing and supplier selection.
Meta’s Petal Subsea Cable to Bring Petabit-Class Optics to the Atlantic
Hyperscalers Dominance of Subsea Cable Capacity to Increase in the AI Era
Fiber Optic Networks & Subsea Cable Systems as the foundation for AI and Cloud services
Subsea cable systems: the new high-capacity, high-resilience backbone of the AI-driven global network
Google Cloud announces TalayLink subsea cable and new connectivity hubs in Thailand and Australia
FCC updates subsea cable regulations; repeals 98 “outdated” broadcast rules and regulations
TechCrunch: Meta to build $10 billion Subsea Cable to manage its global data traffic
Deep Dive – AT&T Fiber vs. Verizon Fios: Fiber Deployments, Footprints and Convergence Strategies
Disclaimer: This article was written by Perplexity.ai in response to a query from Alan J Weissberger who edited the piece. The companion article is here:
AT&T’s Fiber Expansion Strengthens Its Converged Wireless and Home Broadband Strategy
Introduction:
- AT&T reported the large fiber-reach of 39M locations and an aggressive fiber expansion program.
- Verizon’s acquisition of Frontier substantially broadens its fiber platform.
- However, a current, apples-to-apples deployment-cost ranking is unavailable: the verified disclosures do not establish comparable 2026 construction costs per home passed. Historical cost estimates should not be presented as current operating metrics.
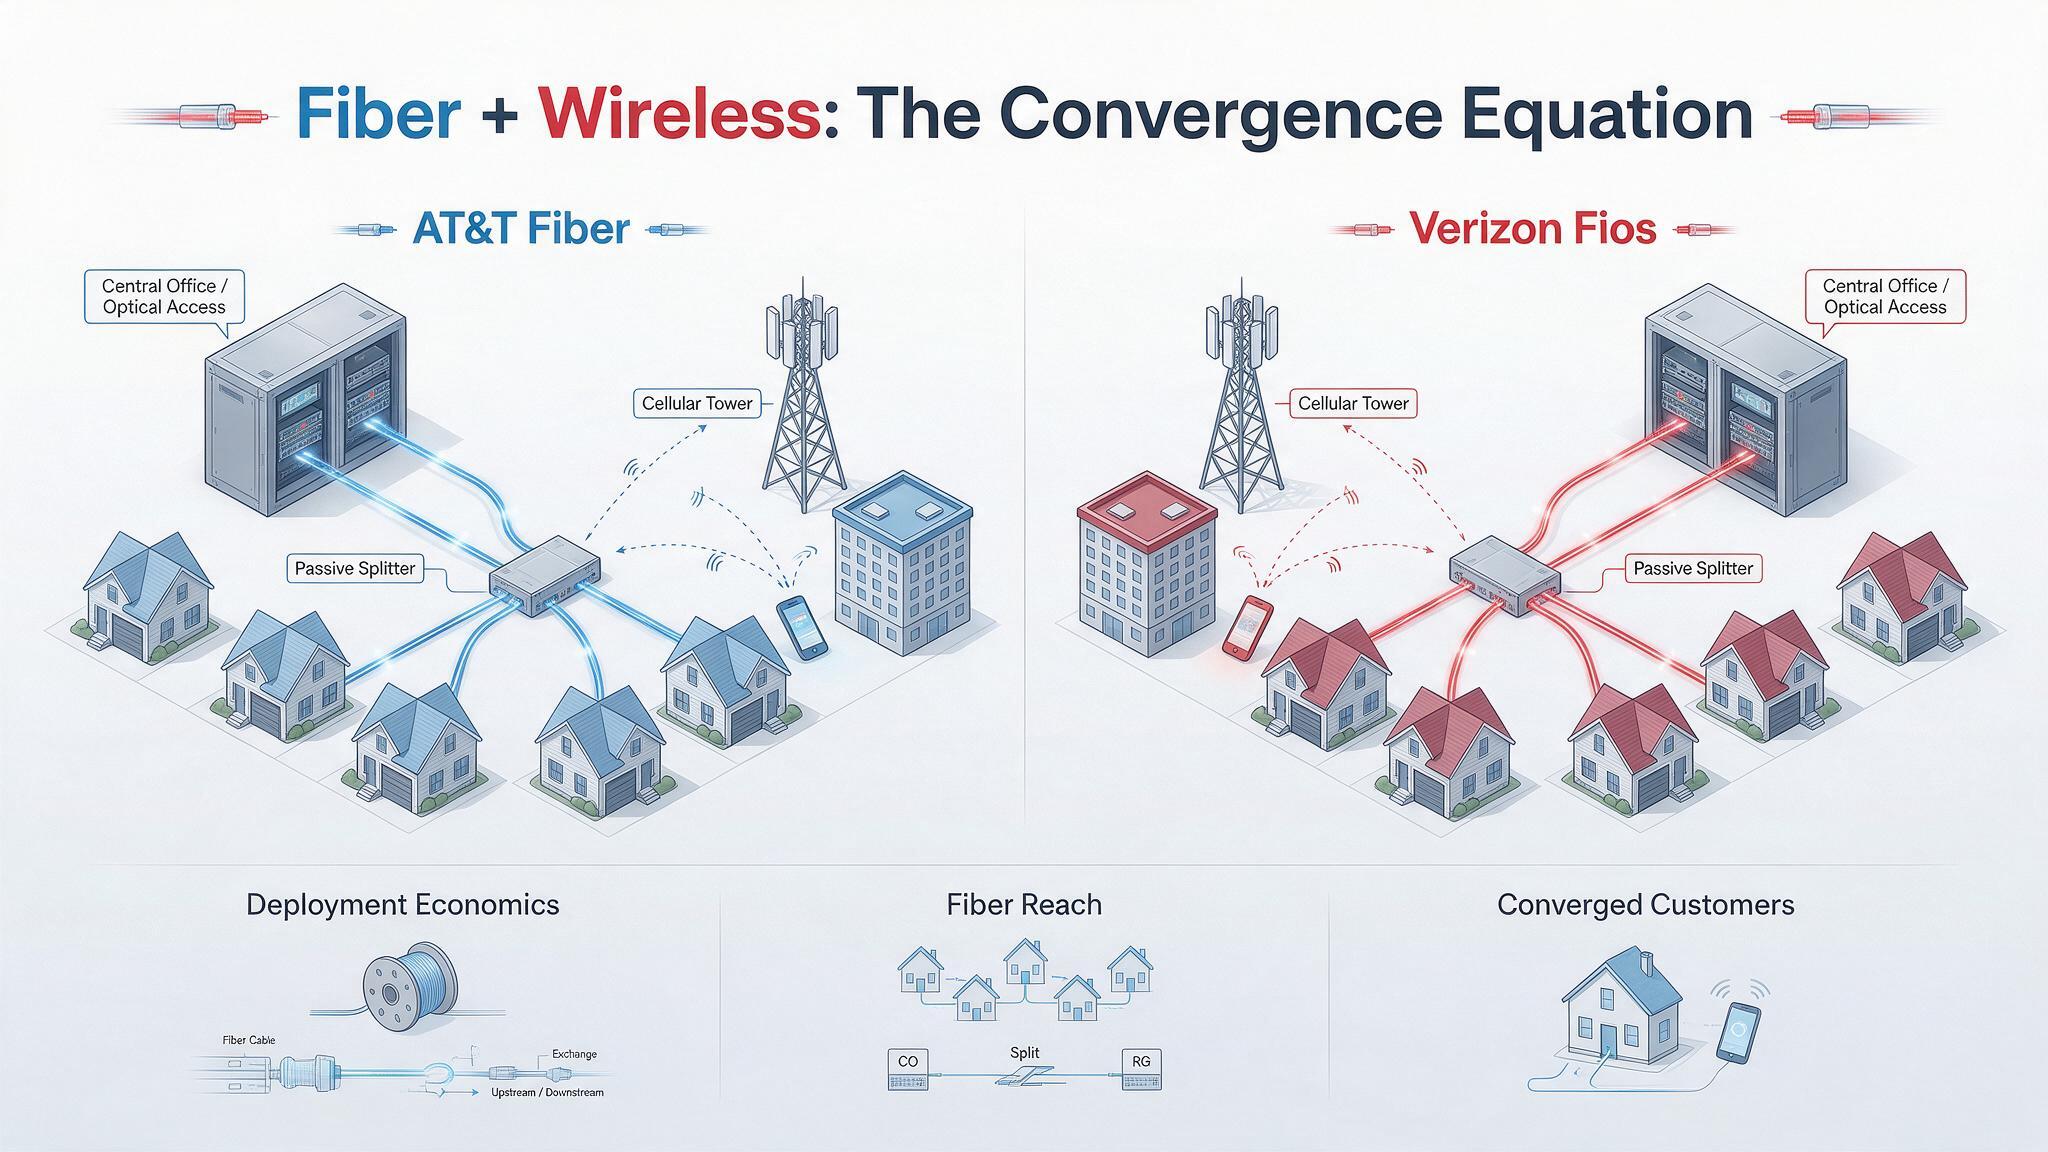
Deployment Economics and Fiber Reach:
Reporting basis: AT&T third-quarter 2026 results; Verizon second-quarter 2026 disclosures and acquisition announcements. The periods and fiber footprint definitions differ.
| Metric | AT&T Fiber | Verizon Fios / expanded Verizon fiber platform |
|---|---|---|
| Reported fiber reach | More than 39 million consumer and business locations at September 30, 2026. | The Frontier transaction brought the combined footprint to approximately 30 million homes and businesses; this is an acquisition-era figure, not a verified Q3 closing balance. |
| Year-end 2026 target | More than 40 million locations. | More than 32 million fiber passings, reiterated on the Q2 earnings call. |
| Longer-term expansion | More than 60 million locations by the end of 2030. | No directly comparable long-term target established in the sources verified for this dashboard. |
| Footprint boundary | Includes owned-and-operated fiber and reach through Fiber Ventures arrangements; not exclusively AT&T-owned construction. | Combined Verizon footprint includes acquired Frontier territory. It should not be labeled “Fios-only” reach. |
| Current construction cost per home passed | No comparable 2026 dollar figure verified. Management reported approximately 2% annual increases in average deployment cost per passing over the preceding two years. | No comparable 2026 Fios-specific dollar figure verified. |
| Historical cost reference—not a current estimate | In February 2023, management commentary placed deployment costs near a $900–$1,000-per-passing ceiling. The reported figure does not provide enough accounting detail for a clean cross-operator comparison. | Frontier—not legacy Fios—expected costs toward the upper end of a $900–$1,000-per-passing range in 2023. This cannot be substituted for Verizon’s current blended build cost. |
| Capital-efficiency signal | AT&T expects annual capital investment in 2027–2028 to be approximately $1 billion below its previous plan while maintaining its fiber-reach objective. This is a companywide investment outlook, not a disclosed fiber unit-cost reduction. | Management emphasizes operating- and capital-expenditure efficiency alongside Frontier integration, but the verified disclosures do not isolate comparable savings per new fiber passing. |
Fixed-Mobile Convergence:
| Metric | AT&T | Verizon |
|---|---|---|
| Reported convergence penetration | 42.8% of advanced home internet connections also had an AT&T consumer postpaid wireless account at Q3-end. This includes fiber and Internet Air, rather than fiber alone. | A directly comparable penetration percentage was not established in the verified disclosures. |
| Incremental converged relationships | Approximately 350,000 added during Q3 2026. | No directly comparable quarterly relationship-addition figure established here. |
| Commercial execution | Uses fiber and fixed wireless broadband to anchor multiproduct relationships and cross-sell mobile service. | Verizon One combines mobility and broadband with one bill and integrated servicing; its broadband component can be fiber or FWA. |
| Evidence on retention | Management identifies convergence as a customer-lifetime-value strategy. The verified Q3 material does not establish a controlled, like-for-like churn reduction attributable solely to bundling. | In September 2024, a Verizon executive reported approximately 50% lower mobile churn and 40% lower broadband churn among bundled Fios/wireless customers. These are historical management claims, not current 2026 measurements. |
| Principal execution issue | Increase penetration and multiproduct adoption while introductory pricing and bundle discounts pressure standalone fiber ARPU. | Convert the enlarged Frontier footprint into mobile/broadband relationships while integrating customer servicing and go-to-market operations. |
A convergence percentage measures customer overlap, not network integration. Neither a bundled bill nor a household taking both services demonstrates a unified fixed-mobile core architecture. AT&T’s reported metric explicitly counts qualifying customer relationships; Verizon’s unified offering likewise spans commercial packaging and servicing.
Access-Network Technology:
The most useful engineering comparison is the optical access architecture—not simply the highest advertised retail speed.
| Technical dimension | AT&T Fiber | Legacy Verizon Fios |
|---|---|---|
| Established multi-gigabit upgrade approach | XGS-PON, alongside its existing GPON base. | NG-PON2 overlay on existing GPON infrastructure in upgraded markets. This should not be generalized to the acquired Frontier network. |
| PON capacity | XGS-PON provides nominal 10 Gbit/s symmetric line capacity on a wavelength pair. | The cited NG-PON2 implementation supports four 10 Gbit/s wavelength channels, providing 40 Gbit/s aggregate capacity. |
| Architecture tradeoff | Lower-cost fixed-wavelength optics and a widely adopted upgrade approach. | Higher initial optical-system cost, offset by wavelength flexibility, potential channel bonding, and service separation. |
| Shared-infrastructure opportunity | Higher-capacity PON supports multi-gigabit access without rebuilding the entire passive fiber plant. | Verizon has described using NG-PON2 to support residential, enterprise, and wireless transport services on a common optical distribution network. |
| Important capacity caveat | PON line rate is shared access capacity—not a dedicated 10 Gbit/s allocation to every household. | The 40 Gbit/s figure is aggregate multiwavelength system capacity—not a standard 40 Gbit/s residential service. |
How to Interpret Deployment Cost Correctly:
A defensible cost dashboard must separate three different denominators:
-
Cost per passing: construction expenditure divided by newly serviceable locations.
-
Cost per connected customer: attributable construction expenditure divided by activated customers, plus any separately excluded connection costs.
-
Acquisition cost per passing: transaction value divided by acquired locations—a valuation measure, not a construction-cost measure.
The historical AT&T cost discussion illustrates the problem: the published figure did not clearly establish whether drops, customer electronics, installation labor, splitters, and other equipment were included. Without consistent cost boundaries, a seemingly precise AT&T–Verizon unit-cost comparison would be misleading.
An illustrative calculation—not either operator’s reported economics—shows why penetration matters:
References:
Network X Americas: AT&T and Comcast reveal huge AI impact on network operations
Analysis: AT&T 1Q-2026 results: increased fiber penetration, FWA momentum, D2D deals, and mobile/home internet bundles
AT&T grows fiber revenue 19%, 261K net fiber adds and 29.5M locations passed by its fiber optic network
AT&T sets 1.6 Tbps long distance speed record on its white box based fiber optic network
Lumen launches Multi-Cloud Gateway (MCGW) and expands metro fiber network after selling consumer FTTH business to AT&T
AT&T’s Fiber Expansion Strengthens Its Converged Wireless and Home Broadband Strategy
Introduction:
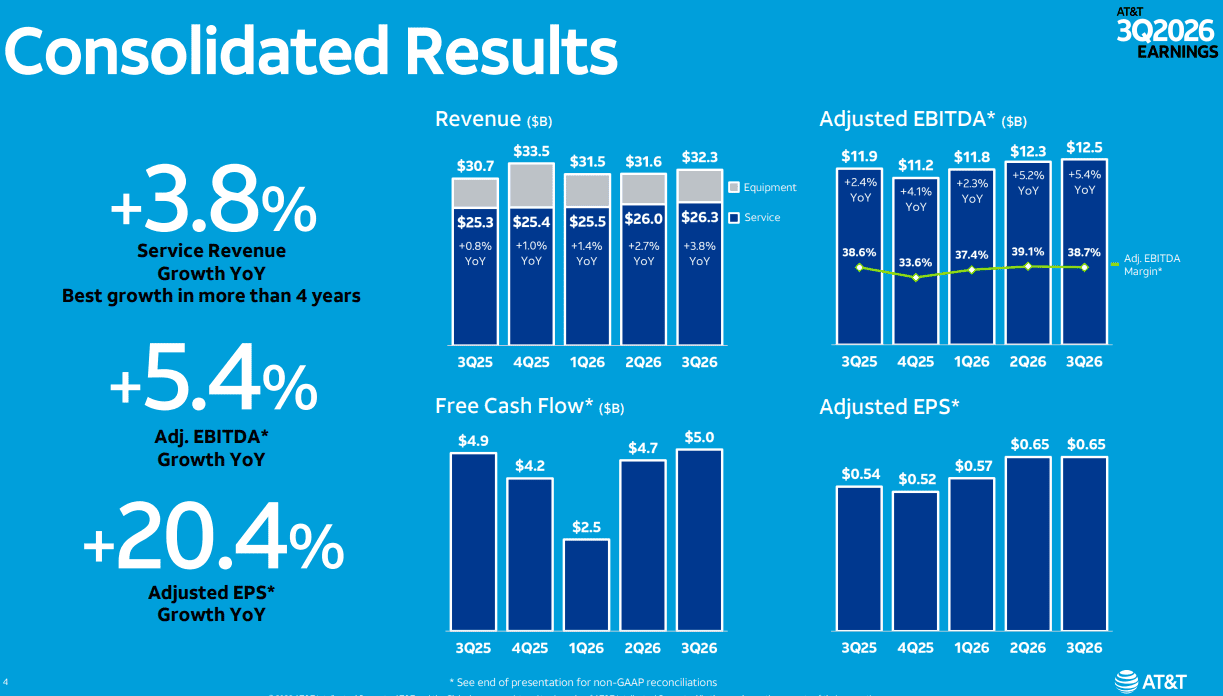
Revenue at AT&T rose 5.3% annually in the 3rd quarter 2026to $32.3 billion, beating estimates among analysts surveyed by FactSet of $31.69 billion. Adjusted earnings per share of 65 cents topped analysts’ forecasts of 60 cents a share. The company sees adjusted earnings in the $2.40 a share range for 2026, ahead of the $2.25 to $2.35 range it guided in July.
AT&T’s third-quarter results show its convergence strategy gaining scale: expanding fiber availability, adding broadband subscribers, and converting more households into customers for both home internet and mobile service. On its October 21 earnings call, the company reported approximately 350,000 additional converged customer relationships. At quarter-end, 42.8% of its advanced home internet connections also had an AT&T consumer postpaid wireless account.
AT&T recorded 1.148 million net additions across fiber, fixed wireless access (FWA), and postpaid cellular phone subscribers—the second consecutive quarter above 1 million. That total comprised 442,000 consumer and business fiber connections, 327,000 fixed wireless connections, and 379,000 postpaid phone subscriptions. These are service net additions, not necessarily distinct customers or households. AT&T added 379,000 postpaid phone subscribers in the quarter vs. 432,000 postpaid adds in the 2nd quarter.
For telecommunications engineers and network planners, the results highlight three interdependent priorities: 1.] extending the fiber footprint, 2.] improving returns through multiproduct customer relationships, and 3.] eliminating the cost of maintaining parallel legacy copper infrastructure.
Fiber Buildout Expands Reach While Deployment Efficiency Improves:
AT&T reached more than 39 million consumer and business locations with fiber at the end of the third quarter. It remains on track to exceed 40 million by year-end 2026 and 60 million by the end of 2030, while reducing its planned annual capital investment for 2027 and 2028. CFO Pascal Desroches attributed the improvement to greater efficiency in planning, construction, installation, and deployment scheduling.
“We believe this positions us to reach 60 million+ locations with fiber by the end of the decade, with annual capital investment that is roughly $1 billion lower than we previously planned.”
— Pascal Desroches, Chief Financial Officer
The revised outlook calls for annual capital investment of $22 billion to $23 billion in 2027 and 2028, compared with $23 billion to $24 billion in 2026. AT&T’s capital-investment measure includes both capital expenditures and cash payments for vendor financing; it should not be treated as synonymous with reported capital expenditures.
The footprint also requires careful interpretation. AT&T’s “locations reached” metric includes its owned-and-operated fiber network and locations available through its Fiber Ventures category, including the acquired Lumen footprint, Gigapower, and other commercial open-access providers. It measures service availability—not connected subscribers or exclusively AT&T-owned construction.
To support further expansion, AT&T announced an agreement with Global Infrastructure Partners and CPP Investments to establish a joint venture combining Gigapower with the fiber assets acquired from Lumen. It also secured a multiyear fiber-supply agreement with Corning. Together, these arrangements support deployment beyond AT&T’s traditional operating territories.
Fiber and Wireless Reinforce the Converged Customer Model:
AT&T’s commercial strategy uses home broadband as an anchor for a broader customer relationship, then adds wireless and other services. Management argues that owning and operating both fiber and mobile infrastructure provides local operating scale and greater control over service delivery and economics.
“In the dense, urban and suburban areas where we deploy both fiber and 5G infrastructure at scale, we believe that our competitors cannot and will not match our operating proficiency, network performance, or exceptional converged value proposition.”
— John Stankey, Chairman and Chief Executive Officer
The quarter provides measurable evidence of cross-selling momentum. Converged relationships increased by approximately 350,000, and management said convergence penetration in the acquired Lumen territories had risen 2.5 percentage points since the transaction closed in February. AT&T’s convergence metric includes both AT&T Fiber and Internet Air households with a qualifying postpaid wireless account; it is not a fiber-only measure.
Importantly, this is a measure of commercial convergence, not proof of a particular fixed-mobile core-network architecture. The reported indicator tracks customers taking both services. AT&T’s strategic claim is that the combined infrastructure and customer relationship improve competitiveness and lifetime value.
The economics nevertheless involve a near-term tradeoff. Fiber average revenue per user declined 4% year over year, reflecting introductory pricing, converged-account discounts, and lower-ARPU customers in the acquired Lumen markets. Management is prioritizing total account value, service-revenue growth, and margins rather than maximizing standalone broadband ARPU. Advanced Connectivity service revenue increased 6.1%, while segment EBITDA rose 7.3%.
Copper Retirement Removes the Cost of Parallel Legacy Networks:
Fiber expansion is only part of AT&T’s network transformation. The company is also migrating customers away from copper-based services so that it can retire legacy infrastructure and remove associated operating costs.
“Our progress here is picking up momentum, and we now have more than 100 wire centers with no customers supported by legacy services.”
— John Stankey, Chairman and Chief Executive Officer
That milestone does not necessarily mean those facilities have closed or that all equipment has been removed. It means no customers in those wire centers remain supported by legacy services—a prerequisite for subsequent infrastructure decommissioning and cost elimination. AT&T identifies customer migration and regulatory approvals as dependencies in removing legacy fixed costs.
Management targets discontinuation of copper-based services in 50% of wire centers outside California by the end of 2027 and substantially all of those wire centers by the end of 2029. Copper retirement is one component of the broader program targeting $4 billion in annual consolidated cost savings by the end of 2028; that figure is not a copper-only savings target.
Outlook: Monetizing Fiber Reach and High-Capacity Connectivity:
AT&T’s operating results indicate that subscriber growth and cost transformation are translating into improved segment profitability.
“We exited the third quarter with great operating momentum, and we continue to expect full-year Advanced Connectivity service revenue growth of 5%+ and EBITDA growth of 6%+.”
— Pascal Desroches, Chief Financial Officer
The next execution test is converting additional fiber availability into sustained penetration and profitable multiproduct relationships. CEO Stankey said AT&T evaluates fiber investments against a terminal penetration assumption of 40%, while pursuing higher take rates over time. He also left open the possibility of wholesale access in selected markets to improve utilization and returns.
Conclusions:
Beyond residential broadband, management sees its metropolitan fiber footprint supporting enterprise and AI-related connectivity. Stankey said more than 90% of mapped U.S. data centers are within 10 miles of AT&T fiber and more than 80% are within one mile. He identified AWS and Microsoft as customers for high-capacity connectivity supporting their expanding requirements. Proximity, however, should not be confused with an installed connection or a contracted service.
“This asset base puts us in a leading position to serve converged consumer and business customers today and well into the future, as AI becomes a key driver of their connectivity needs and requires ever-improving high-performance networking.”
— John Stankey, Chairman and Chief Executive Officer
The concrete AI-related opportunity is not simply increased household data consumption. AT&T is positioning its fiber infrastructure for business endpoints, metro aggregation, and managed multi-cloud connectivity—extending the potential revenue base beyond residential access while continuing to expand its converged fiber-and-wireless customer relationships.
“The accelerated growth we delivered this quarter shows our structural advantages to lead the next era of connectivity,” CEO Stankey said in a statement. “We are accelerating the pace of our planned share repurchases this year to approximately $10 billion, reflecting our confidence in our market position,” he added.
……………………………………………………………………………………………………………………………………………………………………
References:
https://about.att.com/story/2026/3q-earnings.html
https://markets.ft.com/data/announce/detail?dockey=600-202610210630CANADANWCANADAPR_C2239-1
AT&T Exits Mexico in $2B Deal with Televisa and Fintech Holdings
AT&T’s 600 MHz Deployment with Ericsson: Turning Low-Band Spectrum Into Coverage and Uplink Capacity
AT&T/Ericsson Demonstrate 5G-Based ISAC for Drone Detection at World Cup Stadium
Network X Americas: AT&T and Comcast reveal huge AI impact on network operations
Analysis: AT&T 1Q-2026 results: increased fiber penetration, FWA momentum, D2D deals, and mobile/home internet bundles
AT&T grows fiber revenue 19%, 261K net fiber adds and 29.5M locations passed by its fiber optic network
AT&T sets 1.6 Tbps long distance speed record on its white box based fiber optic network
Lumen launches Multi-Cloud Gateway (MCGW) and expands metro fiber network after selling consumer FTTH business to AT&T
AI-RAN Push: NVIDIA, Nokia, and Operators Drive Towards Distributed Compute Platforms
Introduction:
A massive industry consortium spearheaded by NVIDIA, Nokia, and leading global telecom operators has announced an expanded ecosystem initiative aimed at transforming traditional radio access network (RAN) sites into converged, distributed intelligence platforms. While vendor marketing frequently leans on the ambiguous hype of “AI-RAN,” this specific alignment underscores a tangible structural shift: the push to monetize edge network infrastructure by hosting centralized AI inference and processing workloads directly within the carrier’s decentralized footprint.
The coalition, which includes T-Mobile US, Deutsche Telekom, Orange, and SoftBank, is actively deploying multi-vendor frameworks to validate whether cell sites can simultaneously manage real-time layer-1/layer-2 radio scheduling and high-throughput external AI workloads on a single, unified hardware fabric.
Multi-Vendor Validation and Live Network Milestones:
Rather than remaining confined to isolated laboratory benchmarks, the initiative highlighted several live-network implementation milestones:
-
- T-Mobile US Commercial Network Execution: T-Mobile completed a live AI-RAN call within a commercial production environment, leveraging Nokia’s cloud-native RAN software integrated with NVIDIA’s accelerated computing architecture. The trial successfully demonstrated dynamic, real-time compute resource allocation between standard cellular traffic and concurrent AI applications.
- European Operator Deployment Frameworks: Deutsche Telekom and Orange are initiating deep architectural trials across their European footprints. These validation tests focus explicitly on multi-tenant control planes and the orchestration of heterogeneous GPU resources across legacy and greenfield environments.
- SoftBank Industrial Clusters: Moving past speculative trials, SoftBank is designing localized edge computing clusters that treat cell towers as distributed mini-data centers, targeted directly at hosting low-latency, localized autonomous vehicle and industrial robotics workloads.
Globally, nearly 20 telecom operators have publicly announced AI-RAN collaborations using Nokia anyRAN software and NVIDIA ARC.
- T-Mobile recently marked the world’s first AI-RAN call on its commercial network in Bellevue, Washington, running on commercial ARC servers, Nokia’s NVIDIA CUDA-accelerated RAN software and massive multiple-input multiple-output radios, and connected to an existing 5G Standalone core and a commercial smartphone.
- BT is planning live AI-RAN trials in Birmingham, England, with Nokia and NVIDIA in 2027.
- Deutsche Telekom has validated Nokia and NVIDIA’s commercial AI-RAN platform in Bonn and Oulu labs, including AI-enhanced uplink channel estimation to improve uplink user throughput, with plans to move to field trials in 2027.
- Elisa simultaneously ran voice, mobile data and video analytics on the NVIDIA ARC platform, marking a European first in Elisa’s over-the-air field environment using 5G spectrum. The trial clears the way for distributed deployment and commercial AI-RAN services in 2027.
- Orange is testing Nokia 5G software on NVIDIA ARC, focusing on AI-RAN spectral efficiency improvements and support for edge services in live networks.
NVIDIA is introducing two ARC configurations — MGX 2U and MGX 4U — designed for dense, high-capacity intelligence and radio workloads, typically deployed at centralized RAN sites. Powered by NVIDIA RTX PRO™ 6000 Blackwell Server Edition GPUs, the configurations will offer x86 and NVIDIA Vera CPU options. Dell Technologies, Quanta Cloud Technology and Supermicro will offer ARC-ready servers.
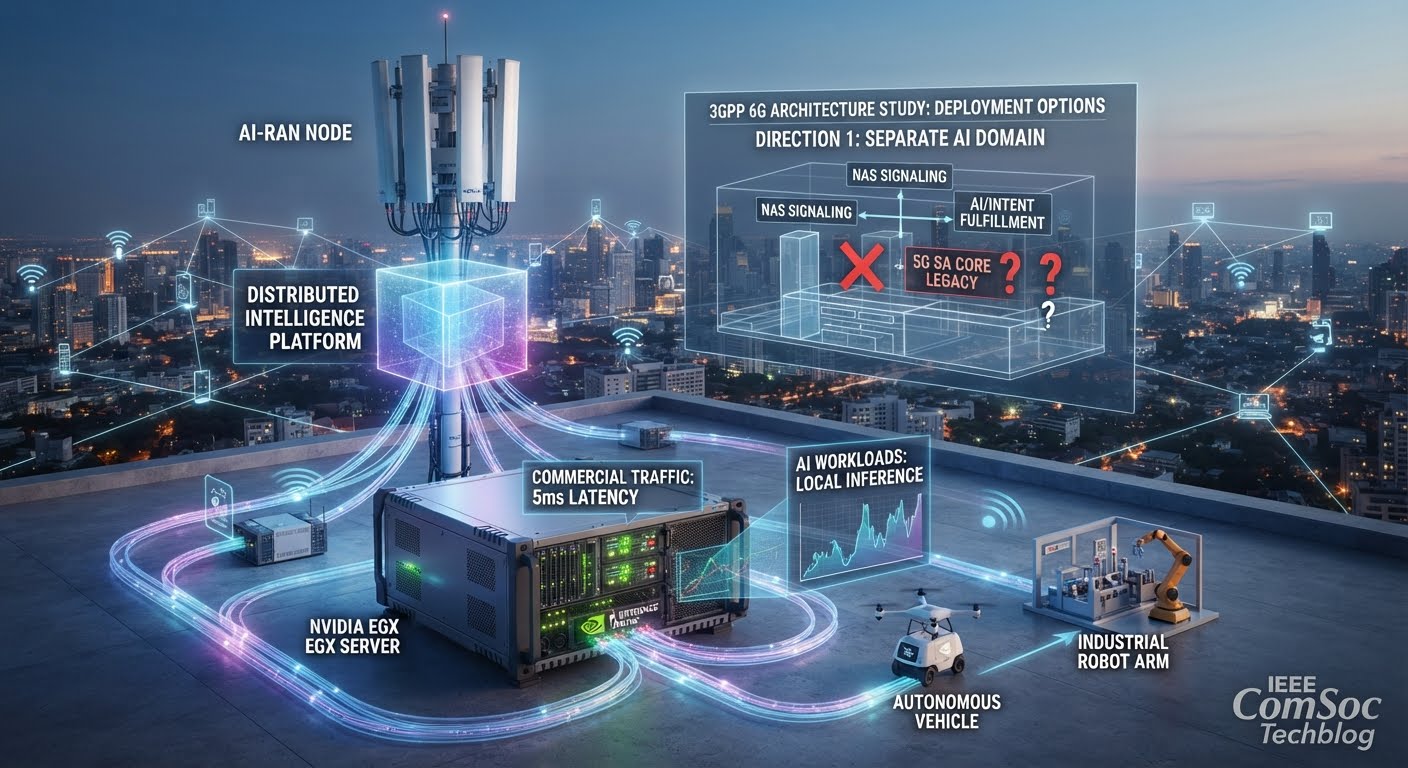
Image generated by Google Gemini
………………………………………………………………………………………………………………………………………………………………………………………
6G Splinter Risk – Will AI-RAN Interoperability Outpace the 6G SA Core?
This real-world push for decentralized AI-RAN execution exposes a critical timing and protocol gap within the broader standardization landscape. As vendors accelerate hardware deployments, the 3GPP SA2 Working Group remains technically fractured over how to formalize the underlying 6G core architecture. Rather than standardizing deterministic state behaviors, the current 6G study phase risks repeating the exact implementation voids that crippled 5G Standalone (SA) interoperability. Today’s commercial push for AI integration highlights the three architectural paths currently splintering 3GPP SA2:
-
- Direction 1 (Separate AI Domain): Anchors the core to the existing 5G Service-Based Architecture (SBA). It utilizes a dedicated AI domain for intent handling via the Service-Based Interface (SBI) while routing Non-Access Stratum (NAS) signaling through the AMF. Backed strongly by Western operators and vendors (including T-Mobile, Deutsche Telekom, Nokia, and NVIDIA), this path preserves 5G infrastructure investments but shifts the burden of multi-vendor integration directly to the device client.
- Direction 2 (AI Functionality in 6G NFs): Integrates machine learning natively within dedicated, standardized 6G network functions following legacy pipeline procedures.
- Direction 3 (Agent-Handled Connectivity): Eliminates traditional structural silos by deeply embedding autonomous AI agents directly into control and user plane procedures, bypassing the AMF entirely via a new Signaling Routing Function (SRF). This introduces massive procedural disruption to baseband silicon and core security frameworks.
………………………………………………………………………………………………………………………………………………………….
Conclusions – Bridging the Hype Gap:
The core engineering risk is that AI and machine learning models are fundamentally non-deterministic. If 3GPP restricts its focus to defining logical API endpoints rather than mandating strict behavioral state-machine realization, open agent-to-agent telemetry, and standardized model interchange formats, 6G will degenerate into a hyper-complex web of proprietary black boxes.
•Telcos have historically struggled to compete with hyperscalers (AWS, Azure, Google Cloud) on raw cloud storage and compute. AI-RAN could possibly the game because of physical close proximity and deterministic latency. By hosting AI workloads at the edge of the connectivity path, network operators might offer “Sovereign AI” and ultra-low-latency processing which centralized hyperscaler data centers physically cannot match.
As detailed in several previous IEEE Techblog posts (see References below), the telecom industry cannot afford another capital expenditure cycle driven by speculative lab benchmarks. By transforming cell towers into high-margin compute platforms, this distributed intelligence alliance offers carriers a concrete pathway to monetize low-latency edge workloads. However, for AI-RAN to achieve true multi-vendor utility, the engineering community must force 3GPP to bridge the gap between paper standards and deterministic software reality. We cannot afford to build another ghost in the machine.
………………………………………………………………………………………………………………………………………………………….
References:
6G Architecture and Economics: Core Network Evolution, AI Integration and Business Case
Warning: 6G core network must not repeat the 5G SA 3GPP architecture specs vs lack of interoperable standards
Sept 2026 3GPP meeting updates for 5G Advanced and 6G planning (with timeline for submisson to ITU-R WP 5D via ATIS)
Roles of 3GPP and ITU-R WP 5D in the IMT 2030/6G standards process
3GPP approves timelines for Release 21 which will specify 6G RAN, Core and 5G Advanced
Dell’Oro: RAN Market Stabilized in 2025 with 1% CAG forecast over next 5 years; Opinion on AI RAN, 5G Advanced, 6G RAN/Core risks
Ericsson leads SK Telecom AI RAN vs. NVIDIA’s GPU centric AI RAN Alliance
Ericsson goes with custom silicon (rather than Nvidia GPUs) for AI RAN
Dell’Oro: AI RAN revenue forecast: $35B from 2026-to-2030; 3 types of AI RAN explained
6G Architecture and Economics: Core Network Evolution, AI Integration and Business Case
Introduction:
As the telecom industry moves closer to defining 6G features, functions, radio interfaces, and core network architecture, the questions become more demanding: What must change? Who will pay for it? How much of the investment in 5G can be preserved? Discussions at the recent RCR Wireless 6G Forum exposed the tension between introducing new capabilities and protecting operator investment. Although participants described broad support for an evolutionary approach, migration paths and the extent of architectural change remain unresolved.
Keysight’s Stephen Douglas described a standalone 6G architecture with a dedicated core [1.] from the outset, with potential initial commercial systems in mid-to-late 2029. That represents a prospective deployment timeline—not an agreed architecture or guaranteed commercial launch. Ericsson’s Marie Hogan outlined a different emphasis: standalone-style operation from day one, but with an evolutionary core that reuses components of the 5G standalone core while adding new functionality. Ericsson also advocates reusing existing spectrum and introducing a new air interface to deliver improved radio performance. These positions illustrate why “standalone 6G” does not, by itself, establish how much existing infrastructure operators would need to replace.
Note 1. 3GPP has sole responsibility for defining the 6G Core Network Architecture and associated specifications, which will surely be rubber stamped by ETSI (their host entity). Just like in IMT 2020/5G, ITU-T will not publish any IMT 2030 (6G) non-radio standards/recommendations.

Image: 123rf
…………………………………………………………………………………………………………………………………………………………………………………………………………………………………
The role of AI in the 6G core network remains equally unsettled in 3GPP. Approaches under discussion include incorporating AI into network functions, establishing a separate AI domain, and adopting more extensive agent-based architectures. These alternatives imply different requirements for interfaces, control, observability, and interoperability. Consensus is developing, but the 6G core architecture and its network functions have not been agreed.
Traffic forecasts are not investment cases:
Network operators are understandably wary of another capital-investment cycle without a clear path to acceptable returns, following the substantial investment required for 5G. As BT’s Rana Kamill cautioned, “Technology adoption doesn’t guarantee business success by default.” For 6G, commercial requirements must guide technology development from the outset, rather than serve as an after-the-fact justification. The industry should not repeat the mistake of treating a technical capability—such as ultra-reliable low-latency communications (URLLC)—as a business case in itself.
In the lead-up to 5G deployment, network equipment vendors and operators heavily promoted 5G/IMT-2020 URLLC as the foundation for new latency-critical applications, presenting prospective capabilities as commercially imminent. Yet when Release 16 was frozen in 2020, the relevant URLLC RAN enhancements remained incomplete and their targeted performance had not been validated, as documented in our contemporaneous reporting. The lesson for 6G/IMT-2030 is clear: proponents must demonstrate both the required performance across the complete service path and a commercially viable customer proposition—not treat a radio-interface target or a staged demonstration as proof of either.
Ericsson argues that AI-enabled devices and applications will increase uplink demand and eventually require capabilities beyond those of 5G and 5G-Advanced. However, the reported figures are not directly comparable. RCR’s headline describes a sixfold increase, while the article quotes Hogan forecasting a threefold increase followed by a further threefold increase. Separately, the Ericsson Mobility Report presents scenarios projecting twofold, threefold, or fivefold uplink traffic growth by 2031, depending on AI-device adoption and usage. These figures should not be combined into a single settled forecast.
The scale and timing of AI-driven uplink growth therefore remain uncertain. The incremental investment case for 6G depends on where that demand materializes, which capacity, latency, and other performance requirements it imposes, and whether 5G-Advanced can satisfy those requirements more economically.
The vitally important operator 6G investment question is therefore not simply whether AI agents, connected sensors, and physical AI systems generate more traffic. It is which workloads require additional uplink capacity, tighter latency bounds, or new network functionality—and whether those requirements can be met economically through 5G-Advanced rather than a generational replacement. Ericsson itself acknowledges that substantial scope remains to evolve 5G SA and 5G-Advanced before 6G becomes available.
Téral on 6G Standards (ITU-R & 3GPP):
Stéphane Téral, founder and chief analyst at Téral Research, told RCR Wireless 6G Forum 2026 that broad support for an evolutionary 6G does not amount to an agreement on its implementation. He expects continued use of OFDM and 5G channel-coding schemes, helping preserve ecosystem scale and device affordability. However, spectrum choices (from ITU-R- NOT 3GPP) and 5G-to-6G migration paths—including overlay and dual-connectivity options—remain unresolved. The takeaway: agreement on continuity is not yet an agreed deployment blueprint.
Téral also challenged the assumption that 6G requires a dedicated new core (3GPP responsibility), arguing that existing 5G network functions could be sufficient. He identified competing approaches to AI integration: a separate AI domain, AI embedded in network functions, and network-integrated AI agents. Importantly, he distinguished AI-based network optimization, already used for more than a decade, from the requirements of a new mobile generation. The architectural test should therefore be what demonstrably requires 6G—not simply what incorporates AI.
Geopolitical competition adds another obstacle to consensus. “6G leadership is a proxy for future economic and military superiority,” Téral said, warning that competing national and industry priorities could fracture the global standard. Spectrum harmonization, with ITU-R’s WRC-27 an important milestone, remains part of that challenge. His warning highlights the tension between preserving a globally interoperable, affordable ecosystem and pursuing national technological advantage.
His strongest commercial challenge concerned sensing applications: “I see many use cases, but I just don’t see the money, because somebody has to pay for it.” Potential applications, including agricultural weather sensing, do not establish paying customers or sustainable operator returns. The central takeaway is that 6G needs more than technical consensus: proposals must identify what existing infrastructure can be retained, which capabilities justify additional investment, and who will pay for the resulting services. Efficiency gains and new service revenues are distinct economic propositions; neither should be assumed from technical feasibility alone.
Use cases must identify paying customers:
Integrated sensing and communications (ISAC) illustrates the distinction between technical opportunity and commercial demand. AT&T and Ericsson have published a white paper on ISAC, but the fundamental monetization question remains. As cellular industry analyst Stéphane Téral put it at the forum: “I see many use cases, but I just don’t see the money, because somebody has to pay for it.” Identifying a sensing application does not establish who will purchase the service, what they will pay, or whether operator revenue will justify deployment and operating costs.
Incremental improvements can still have economic value: greater capacity, improved spectrum efficiency, and lower operating costs may justify investment without a new “killer application.” But those benefits must be quantified, and claims of new service revenue require a separate commercial case. Hogan acknowledged that distinction, arguing that 6G must deliver measurable monetization or efficiency benefits rather than merely a new generation indicator on a handset.
Conclusions:
The burden of proof rests with each proposed 6G architectural change: what requirement cannot be met economically by 5G-Advanced, what deployed assets can be retained, and what measurable benefit justifies the transition? Capacity expansion and operating-cost reductions can support investment without a “killer application,” but they should not be conflated with new service revenue. A credible 6G strategy must establish those economic cases separately.
The crucial test will be use cases and economics: which business and/or residential customer problems require 6G, what existing assets can be retained, and whether incremental revenue or cost savings justify the transition. The lesson for 6G is not to confuse technical deployment with commercial success. Architecture proposals, traffic forecasts, and application demonstrations must ultimately support a credible investment case—not substitute for one.
References:
https://rcrwireless.com/20261016/6g/6g-standards-teral
https://www.business.att.com/content/dam/attbusiness/briefs/att-ericsson-isac-whitepaper.pdf
Warning: 6G core network must not repeat the 5G SA 3GPP architecture specs vs lack of interoperable standards
Sept 2026 3GPP meeting updates for 5G Advanced and 6G planning (with timeline for submisson to ITU-R WP 5D via ATIS)
Roles of 3GPP and ITU-R WP 5D in the IMT 2030/6G standards process
3GPP approves timelines for Release 21 which will specify 6G RAN, Core and 5G Advanced
Dell’Oro: RAN Market Stabilized in 2025 with 1% CAG forecast over next 5 years; Opinion on AI RAN, 5G Advanced, 6G RAN/Core risks
SK Telecom, Intel develop low-latency technology for 6G core network
IMT-2030/6G Spectrum Sharing: The Roles of WRC-27, NTIA and ITU-R WP 5D
IMT-2030/6G Spectrum Sharing: The Roles of WRC-27, NTIA and ITU-R WP 5D
Introduction:
Spectrum sharing is emerging as a core requirement for IMT 2030/6G, as policymakers and operators seek additional capacity in bands already supporting federal, satellite and other incumbent services. A “Spectrum and Test Strategy for the 6G Era” panel was held online as part of the 3rd edition of RCR’s 6G Forum on October 6, 2026. Panelists included representatives from the National Telecommunications and Information Administration (NTIA), AT&T, LitePoint and the Dynamic Spectrum Alliance highlighted the implications for spectrum access, interference management, equipment testing and migration from IMT 2020/5G. Internationally, ITU-R WP5D is a focal point for IMT 2030 spectrum sharing along with WRC-27 (both are described below).
The approach aligns with Recommendation ITU-R M.2160, the framework for IMT-2030, which identifies spectrum-sharing technologies and enhanced coexistence techniques as areas for continued development. The challenge extends beyond identifying additional frequencies: the industry must establish technically viable operating conditions that protect incumbents while supporting commercially useful mobile deployments.
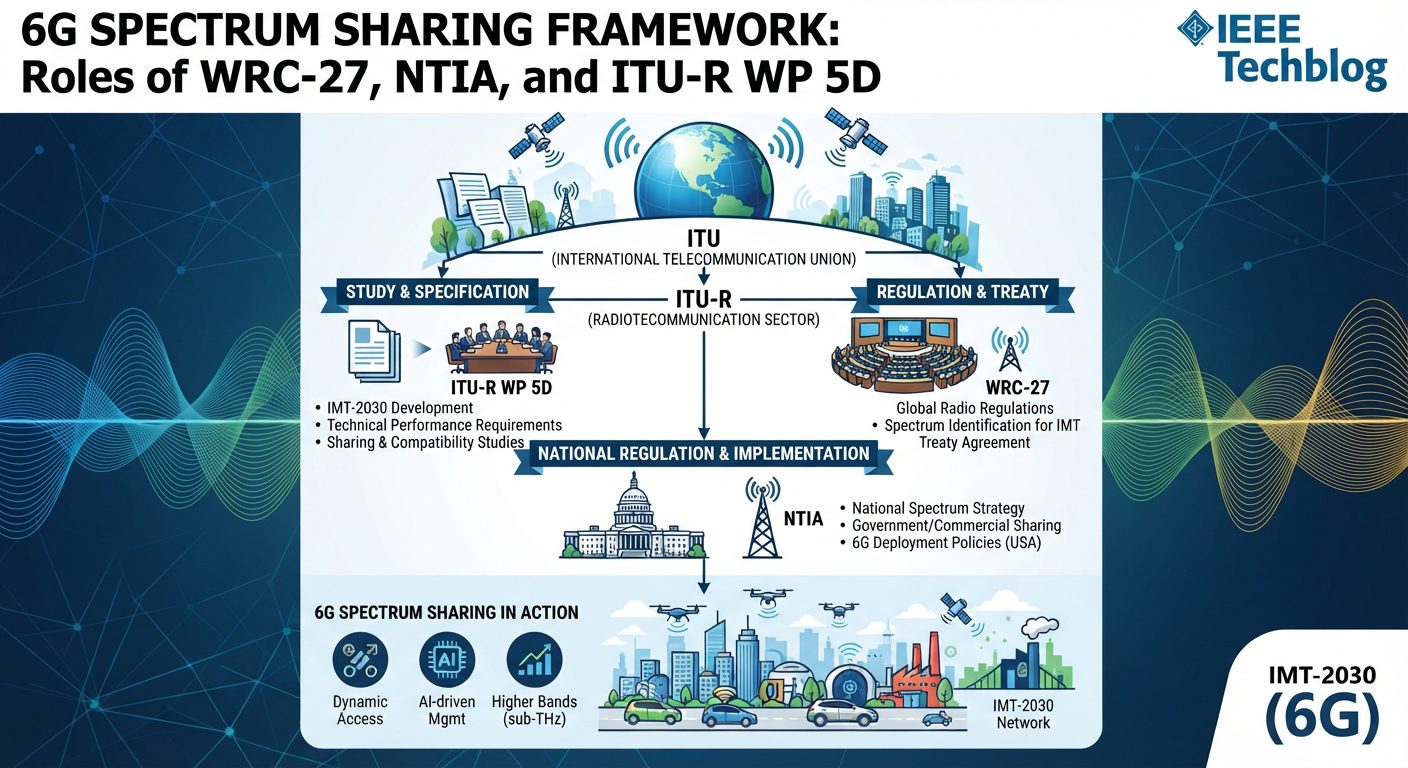
Image Credit: Google Gemini
…………………………………………………………………………………………………………………………………………………………………………………………U.S. Spectrum Pipeline – reallocation does not necessarily mean clearance:
In the United States, NTIA has a congressional mandate to identify 500 MHz of federal spectrum for commercial use within five years of the 2025 legislation. The broader legislative spectrum pipeline calls for 800 MHz by 2034. NTIA’s work includes studies of spectrum in the 1.6 GHz, 2.7 GHz, 4.4 GHz and 7 GHz ranges. Derek Khlopin, NTIA’s deputy associate administrator for spectrum, cautioned that identifying spectrum for commercial use does not necessarily mean incumbent systems can be cleared immediately.
Some federal systems could remain in affected bands “for a significant amount of time,” requiring continued sharing or other protection measures. “There will be more sharing necessary because the demands certainly aren’t stopping, not just from the mobile community, but from other spectrum users as well on the commercial side,” Khlopin said.
He described the likely outcome as “a bit of a mixed bag”: some systems could relocate, while others would remain under arrangements such as static exclusion zones or dynamic spectrum access. He cited the Citizens Broadband Radio Service (CBRS) as a “great model,” and suggested that better spectrum-use data and AI-based scheduling tools could improve sharing efficiency.
……………………………………………………………………………………………………………………………………………………………………………………………..
ITU-R and WRC-27: Establishing the conditions for additional IMT spectrum:
The international counterpart to these national studies is the ITU Radiocommunication Sector’s (ITU-R) preparatory work for the World Radiocommunication Conference 2027 (WRC-27).
Agenda item 1.7, under Resolution 256 (WRC-23), addresses sharing and compatibility studies and the development of technical conditions for International Mobile Telecommunications (IMT) in three frequency ranges: 4.4–4.8 GHz; 7.125–8.4 GHz, or portions thereof; 14.8–15.35 GHz.
The studies must account for existing primary services in both the candidate bands and adjacent spectrum. ITU-R Working Party 5D is the responsible group, working with other relevant ITU-R working groups.
These are candidate bands under study, not spectrum already cleared or guaranteed for 6G. Resolution 256 also specifies regional differences in the scope of potential IMT identification. Notably, the 4.4–4.8 GHz identification studies concern Regions 1 and 3, rather than Region 2, which includes the United States. The US domestic spectrum process and WRC-27 therefore overlap, but their frequency ranges and regulatory scope are not identical.ucc+1
The connection to the panel’s discussion is direct: sharing and incumbent protection are central to determining whether—and under what conditions—additional spectrum can support IMT. WRC-27’s agenda item 1.7 concerns those spectrum conditions, rather than the detailed design of the 6G air interface.
ITU-R WP 5D Spectrum Sharing Projects:
ITU-R Working Party 5D (WP 5D) is actively conducting spectrum sharing and compatibility studies for IMT-2030 (6G) across candidate frequency bands. WP 5D’s role is technical and preparatory: it develops Conference Preparatory Meeting (CPM) texts, technical sharing studies, compatibility analyses, and draft regulatory methods (working towards CPM reports extending through late 2026/2027). Here are the relevant 5D projects under World Radiocommunication Conference 2027 (WRC-27) agenda items:
- Agenda Item 1.7 (AI 1.7): WP 5D has received numerous sharing and compatibility studies for candidate bands, developing working documents and resolving technical criteria (such as power flux-density [PFD] calculations).
- Agenda Item 1.3/1.13 and related studies: WP 5D studies regulatory and technical parameters to protect the terrestrial components of IMT, collaborating jointly with other groups like WP 4C (satellite services).
- Technical & Evaluation Frameworks: WP 5D finalized key deliverables including draft reports on technical performance requirements (Report ITU-R M.[IMT-2030.TECH PERF REQ]) and submission/evaluation guidelines ahead of candidate Radio Interface Technology (RIT/SRIT) submissions kicking off in early 2027.
ITU-R Member States and regional telecommunication organizations (such as APT, CEPT, CITEL, ATU, Arab Spectrum Management Group) use WP 5D’s technical sharing and compatibility studies as the factual baseline to negotiate and submit Common Proposals (CPs) and national positions to WRC-27.
Separately, IMT-2030 candidate Radio Interface Technologies (RITs/SRITs) will begin being submitted to WP 5D starting around February 2027 (via proponents like 3GPP via ATIS). However, 5D will be tasked with generating IMT 2030 Frequency Arrangements after WRC-27 specifies the associated frequency bands.
………………………………………………………………………………………………………………………………………………………………………………………………………….
Interference management and the expanding test matrix:
For operators, access to shared spectrum must translate into sufficiently predictable network performance. Khushboo Kalyani, product marketing manager at LitePoint, said regulators and standards bodies need to define interference conditions—including transmit-power limits, unwanted emissions, waveform characteristics and frequency offsets—so equipment manufacturers and test vendors can evaluate devices against a consistent set of requirements
“There could be 100 different real-world situations that a device comes through. You essentially cannot test against that,” she said. The practical alternative is to select representative test cases that characterize device performance under shared-spectrum and interference conditions
The challenge will intensify as 6G introduces additional frequency bands, sharing arrangements, modulation schemes and antenna configurations. Kalyani warned that these variables could substantially expand the test matrix, lengthening development cycles and increasing manufacturing test costs.
“You’re essentially now going to be testing a combination of combinations,” she said. She expects the industry to concentrate on practical subsets of scenarios rather than attempt exhaustive testing of every configuration.
MRSS: A potentially more efficient migration mechanism than DSS:
The panel also examined a separate form of sharing: coexistence between successive generations of cellular radio access technology within an operator’s spectrum.
Milap Majmundar, AVP, emerging network, spectrum technologies and standards at AT&T Labs, said multi-radio access technology spectrum sharing (MRSS) between 5G and 6G could avoid some of the inefficiencies associated with LTE/5G dynamic spectrum sharing (DSS).
DSS incurred overhead from LTE control channels and the need to accommodate LTE’s cell-specific reference signals. By comparison, “[New Radio/NR] does not have these fixed common reference signals,” he said. NR’s leaner signal structure provides a more favorable starting point for intergenerational spectrum sharing.lightreading+1
“I’m actually quite optimistic that we will be able to make, as an industry, 5G/6G MRSS to be much more efficient than what we had with 4G/5G DSS,” Majmundar said.
MRSS could enable operators to introduce 6G in existing 5G spectrum, leveraging established coverage rather than relying exclusively on new upper-midband deployments. However, its eventual efficiency, equipment-upgrade requirements and carrier-aggregation capabilities remain important implementation questions. MRSS addresses migration within cellular networks; it does not replace the incumbent-sharing and compatibility work required to open additional bands.itu+1
Upper 6 GHz: Diverging national approaches:
Martha Suarez, president of the Dynamic Spectrum Alliance, argued that planning for the next generation of connectivity should also account for Wi-Fi and non-terrestrial networks.
“I agree with the concept that 6G should have sharing as part of the concept itself. I think it’s harder now to find exclusive bands for everything,” she said, adding that spectrum could support different applications according to deployment conditions and local requirements
Suarez pointed to the United Kingdom’s proposed upper-6 GHz framework as an example of how priority access and sharing could coexist.
Under the proposal described by Ofcom, 6.425–6.585 GHz would be prioritized for Wi-Fi, while 6.585–7.125 GHz would be prioritized for mobile. An automated frequency coordination (AFC) system would support controlled Wi-Fi access to the mobile-priority portion, including in locations where mobile networks are not deployed and before mobile services enter the band. This is more specific than unrestricted access whenever a channel appears idle: sharing would operate under defined technical conditions and coordination controls.
Suarez said such arrangements could balance investment certainty with more intensive spectrum use. “Those models could also be considered,” she said. The United States has taken a different approach, permitting unlicensed operation across 5.925–7.125 GHz, subject to the applicable device-class and incumbent-protection rules. Suarez endorsed that policy and encouraged other countries to consider its benefits.lightreading+1 and they think that they will need part of the upper 6GHz band for future networks. But we are encouraging them to have some type of sharing,” Suarez said.
The upper-6 GHz debate should not be conflated with WRC-27 agenda item 1.7: that item’s 7 GHz candidate range begins at 7.125 GHz, immediately above the upper-6 GHz band. National decisions on mobile/Wi-Fi coexistence and ITU-R studies of additional IMT spectrum are related elements of future spectrum planning, but they concern distinct frequency ranges and regulatory processes.
……………………………………………………………………………………………………………………………………………………………………………………………………
References:
https://apt.int/sites/default/files/file_tag/2026/03/WP_5D_UPDATES.pdf
https://www.lightreading.com/6g/6g-faces-a-spectrum-sharing-future
https://www.ericsson.com/en/6g/spectrum
Oct 2026: PRELIMINARY DRAFT NEW ITU-R WP 5D REPORT: M.[IMT-2030.SUBMISSION]
ITU-R M.[IMT-2030.EVAL] & ITU-R M.[IMT-2030.SUBMISSION] reports: Evaluation & Submission Guidelines for 6G RIT/SRITs (6G)
ITU-R WP 5D Timeline for submission, evaluation process & consensus building for IMT-2030 (6G) RITs/SRITs
Perspective & Analysis of ITU-R Workshop on IMT-2030 (6G) terrestrial radio interfaces: February 10, 2027 in Geneva, Switzerland
IMT-2030 (“6G”) Minimum Technology Performance Requirements for Radio Interface Technologies
Sept 2026 3GPP meeting updates for 5G Advanced and 6G planning (with timeline for submisson to ITU-R WP 5D via ATIS)
Roles of 3GPP and ITU-R WP 5D in the IMT 2030/6G standards process
3GPP approves timelines for Release 21 which will specify 6G RAN, Core and 5G Advanced
SNS Telecom & IT report on RAN Automation: Opportunities, Challenges, Strategies and Forecasts
by James Bennett with Alan J Weissberger
Introduction:
SNS Telecom & IT has just published their 648 page 2026 RAN Automation report. The report presents an in-depth assessment of the RAN automation market, including the value chain, market drivers, barriers to uptake, enabling technologies, functional areas, use cases, key trends, future roadmap, standardization, case studies, ecosystem player profiles and strategies. The report also provides global and regional market size forecasts for RAN and end-to-end mobile network automation from 2026 to 2040. The forecasts cover three network domains, nine functional areas, three access technology generations, 12 use case categories, three network types, two supplier categories and five regional markets.
Automation of the RAN (Radio Access Network):
The RAN is the most expensive, technically complex and power-intensive part of cellular infrastructure – is a key aspect of mobile operators’ AN (Autonomous Network) journeys towards L4 (Highly Autonomous) and eventually L5 (Fully Autonomous) operations. In conjunction with AI (Artificial Intelligence) and ML (Machine Learning), RAN automation has the potential to significantly transform mobile network economics by reducing the OpEx (Operating Expenditure)-to-revenue ratio, minimizing energy consumption, lowering CO2 (Carbon Dioxide) emissions, deferring avoidable CapEx (Capital Expenditure), optimizing performance, improving user experience and enabling new services.
Rakuten Mobile, China Mobile, STC (Saudi Telecom Company), TDC NET and several other operators have already achieved a limited level of L4 autonomy for specific use cases in their live RAN operations. The proven, quantifiable benefits of this level of intent-driven, closed-loop RAN automation range from 20% energy savings without compromising customer experience to a reduction of up to 60% in cell outages during major events such as the annual Hajj pilgrimage. Beyond terrestrial public mobile networks, RAN automation is also gaining traction in other segments of the cellular industry, supporting applications ranging from NTN (Non-Terrestrial Network) resource orchestration and terrestrial-satellite interworking to agentic AI-enabled private 5G network management, adaptive power control in offshore cellular deployments, ISAC (Integrated Sensing & Communications) for counter-drone operations and emission control for tactical 5G networks.
The RAN automation market traces its origins to the early 2010s when SON (Self-Organizing Network) technology – in the form of both embedded D-SON (Distributed SON) and C-SON (Centralized SON) implementations – was introduced to reduce cellular network complexity through self-configuration, self-optimization and self-healing. The pursuit of higher levels of autonomy, coupled with the multi-vendor interoperability, scalability and latency-related limitations of legacy SON solutions, is accelerating the transition to Open RAN automation with standards-based components that enable greater levels of RAN programmability and automation. These include the Near-RT (Real-Time) and Non-RT RICs (RAN Intelligent Controllers), SMO (Service Management & Orchestration) framework, rApps (RAN Applications), xApps (Extended Applications) and dApps (Distributed Applications).
…………………………………………………………………………………………………………………………………………………………..
| Term | Description |
| AN | Autonomous Network |
| AI | Artificial Intelligence |
| ML | Machine Learning |
| AI-RAN | Artificial Intelligence – Radio Access Network |
| RAN | Radio Access Network |
| OpEx | Operating Expenditure |
| CapEx | Capital Expenditure |
| CO2 | Carbon Dioxide |
| NTN | Non-Terrestrial Network |
| ISAC | Integrated Sensing & Communications |
| SON | Self-Organizing Network |
| D-SON | Distributed SON |
| C-SON | Centralized SON |
| RIC | RAN Intelligent Controller |
| Near-RT RIC | Near-Real-Time RAN Intelligent Controller |
| Non-RT RIC | Non-Real-Time RAN Intelligent Controller |
| SMO | Service Management & Orchestration |
| rApps | RAN Applications |
| xApps | Extended Applications |
| dApps | Distributed Applications |
| RU | Radio Unit |
| DU | Distributed Unit |
| CU | Centralized Unit |
| E3 | Edge-Enhanced Exposure Interface |
| RF | Radio Frequency |
| GPU | Graphics Processing Unit |
| M&A | Mergers & Acquisitions |
Discussion:
Centrally coordinated rApps hosted on the SMO and Non-RT RIC layer have emerged as the preferred approach to multi-vendor RAN automation on a network-wide basis, especially as hybrid and Open RAN architectures become increasingly common in new RAN swap and rollout contracts. Additionally, SMO platforms are being positioned as a common foundation for cross-domain network autonomy that links observability, intelligence, intent management and closed-loop automation. From Swedish wireless giant Ericsson to Spanish private 5G orchestration specialist Neutroon, multiple SMO providers have already incorporated core network interfaces for end-to-end management and automation.
SMO/Non-RT RIC adoption is beginning to accelerate among brownfield operators – including but not limited to AT&T, Verizon, Telus, Vodafone, DT (Deutsche Telekom), Swisscom, STC, NTT DoCoMo, Chunghwa Telecom and Telstra – to enable network-wide automation across thousands of cell sites through RAN vendor-supplied, third-party and internally developed rApps. This follows greenfield operator Rakuten Mobile’s nationwide RIC deployment, along with in-house and third-party rApp integration, across its Open RAN-compliant footprint of 350,000 cells supplied by 10 distinct RU (Radio Unit) and DU/CU (Distributed and Centralized Unit) vendors.
While reluctance among DU/CU vendors has held back adoption of xApps and the Near-RT RIC, there is growing interest in the recently proposed E3 (Edge‑Enhanced Exposure) interface, which provides a standardized mechanism for dApps to directly interface with Open RAN baseband nodes for closed-loop control beyond the 10-millisecond latency limits of xApps, including lower-layer performance optimization, geolocation, integrated sensing, spectrum sharing and interference cancellation in 5G and future 6G deployments. RAN vendors and application developers – such as Nokia, NVIDIA, Radisys, IS-Wireless, Cohere Technologies, DeepSig, ISCO International, Unikie, Booz Allen Hamilton and ODC (ORAN Development Company) – have already committed to support the E3 interface. An alternative to dApps being pursued by some vendors is to offer proprietary AI-enabled, real-time optimization capabilities as software upgrades to existing RAN platforms through subscription-based licensing models. For example, Ericsson has recently launched a software subscription offering for service providers that embeds AI/ML models directly into RAN basebands and radios to improve performance and efficiency through microsecond-level inference for use cases such as scheduling, link adaptation, beamforming and multi-layer coordination.
Commonly referred to as AI-for-RAN, the deeper integration of AI, ML and their derivatives for RAN automation and optimization is the most commercially mature facet of the broader AI-RAN movement, which also encompasses AI-and-RAN – the co-hosting of RAN and external AI workloads on shared, GPU-accelerated infrastructure; and AI-on-RAN – the enablement of edge AI services for mobile subscribers. The launch of the first 6G networks – which are being standardized as AI-native systems from the outset – around 2030 is expected to significantly increase the scope for hardware-agnostic, software-led innovation and take the industry closer to fully autonomous network operations. RAN digital twins are also expected to play an increasingly important role, allowing operators to validate AI-enabled air interface features and train optimization algorithms in high-fidelity virtual environments before introducing them into live 6G networks.
- Largely driven by growing investments in both centrally coordinated SMO/RIC-enabled automation at the network level and AI-for-RAN software upgrades for embedded real-time intelligence and the replacement of static rule-based algorithms in RAN nodes, annual spending on AI-RAN automation and optimization software and services is expected to grow at a CAGR of 9% over the next four years, eventually reaching $1.1 billion by the end of 2030.
- Total spending on the wider RAN automation market – which includes traditional SON/proprietary network-level automation, AI-for-RAN upgrades, Open RAN SMO/RIC and d/x/rApps, RF planning tools and automated test/measurement solutions – is expected to grow at a CAGR of approximately 4% during the same period.
Progress Towards L4 RAN Operations & Quantifiable Benefits
- Mobile operators are making tangible progress towards L4 RAN operations as they work towards the longer-term goal of L5 networks. Rakuten Mobile, China Mobile, STC, TDC NET and several other operators have already achieved a limited level of L4 autonomy for specific use cases in their live networks. The proven, quantifiable benefits of this level of intent-driven, closed-loop RAN automation range from 20% energy savings without compromising customer experience to a reduction of up to 60% in cell outages during major events such as the annual Hajj pilgrimage.
- The pursuit of higher levels of autonomy, coupled with the multi-vendor interoperability, scalability and latency-related limitations of legacy SON solutions, is accelerating the transition to Open RAN automation with standards-based components that enable greater levels of RAN programmability and automation.
- In particular, centrally coordinated rApps hosted on the SMO and Non-RT RIC layer have emerged as the preferred approach to multi-vendor RAN automation on a network-wide basis, especially as hybrid and Open RAN architectures become increasingly common in new RAN swap and rollout contracts. Additionally, SMO platforms are being positioned as a common foundation for cross-domain network autonomy that links observability, intelligence, intent management and closed-loop automation. From Swedish wireless giant Ericsson to Spanish private 5G orchestration specialist Neutroon, multiple SMO providers have already incorporated core network interfaces for end-to-end management and automation.
- SMO/Non-RT RIC adoption is beginning to accelerate among brownfield operators – including but not limited to AT&T, Verizon, Telus, Vodafone, DT, Swisscom, STC, NTT DoCoMo, Chunghwa Telecom and Telstra – to enable network-wide automation across thousands of cell sites through RAN vendor-supplied, third-party and internally developed rApps. This follows greenfield operator Rakuten Mobile’s nationwide RIC deployment, along with in-house and third-party rApp integration, across its Open RAN-compliant footprint of 350,000 cells supplied by 10 distinct RU and DU/CU vendors.
- While reluctance among DU/CU vendors has held back adoption of xApps and the Near-RT RIC, there is growing interest in the recently proposed E3 interface, which provides a standardized mechanism for dApps to directly interface with Open RAN baseband nodes for closed-loop control beyond the 10-millisecond latency limits of xApps, including lower-layer performance optimization, geolocation, integrated sensing, spectrum sharing and interference cancellation in 5G and future 6G deployments. RAN vendors and application developers – such as Nokia, NVIDIA, Radisys, IS-Wireless, Cohere Technologies, DeepSig, ISCO International, Unikie, Booz Allen Hamilton and ODC – have already committed to support the E3 interface.
- An alternative to dApps being pursued by some vendors is to offer proprietary AI-enabled, real-time optimization capabilities as software upgrades to existing RAN platforms through subscription-based licensing models. For example, Ericsson has recently launched a software subscription offering for service providers that embeds AI/ML models directly into RAN basebands and radios to improve performance and efficiency through microsecond-level inference for use cases such as scheduling, link adaptation, beamforming and multi-layer coordination.
Evolution Towards AI-Native 6G
- The deeper integration of AI, ML and their derivatives for RAN automation and optimization – commonly referred to as AI-for-RAN – is the most commercially mature facet of the broader AI-RAN movement. The launch of the first 6G networks – which are being standardized as AI-native systems from the outset – around 2030 is expected to significantly increase the scope for hardware-agnostic, software-led innovation and take the industry closer to fully autonomous network operations. RAN digital twins are also expected to play an increasingly important role, allowing operators to validate AI-enabled air interface features and train optimization algorithms in high-fidelity virtual environments before introducing them into live 6G networks.
RAN Automation for NTNs & Private 5G Networks
- Beyond terrestrial public mobile networks, there is growing interest in RAN automation for other segments, including the use of an SMO/RIC governance layer for dynamic resource orchestration in NTNs and interworking with terrestrial RAN infrastructure, from mobility and handover management to on-demand satellite coverage activation – particularly during disaster response scenarios.
- In the private 5G segment, RAN automation applications are being pursued for diverse use cases, including agentic AI to simplify network deployment and administration, converged management of Wi-Fi and private 5G networks, dynamic spectrum allocation between incumbents and other user groups, adaptive power control in offshore cellular deployments, indoor positioning for physical AI and industrial automation in 5G-connected factories, ISAC for drone detection and emission control to limit the electromagnetic signature of tactical 5G infrastructure during military operations.
- One recent example is the implementation of an NVIDIA-powered agentic AI solution for autonomous private 5G network optimization aboard vessels operated by Norwegian shipping company Color Line. In Japan, domestic integrator NTT East has recently concluded a series of tests with 26 vendors to evaluate RIC functionality for AI-enabled autonomous network control applications supporting transmit power optimization and interference mitigation in private 5G networks.
SMO/RIC Ecosystem Consolidation
- The Open RAN automation ecosystem is exhibiting signs of consolidation with Nokia’s acquisition of Juniper Networks’ SMO/RIC assets from HPE (Hewlett Packard Enterprise) and VMware’s exit from the market altogether. We anticipate seeing further M&A activity reminiscent of the SON boom in the previous decade. However, there’s no lack of diversity in the application segment with dozens of companies – including RAN vendors, third-party developers and mobile operators themselves – actively engaged in the development of rApps, xApps and, more recently, dApps.
Nokia & Ericsson’s United Front on rApp-Based Automation
- Nordic telecommunications infrastructure giants Ericsson and Nokia are presenting an unusually united front by joining each other’s SMO/rApp ecosystems, seemingly moving away from the SON era walled garden approach to clear the path for true cross-vendor automation.
……………………………………………………………………………………………………………………………………….
About the Author:
 James Bennett is the Founder and Managing Director of SNS Telecom & IT, a market intelligence and consulting firm that specializes in the telecommunications and information technology industries, with a particular focus on dissecting and analyzing some of the most technically complex segments and their future evolution. Under his leadership, the company has built a client base ranging from incumbent wireless infrastructure vendors and national mobile operators to small startups, through syndicated market research reports and databases, annual service subscriptions and sponsored research.
James also co-founded and successfully divested SNS Research, a sister market intelligence business unit specializing in the digital health, biotechnology and pharmaceutical sectors. James has over 35 years of experience across multiple facets of telecommunications and information technology, including mainframe computers with IBM, transmission and switching with Marconi, network planning and optimization with Aircom International, RAN engineering for the very first third-generation cellular networks in the Middle East, systems integration for one of the world’s first city-wide mobile video surveillance solutions deployed by the Abu Dhabi Police, consulting on one of the largest optical fiber network rollouts undertaken by a state-owned operator in South Asia and a satellite television set-top box manufacturing venture.
…………………………………………………………………………………………………………………………………………………………
References:
https://www.snstelecom.com/son
SNS Telecom & IT: Private 5G for the Defense Sector to hit $2.5 Billion by 2029
SNS Telecom & IT: Private 5G Market to Reach $6.6 Billion as Physical AI Takes Hold
SNS Telecom & IT: Mission-Critical Networks a $9.2 Billion Market
SNS Telecom & IT: Private LTE & 5G Network Ecosystem – CAGR 22% from 2025-2030
SNS Telecom & IT: Private 5G Market Nears Mainstream With $5 Billion Surge
SNS Telecom & IT: Private 5G and 4G LTE cellular networks for the global defense sector are a $1.5B opportunity
SNS Telecom & IT: $6 Billion Private LTE/5G Market Shines Through Wireless Industry’s Gloom