

Month: November 2013
Infonetics: Service Provider CAPEX to Grow at 2% CAGR to 2017
Infonetics Research released excerpts from its latest Service Provider Capex, Revenue, and Capex by Equipment Type report, which tracks telecom operator revenue and capital expenditures (capex) by operator type, region, and equipment segment and provides insight into telecom spending trends.
CAPEX REPORT HIGHLIGHTS:
. Europe’s Big 5-Deutsche Telekom, Orange, Telecom Italia, Telefónica, and Vodafone-slightly increased their capex year-over-year, a sign they remain committed to investing in their networks despite revenue declines
. Infonetics projects most equipment segments to grow in 2013, with the exception of voice, broadband aggregation, and video infrastructure
. Global telecom services revenue is anticipated to hit US$2 trillion in 2013
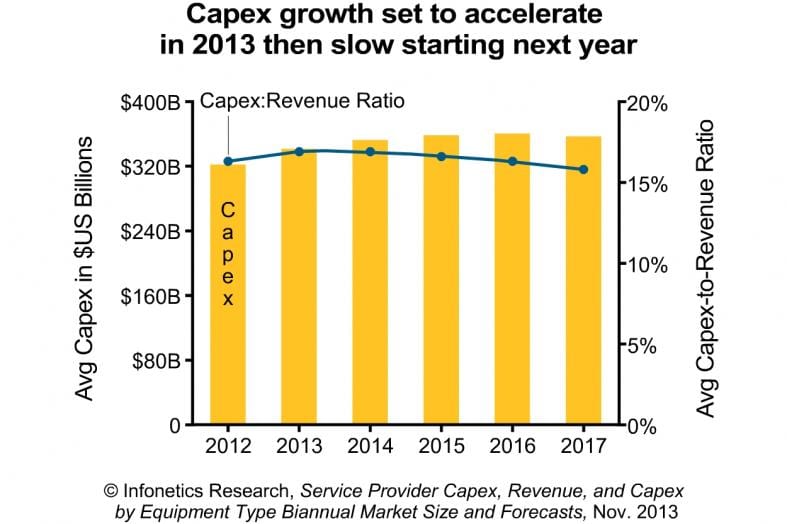
. Global telecom carrier capex is forecast by Infonetics to grow at a 2% compound annual growth rate (CAGR) from 2012 to 2017, reaching US$355 billion
. Wireless players are expected to continue their capex foray through 2017 at the expense of incumbents, who will see their share shrink
. Asia Pacific will remain the world’s largest spender through at least 2017
Stéphane Téral, principal analyst for mobile infrastructure and carrier economics at Infonetics Research wrote:
“Despite slow growth in 2012, the fundamentals are intact and 2013 is shaping up as the third year of an investment cycle characterized by capped capex in western countries, a hike in Japan, and the return of BRIC (Brazil, Russia, India, and China), which will provide most of the fuel for 6% year-over-year growth globally.”
To buy the report, contact Infonetics: http://www.infonetics.com/contact.asp
Comment: Infonetics’ sobering forecast is a far cry from the late 1990s CAPEX boom years. It appears that most of the Western world’s infrastructure is already built-out and growth is coming from developing countries. We’re quite surprised that new LTE networks, initial deployments of LTE Advanced, 100G b/sec fiber optic core network backbones, fiber to the premises/ node/ commercial buildings, SDN/NFV, and upgraded cloud network access aren’t contributing more to Service Provider CAPEX.
“The (network) core is a fraction of our capex, our costs are in the radio access network, mostly in radios, and those aren’t going to be virtualized right now,” said Fred Feisullin, senior network architect in the CTO’s office of Sprint. “The bigger gains are the new revenue sources that can be generated, then followed on by lower opex which will take much longer to be realized, then capex, maybe,” he added.
http://www.lightreading.com/carrier-sdn/sdn-architectures/carriers-say-s…
GSMA’s Global LTE Market Forecast; Infonetics: LTE Advanced Backhaul drives Microwave Market
The GSM Association (GSMA) ‘s research arm, GSMA Intelligence, put out its latest 4G projections which predict that LTE will account for one in eight, or 1 billion out of 8 billion, global mobile connections in the next three years. That’s up from the 176 million LTE connections reached to date.
The GSMA says nearly 500 LTE networks will be in service across 128 countries in 2017, roughly doubling the number of currrent LTE networks. The biggest difference will be where the networks are. Today, about 20% of the global population is within an LTE network coverage range, but that number climbs to 90% in the US alone compared to 47% in Europe and 10% in Asia.
The US currently makes up 46% of global LTE connections, but by 2017, the GSMA expects Asia to account for 47% of the global connections as more networks are rolled out in markets such as China and India. Right now, South Korea is the world leader with half of its connections on LTE, compared to 20% in Japan and the US.
GSMA also found that LTE users consume an average of 1.5GB of data per month, almost twice the amount consumed by non-LTE users. And, in developing countries, LTE users can generate ARPU that’s seven to 20 times greater than non-LTE users. In developed markets, ARPU is around 10% to 40% higher.
LTE networks have been deployed in 12 different frequency bands to date, but four out of five live LTE networks are in one of four bands: 700MHz, 800MHz, 1800MHz, or 2600MHz.
GSMA research found that:
- In most cases, the migration to 4G-LTE is happening considerably faster than the earlier migration from 2G to 3G
- LTE users consume 1.5 GB of data per month on average – almost twice the average amount consumed by non-LTE users
- In developing economies, operators have noted that LTE users can generate ARPU seven to 20 times greater than non-LTE users, while in developed markets operators have found that LTE can generate an ARPU uplift ranging from 10% to 40%
- Four out of five mobile operators that have acquired ‘new’ spectrum since January 2010 have been allocated airwaves aimed at supporting the launch of LTE networks
- LTE networks worldwide have been deployed in 12 different frequency bands to date, although four out of five live LTE networks today are deployed in one of four bands: 700 MHz, 800 MHz, 1800 MHz or 2600 MHz
- The average retail price (before discounts and subsidies) of LTE smartphones in developed markets such as the US has remained unchanged at around $450 for the last few years
- Handset subsidies have contributed considerably to the increase in LTE penetration over the last two years, but operators have also become more innovative in their pricing
For more information see: Global LTE network forecasts and assumptions, 2013–17
Infonetics Research released excerpts from its 3rd quarter 2013 (3Q13) Microwave Equipment report, which tracks time-division multiplexing (TDM), Ethernet, and dual Ethernet/TDM microwave equipment. In that report, Richard Webb, directing analyst for microwave and carrier WiFi at Infonetics Research wrote:
“The next round of backhaul market growth will be driven by macro LTE-Advanced upgrades and small cell deployments, both of which will require very low latency solutions,” continues Webb. “This will begin to make an impact from 2014 and boost the market for a few years.”
“The next round of backhaul market growth will be driven by macro LTE-Advanced upgrades and small cell deployments, both of which will require very low latency solutions. This will begin to make an impact from 2014 and boost the market for a few years,” Webb added.
3Q13 MICROWAVE MARKET HIGHLIGHTS:
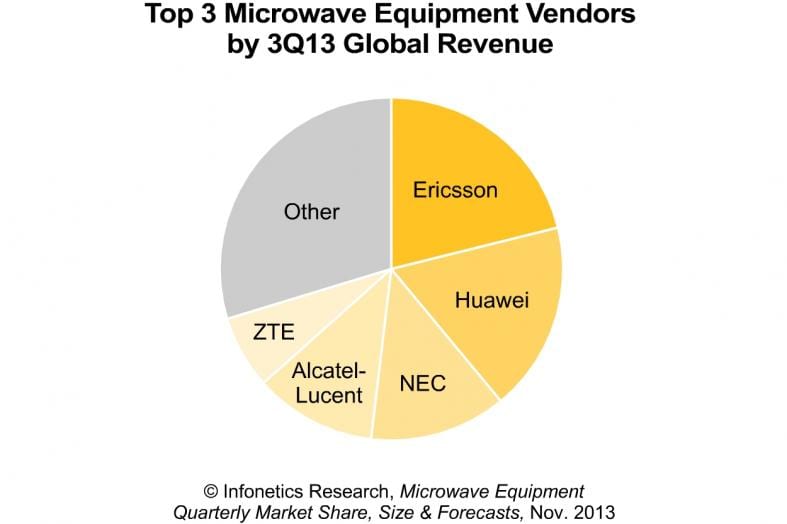
. Globally, in 3Q13 the microwave equipment market totaled $1.16 billion, up 2% from 2Q13, but down 7% from 3Q12
. All-packet microwave accounted for around 23% of total microwave equipment revenue
. Ericsson is again the microwave revenue market share leader in 3Q13, followed by Huawei, who reclaimed 2nd position from NEC
. The overall microwave equipment market will grow at just a 1.4% compound annual growth rate (CAGR) from 2012-2017, as the healthy growth of Ethernet microwave is masked by the disappearing TDM microwave segment and the rapidly declining dual Ethernet/TDM microwave segment
TO BUY INFONETICS REPORTS, CONTACT:
N. America (West), Asia Pacific: Larry Howard, [email protected], +1 408-583-3335
N. America (East, Midwest), L. America: Scott Coyne, [email protected], +1 408-583-3395
EMEA, India, Singapore: George Stojsavljevic, [email protected], +44 755-488-1623
Japan, South Korea, China, Taiwan: http://www.infonetics.com/contact.asp
Infonetics Survey: Operators answer the big questions about metro 100G and ROADM deployments
Infonetics Research released excerpts from its 40G/100G and ROADM Strategies: Global Service Provider Survey, which details the plans of operators transitioning optical transmission and switching equipment to higher-speed 40G and 100G wavelengths.
Based on respondent ratings of various technologies for optical deployments in metro regional networks, most operators prefer the same solution they already use in the long haul in the metro, albeit with lower specs and cost, Infonetics’ survey shows. Most new technologies designed to address the metro 100G opportunity (not all in the survey are shown in the accompanying Infonetics chart) were rated highly by only a few respondents.
ABOUT INFONETICS’ 40G/100G/ROADM SURVEY:
For its 26-page 40G/100G and ROADM strategies survey, Infonetics interviewed 28 incumbent, competitive, mobile and cable operators from Europe, North America, Asia and Latin America that have an optical transport network using WDM. Together the respondents represent a significant ~40% of the world’s telecom capex and revenue. The survey answers questions such as:
. The extent to which coherent technology is and will be deployed in existing brownfield networks versus new greenfield builds
. The magnitude and timing of future metro and core 100G deployments
. Preferred technologies for 100G metro and core deployments, including direct-detect 100G and Raman amplification
. How disruptive the rollout of 100G in the metro will be for vendor market share
. ROADM node deployment growth, as well as expected changes in the size and scale of ROADM nodes
. Service provider perceptions of and expectations for the cost of colorless, directionless, contentionless (CDC) ROADMs
. The rate of adoption of 100GbE clients, a key driver of metro 100G demand

ANALYST NOTE:
“The next big questions around 100G optical technology are about deployments in the metro network: When will deployments kick in, what will the volume be, which technologies will make the transition possible – advanced modulation, Raman amplification, pluggable formats, non-coherent approaches? We asked service providers around the world these questions and many more in our latest optical survey, and we learned a lot about what is about to happen in the market,” says Andrew Schmitt, principal analyst for optical at Infonetics Research.
Schmitt continues: “We now know, for example, that based on current operator thinking, 2016 will be the year that coherent 100G technology arrives in volume in metro networks. That is also when we expect cost-per-Gigabit pricing for 100G to edge out 10G in shorter reach applications. Right now what most people want is just what they have now, only cheaper,” adds Schmitt.
To buy the survey, contact Infonetics: http://www.infonetics.com/contact.asp
FREE WEBINAR: ALL ABOUT EDGE P-OTS
Join analyst Andrew Schmitt for a live debate about the advantages of a packet-optical transport system (P-OTS) architecture, integrating multiple layers, achieving optical layer-like transparency with different technologies, the role of software-defined networks (SDNs) in P-OTS, and more.
All About Edge P-OTS, Live Wednesday, December 4, 11:00 AM EST:
http://w.on24.com/r.htm?e=701343&s=1&k=035B786667CFC4BC1BAD2D1AAD952B11
Global Optical Network Hardware Sales Down, but Up in North America
Infonetics Research released vendor market share and preliminary analysis from its 3rd quarter 2013 (3Q13) Optical Network Hardware report. (Full report published November 26.) Seems like North America tier 1 carriers are spending big on 100G optical links.
3Q13 OPTICAL MARKET HIGHLIGHTS:
. Globally, the optical network hardware market (WDM and SONET/SDH) is down 7% sequentially in 3Q13, and down 1% from the year-ago quarter
. Total optical spending is flat on a rolling 4-quarter basis, with WDM growth accelerating and notching a 5th consecutive quarter of growth in 3Q13
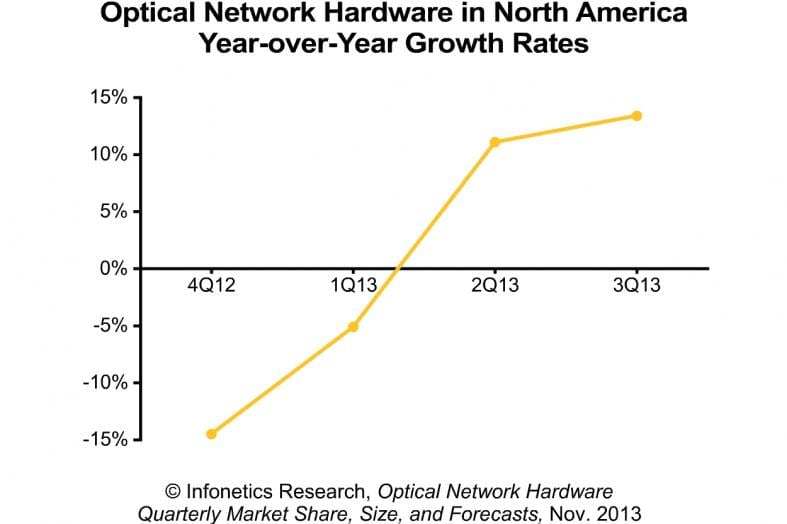
. North America optical spending jumped 13.4% year-over-year in 3Q13 following an 11.1% YoY increase the previous quarter, driven by aggressive 100G rollouts by tier 1 operators
. In 3Q13, EMEA (Europe, the Middle East, and Africa) WDM spending declined on a year-over-year and sequential basis, nearing the record low set in 1Q13
. Japan dragged down the Asia Pacific optical market in 3Q13, a result of spending retracing huge gains in 2012
. Huawei, Ciena, and Alcatel-Lucent are the WDM market share leaders in 3Q13
ANALYST NOTE:
“In the third quarter of 2013, sales of WDM optical equipment are up 4% from a year ago and remain at the elevated levels reached earlier in the year, but overall optical spending is down on a quarter-over-quarter and year-over-over basis,” says Andrew Schmitt, principal analyst for optical at Infonetics Research.
Schmitt adds: “Looking ahead, we expect tier 1 carriers to dial back spending. Capex was so strong in the first and second quarters of 2013, it’s unreasonable to anticipate a big flush in the fourth quarter, especially in North America. There’s a general weakness in the market, even from carriers that didn’t aggressively ramp spending earlier this year.”
ABOUT THE OPTICAL REPORT:
Infonetics’ quarterly optical hardware report provides worldwide and regional market size, market share, forecasts through 2017, analysis, and trends for metro and long haul SONET/SDH and WDM equipment, Ethernet optical ports, SONET/SDH/POS ports, and WDM ports. Vendors tracked: Adtran, Adva, Alcatel-Lucent, Ciena, Cisco, Cyan, ECI, Fujitsu, Huawei, Infinera, NEC, Coriant (NSN), Tellabs, Transmode, Tyco Telecom, ZTE, and others.
To buy the report, contact Infonetics: http://www.infonetics.com/contact.asp
Market research firm Ovum has a different forecast. The optical networks (ON) market will exceed US$17.5bn by 2018, for a 3.1 percent CAGR from 2012, predicts global analyst firm Ovum. An exceptionally strong 2Q13 has signaled the beginning of a spending bounce-back. 2Q13 was the strongest quarter in the last six and was the 7th highest quarter in the last 10 years.
In a new forecast analysis*, Global ON is projected to be up 1.1 percent in 2013 compared to 2012 based on positive growth forecasts for North America, SLTE, Asia-Pacific and South & Central America.
“Ovum’s 9.1 percent growth projection for North American ON sales in 2013 signals a solid bounce-back year after two years of non-growth” says Ian Redpath, Analyst, Network Infrastructure and author of the report. “Network core investments are resuming and 100G is being deployed in volumes. The North American tier-1 communications service providers (CSPs) and cable operators are investing in their core network to support all traffic types. ”
Huawei is leading the global optical networking (ON) space with 21 percent market share in the third quarter of 2013, said Ovum. Huawei’s Chinese rival ZTE has 13 percent market share in Q3 in ON. Alcatel Lucent is in the third position with 11 percent ON market share.
The Ovum report says telecom vendors Ciena, Fujitsu and Infinera grew revenues sequentially and year over year, thanks to their presence in North America. Infinera moved into the top 10 globally, ousting Coriant.
Global optical networking spending decreased 9 percent to $3.7 billion in Q3.
Ron Kline, principal analyst – Network Infrastructure at Ovum, said total spending may be under pressure, but when it comes to deploying the latest infrastructure to support exploding bandwidth requirements, the demand for 100G, OTN and packet switching capabilities provided by CPO gear continues to see strong growth among telecom operators.
The Ovum report says sequential and year-over-year gains in North America have mitigated declines in Asia-Pacific, EMEA and South & Central America. Market spending continues to fluctuate by quarter depending on region/sub region and seasonal spending patterns, resulting in stagnant sales on a global level.
The telecom analysis from Ovum says there will be 1 percent growth in ON in 2013 to $14.8 billion and exceeding $17.5 billion by 2018.
Strong Tier-1 N.A. operator spending drove increased converged packet optical (CPO) and 100G deployments in the North America. ON revenues in the region topped $1.1 billion in Q3.
Ovum says spending for ROADM, 40G and 100G all increased slightly over the prior quarter. CPO revenues fell due to lower spending in Asia-Pacific. Annualized CPO spending surpassed $7 billion for the first time.
CPO represents more than 50 percent of ON spending. The data center is the new central office, and operators are refreshing network technology to address changing traffic patterns as the steady march to IP continues.
AT&T now has 10 million U-verse Internet subscribers!
AT&T has surpassed the 10 million-subscriber mark for its U-verse broadband service, the telecom said Friday. U-verse customers composed 60% of AT&T’s wireline high-speed Internet base as of Sept. 30, compared with 43% a year earlier. The telecom cited Project Velocity IP, its multibillion-dollar effort to complete its fiber-optic and wireless platform, as a major factor in the surge in U-verse subscribers.
AT&T, which ended the third quarter with 9.7 million U-verse broadband customers, attributed part of its growth spurt to Project Velocity IP, its multi-billion dollar, three-year capital infusion to build out its Long Term Evolution (LTE) wireless network and its U-verse platform. According to AT&T, it has added about 2.5 million broadband customer locations since announcing the initiative about a year ago. The plan calls for AT&T to expand its IP broadband reach to about 57 million customer locations by the end of 2015.
“This latest milestone shows how U-verse is helping transform AT&T into a premier IP broadband company,”
said Lori Lee, senior executive vice president, AT&T Home Solutions.
AT&T is ramping up U-verse speeds, offering up to 45 Mbps (downstream) in 79 markets, with plans to ratchet speeds to 75 Mbps and 100 Mbps later. The new 45-meg tier, called U-verse High Speed Internet Power, carries an introductory price of $49.95 per month, putting it almost on par with the cost of the 6-Meg Elite tier, which costs $46 per month. Following the introductory offer period, the Power tier will be offered at $76 per month.
U-verse broadband has helped AT&T counterbalance losses of traditional DSL customers. While AT&T U-verse high-speed Internet subs continues to climb, the telco still lost 26,000 net broadband subs in the third quarter when DSL losses were factored in.
Note that customers may still be able to get U-Verse Internet access (called IP DSLAM), even when U-verse TV service is not available in that customer serving area.
The latest U-verse gains by AT&T come as US cable operators are beginning to experience a slowdown in their long-heady broadband growth. In a report issued by MoffettNathanson Research last week, senior analyst Craig Moffett found that cable operators are signing up substantially fewer high-speed data subscribers this year and taking less market share than they did before.
Moffett noted that cable operators accounted for 78 percent of the new broadband subscribers in the third quarter, down from an amazing 99 percent the year before. So, although cable is still taking the lion’s share of new broadband customers, he wrote, “it is doing so at a much more modest pace.” He also noted that two of the five largest MSOs, Time Warner Cable Inc. (NYSE: TWC) and Cablevision Systems Corp. (NYSE: CVC), reported unexpected broadband customer losses in the summer quarter while most major telecoms registered strong sub gains.
References:
http://www.att.com/gen/press-room?pid=25107&cdvn=news&newsarticleid=37296&mapcode=consumer|financial
http://www.multichannel.com/distribution/att-u-verse-surpasses-10-million-broadband-subs/146719
http://www.lightreading.com/u-verse-hits-10-million-mark-/d/d-id/706640?f_src=lightreading_gnews
Analysis of Cisco’s Application Centric Infrastructure (ACI) platform
Backgrounder:
Cisco Application Centric Infrastructure (ACI) delivers the first data center and cloud solution to offer full visibility and integrated management of both physical and virtual networked IT resources.
Leading companies supporting Cisco’s Application Centric Infrastructure include: BMC, CA Technologies, Citrix, EMC, Embrane, Emulex, F5, IBM, Microsoft, NetApp, Panduit, Puppet Labs, NIKSUN, OpsCode, Red Hat, SAP, Splunk, Symantec, VCE and VMware.
ACI is comprised of the Application Policy Infrastructure Controller (APIC), the Nexus 9000 portfolio, and enhanced versions of the NX-OS operating system. The Nexus 9000 family, running optimized NXOS, enables unmatched “zero-touch” operations across high performance data center networks, and can save customers millions of dollars in capital and operating expenses.
The new Nexus 9000 is also the foundation building block for the Cisco ACI solution, enabling a smooth transition from optimized NX-OS to the ACI-mode of NX-OS with a software upgrade and the addition of APIC. Using merchant silicon and custom ASICs, this portfolio delivers best of breed price performance and non-blocking port density for 1/10G to 10/40G and in the future 100G transitions in existing and next generation data centers. The Nexus 9000 portfolio includes state of the art system innovations including the industry’s first backplane-free modular switch to provide investment protection, efficient power and cooling, and a simpler design leading to two times the improvement in mean time between failures.
Note: Many testimonials are included in the news release at:
Analysis By Scott Thompson of FBR:
On Wednesday, November 6, Cisco announced its long-awaited initial products and roadmap for its Application Centric Infrastructure (ACI) platform. The solution is rolling out in the form of an SDN controller Application Programmable Controller Interface, or APCI) and yet another switching platform (Nexus 9000) that combine to deliver the ACI platform. We view the ACI platform, along with Cisco’s recent announcement of its NCS platform, on September 24th, as another step in the right direction and the core product battery that will drive refreshed orders in Cisco’s networking product set for the next three to five years. While the product refresh could drive orders, we expect the implications to gross margin, at least initially, could be negative. Our checks indicate the platform is getting positive feedback from service providers and large enterprises, but there are a few questions in our mind that were left unanswered:
(1) How much does the product cost?
(2) Will the product planners eventually open the northbound interface?
(3) How will the platform integrate new architectures moving forward? Most importantly, how much opportunity will ACI generate in rackscale architectures, which we believe will become a significant portion of IT spend in 2H14 and beyond?
While these questions remain, we view today’s announcement as another positive step for Cisco’s chances to maintain or grow market share in a changing industry.
* Full ACI rollout will take time. While our checks indicate the platform is being met with a reasonable amount of positive reviews from enterprises and service providers, the rollout time frame could be longer than many customers and investors would have hoped. Cisco continued to move slowly with respect to rolling out the ACI solution. While the Nexus 9000 switch is available today, many of the other components, including the controller, will not be available for beta test until at least January and are not scheduled to be generally available until next summer.
* Less talk of custom ASICs, more merchant silicon. We were surprised to hear the rhetoric around custom ASICs was
significantly toned down during the ACI announcement. The Nexus 9000 line appears to have utilized Broadcom’s Trident II ASIC, which is likely to help keep both costs and hardware differentiation down. Despite fewer references, we believe Cisco expects to continue to pursue its custom ASIC strategy over the longer term.
* ACI offers Virtual Machine (VM) tax avoidance? Cisco seemed to respond rather directly to the threat posed by VMWare’s NSX. Cisco seems to be boasting a 75% annualized per port cost savings when compared with an NSX solution. The primary difference, according to Cisco, is a “VM tax” or the recurring license payments one might make for the NSX solution, which is avoided by deploying Cisco’s ACI architecture. While Cisco does seem to have a point, we question whether VMWare will allow the argument to stand without a retort or making an adjustment to its pricing model.
Cisco Webinar on Unified Access:
| Cisco Unified Access offers a single network infrastructure that enables innovative, connected experiences. With greater business efficiency and security through context-aware intelligence, Cisco Unified Access helps with the convergence of wired and wireless infrastructure and one-network manageability. |
|
Find out about the latest developments in Cisco access switching, an integral part of Cisco Unified Access. During our live webcast on November 13, 2013, experts will reveal how to use Cisco access switching products and technologies for business agility, high-quality user experiences, and lower total cost of ownership (TCO). |
Infonetics Reports: Macrocell Mobile Backhaul and Millimeter Wave for Small Cell Backhaul
Infonetics Research released excerpts from its latest Macrocell Mobile Backhaul Equipment and Services report, which ranks mobile backhaul equipment vendors, identifies market growth areas, and provides analysis of equipment, connections, cell sites, and service charges.
MACROCELL MOBILE BACKHAUL MARKET HIGHLIGHTS:
. Infonetics expects global macrocell backhaul equipment revenue to inch up to $8.1 billion in 2013, an increase of just 1% from 2012
. IP/Ethernet is the clear driver of the macrocell backhaul market, performing the heavy lifting for ever-growing mobile bandwidth usage
. 94% of macrocell backhaul equipment spending in 2013 will be on IP/Ethernet gear
. Fiber is making up an increasing share of mobile backhaul installed connections, growing to 43% in 2017
. Ethernet microwave radio is forecast by Infonetics to grow at a 36% compound annual growth rate (CAGR) from 2012 to 2017, the highest of any equipment segment
ANALYST NOTES:
“Though it’ll be slow growth ahead for the macrocell mobile backhaul equipment market, this is still a huge market, one for which we expect operators to spend a cumulative $43 billion over the five years from 2013 to 2017,” notes Michael Howard, principal analyst for carrier networks and co-founder of Infonetics Research.
“Looking at the big picture, microwave TDM spending is declining, but the IP packet parts are gaining,” Howard adds. “We look for microwave revenue to dip slightly this year, while Ethernet microwave grows through 2017. IP edge routers will peak this year and then rumble along slightly downhill, with the strongest downward pull from Asia Pacific, countering the worldwide microwave momentum.”

REPORT SYNOPSIS:
Infonetics’ biannual macrocell mobile backhaul report provides worldwide and regional market share, market size, forecasts through 2017, analysis, and trends for macrocell mobile backhaul equipment, connections, installed cell sites, and service charges by technology. Companies tracked: Accedian, Actelis, Adtran, Adva, Alcatel-Lucent, Aviat Networks, BridgeWave, Canoga Perkins, Celtro, Ceragon, Ciena, Cisco, DragonWave, ECI, Ericsson, FibroLan, Huawei, Intracom, Ipitek, Juniper, MRV, NEC, NSN, Overture, Positron, RAD, Siklu, Telco Systems, Tellabs, Telrad, Thomson, ZTE, and others.
A separate Millimeter Wave Equipment report tracks unlicensed E-band and licensed millimeter wave equipment by market application (access, backhaul, and transport).
MILLIMETER WAVE EQUIPMENT MARKET HIGHLIGHTS:
. In the first half of 2013 (1H13), worldwide millimeter wave equipment revenue totaled $64 million, up 45% from the second half of 2012 (2H12)
. The millimeter wave market in EMEA comprised 61% of overall market revenue in 1H13, with growth coming from the UK, Germany, and Russia in particular, where 3G operators are deploying millimeter wave to support bandwidth backhaul in Moscow and St. Petersburg, Russia.
. 70-90 GHz (licensed) equipment accounted for 81% of millimeter wave sales in 1H13
. Israeli vendor Siklu was a major driver of unit volumes in 1H13 with its EtherHaul licensed millimeter wave products
. Sub10 Systems also saw increased activity and customer engagements in 1H13, predominantly in the 60 GHz range, where it plays a role in driving overall unit volume growth
ANALYST NOTE:
“A number of factors are converging to power robust growth in the millimeter wave equipment market-wider adoption by operators, price erosion, spectrum availability, and the continuing demand for backhaul capacity. Infonetics is forecasting a 61% compound annual growth rate for millimeter wave gear from 2012 to 2017,” reports Richard Webb, directing analyst for microwave and carrier WiFi at Infonetics Research.
Webb adds: “From 2014, licensed and unlicensed millimeter wave will play an increasingly significant role in outdoor small cell backhaul, driving the total market for equipment as deployments start to scale.”

REPORT SYNOPSIS:
Infonetics’ biannual millimeter wave report provides worldwide and regional market size, vendor market share, forecasts through 2017, analysis, and trends for unlicensed E band (60GHz), licensed E band (70-90GHz), and W band (75-110GHz) millimeter wave equipment by network application (access, backhaul, transport). The report tracks units, revenue, and ARPU and follows Aviat Networks, BridgeWave, CableFree, E-Band, ECI, Ericsson, Fujitsu, GigaBeam, Huawei, Intracom, LightPointe, Loea, NEC, Proxim, SIAE, Siklu, Sub10 Systems, and others.
To buy the reports, contact Infonetics: http://www.infonetics.com/contact.asp
