

Month: September 2015
China’s Subsidized Broadband Investments Boosts Growth in Global CPE Market (IHS & China State Council)
IHS-Infonetics raised its outlook for the broadband customer premises equipment (CPE) market, which includes DSL, cable, fiber-to-the-home (FTTH), residential gateways and mobile broadband CPE. In a September 2015 report, the firm noted it increased its 2019 worldwide broadband CPE forecast by 8 percent, to US$12.4 billion.
BROADBAND CPE MARKET HIGHLIGHTS:
- The big story this quarter is FTTH optical network terminals (ONTs) in China, unit shipments of which more than doubled year-over-year, from 9.8 million to over 20 million from 2Q14 to 2Q15
- In 2Q15, the global broadband CPE market grew 5 percent from the previous quarter, to $2.9 billion; unit shipments grew 11 percent, to 61 million
- Worldwide total broadband CPE revenue is up 7 percent from the year-ago second quarter, when it was just under $2.7 billion
- Quarter-over-quarter, from 1Q15 to 2Q15:
- DSL CPE unit shipments were down 1 percent to 23 million, with VDSL IADs posting the highest growth (+11 percent)
- Cable CPE units were up 1 percent to 11.6 million (90% of which were WiFi-enabled), with DOCSIS 3.0 modems posting the highest growth (+13 percent)
- Fixed LTE CPE shipments grew 4 percent
Analyst Comments:
“The primary source for raising our global broadband CPE forecast is the massive investment currently ongoing in China. Despite reported economic headwinds, the Chinese government continues to subsidize telco investments in fiber infrastructure to expand accessibility and throughput. The result is heavy spending on GPON and EPON ONTs,” said Jeff Heynen, research director for broadband access and pay TV at IHS.
“At the same time, the shift from fiber-to-the-building (FTTB) to FTTH architecture is well underway in China. A primary reason for this architectural shift is that FTTB plus ADSL take-rates at China Telecom have been disappointing; consumers aren’t interested in a connection that offers only a marginal improvement over what they already have. If they are to subscribe to a home broadband service, it needs to provide a minimum of 8MB to 10MB speeds,” Heynen said.

BROADBAND CPE REPORT SYNOPSIS:
The quarterly IHS Infonetics PON, FTTH, Cable, DSL, and Wireless Broadband CPE market research report tracks DSL, cable and FTTH CPE; mobile broadband routers; and residential gateways. The research service provides worldwide and regional market size, vendor market share, forecasts through 2019, analysis and trends. Companies tracked include Alcatel-Lucent, Arris, AVM, Cisco, Comtrend, D-Link, Dasan Networks, Fiberhome, Hitron, Huawei, Mitsubishi, Netgear, OF Networks, Pace, Sagemcom, SMC Networks, Sumitomo, Telsey, Technicolor, TP-Link, Ubee Interactive, Zhone, ZTE, ZyXel, and others.
To purchase the report, please visit www.infonetics.com/contact.asp
From a May 2015 BBC report titled China reveals ambitious broadband plan:
China is to accelerate the development of its high-speed broadband network to raise speeds but cut prices, its State Council has said. Fewer than half of the country’s population has internet access and those who do can often experience slow connections. The country’s premier also urged telecoms companies to cut fees, including data roaming charges. It was not revealed how much money would be invested.
Besides the government investment, Premier Li Keqiang also urged telecoms companies to cut their prices and up their speeds, according to China’s cabinet the State Council. He also said they should cut data roaming charges for Chinese tourists, although he acknowledged that it was ultimately for the market to decide. He did, however, announce a round of investment infrastructure improvements to the same end.
“China has more cell-phone users than any other country, but its internet service speed ranks below 80th in the world due to underdeveloped information infrastructure,” the premier said, according to a release from the State Council.
He added that “speeding up the construction of information infrastructure will boost investment and support” in China, as well as helping “mass innovation.”
Mr Li did not say how much investment would be needed, but officials have previously earmarked around 2tn yuan ($322bn, £204bn) to improve China’s broadband infrastructure by 2020.
China’s internet penetration rate was only 47.9% last year, with connectivity especially low in smaller cities and rural areas. This compares with about 75% of people in the United States. In the UK, 73% of households have broadband access, Ofcom said in December 2014.
The Chinese cabinet’s statement added that the nation would look to open up the telecoms market and encourage increased competition, including through expanding a pilot scheme for broadband services this year.
“There is still not enough competition, which has led to telecoms fees being relatively high while there is still a lot of room to improve the quality of service,” the statement said, citing an official at China’s official State Information Centre.
http://www.bbc.com/news/technology-32736199
IHS-Infonetics CABLE WEBINAR:
Join analyst Jeff Heynen Sept. 29 at 11:00 AM ET for Delivering Cable Services in the Cloud Era, a free, live event that examines how virtualization will impact the MSO network and takes a look at key residential and commercial offerings enabled by NFV and SDN. Register here.
Positive Verizon Commentary Masks Negative Implications from Spectrum Supply Shift, by David Dixon
by David Dixon, FBR & Co., edited by Alan J Weissberger (emphasis added in BOLD font)
We believe there is a supply shift in (cellular) capacity spectrum coupled with an increase in spectrum utilization beginning with 150MHz of 3.5GHz LTE spectrum to be auctioned by the FCC in late 2016.
Last week, Verizon CEO Lowell McAdam provided an update on the company’s thoughts on DISH spectrum. More specifically, CEO McAdam noted for the first time that he would be interested in leasing spectrum from DISH, but was also quick to point out that he is not interested in acquiring DISH for access to the spectrum. Many believe this opens the door for more dialogue with DISH that could lead to a deal, but we believe this is simply a wise, short-term insurance option exercised by Verizon as it develops the 3.5GHz ecosystem in parallel. Both Verizon and T-Mobile plan to deploy LTE-Unlicensed (LTE-U) and LTE Assisted Access (LAA) at 5GHz and our checks indicate solid interest in 3.5GHz spectrum for LAA or autonomous use for indoor capacity.
We believe urban network designs are changing and industrywide support of 3.5 GHz is moving quicker than expected, which should continue to weigh on DISH spectrum value.
■ 3.5 GHz support moving quickly. The FCC issued an Order in April 2015 where it proposed to introduce the 3.5 GHz band (currently occupied by the Department of Defense) to create a Citizens Broadband Radio Service (CBRS) with a three-tiered spectrum sharing system on 70MHz of the total 150MHz. Tier 1 access will be made available to radar systems for the U.S. Navy which currently uses this band. Tier 2 will be priority access licensees (PAL) which will likely be wireless carriers who will acquire 10 MHz licenses for a renewable short term through auction (in late 2016). PAL users will agree to protect government users from interference, but receive no protection from government users. Tier 3 provides general authorized access (GAA) to all public users, including carriers, enterprises, or unlicensed users, which suggests utilization will closely match the Wi-Fi ecosystem today. Our checks show the 3.5 GHz spectrum works and the ecosystem is developing very quickly with broad support from carriers and manufacturers of chipsets, handsets, and radios (i.e., T-Mobile US, Verizon, Alcatel, Nokia, Intel, Qualcomm, iconectiv (Ericsson), and Federated Wireless).
■ Deciphering VZ comments. While DISH spectrum is most aligned with VZ’s spectrum portfolio, we do not believe VZ views wholesale access to DISH spectrum as a long-term solution to capacity management. We think Verizon views a potential spectrum leasing deal with DISH as a nearterm spectrum insurance play as development, testing, and support for 3.5 GHz continues. VZ has been the most aggressive proponent of 3.5 GHz spectrum and is in the forefront of 4G small cell implementation amongst all carriers.
Important Information: FBR is the global brand for FBR & Co. and its subsidiaries.This report has been prepared by FBR Capital Markets & Co. (FBRC), a subsidiary of FBR & Co.FBRC is a broker-dealer registered with the SEC and member of FINRA, the NASDAQ Stock Market and the Securities Investor Protection Corporation (SIPC). The address for FBRC is 1300 North 17th Street Suite 1400, Arlington, VA 22209.All references to FBR & Co. mean FBR Capital Markets & Co. (FBRC) and its affiliates.
Company-Specific Disclosures: FBR acts as a market maker or liquidity provider for the company’s securities: DISH Network Corporation For up-to-date company disclosures including price charts, please click on the following link or paste URL in a web browser: www.fbr.com/disclosures.aspx
AT&T GigaPower coming to San Antonio where it will compete with Google Fiber
AT&T today named San Antonio as the fifth Texas city to receive its GigaPower gigabit service, which is a FTTH based version of it’s Uverse triple play service. The four other Texas cities to get GigaPower are: Austin, Ft. Worth, Dallas, and Houston. The service, which offers super high speed internet services, quick enough, according to the company, to download an entire movie in 36 seconds.
San Antonio Mayor Taylor announced in July that Google is deploying Google Fiber Internet service which competes head on with AT&Ts GigaPower.
Five things about AT&T GigaPower and how it relates to Google Fiber:
1. Both Google Fiber and AT&T offer speeds of up to one gigabit per second. That’s really, really fast. You can download 25 songs in one second, a high-definition television show in three seconds and a high-definition movie in 36 seconds, according to AT&T.
2. Gigabit speed in other cities costs about $70 per month for both Google Fiber and AT&T GigaPower.
3. San Antonio is the fifth market in Texas to get AT&T GigaPower. The service is already available in Dallas, Fort Worth, Houston and Austin. Nationwide, GigaPower is up and running in 15 markets, with four more on the way.
4. GigaPower will be available in San Antonio on Monday, September 28. Google Fiber is still planning its rollout of the 4,000 miles of fiber optic cable it will install throughout the city.
5. Although AT&T and Google Fiber have won headlines, neither are the first to offer gigabit speed Internet in San Antonio. Feisty little Grande Communications offered it earlier this year, but it’s only available in a few neighborhoods around San Antonio.
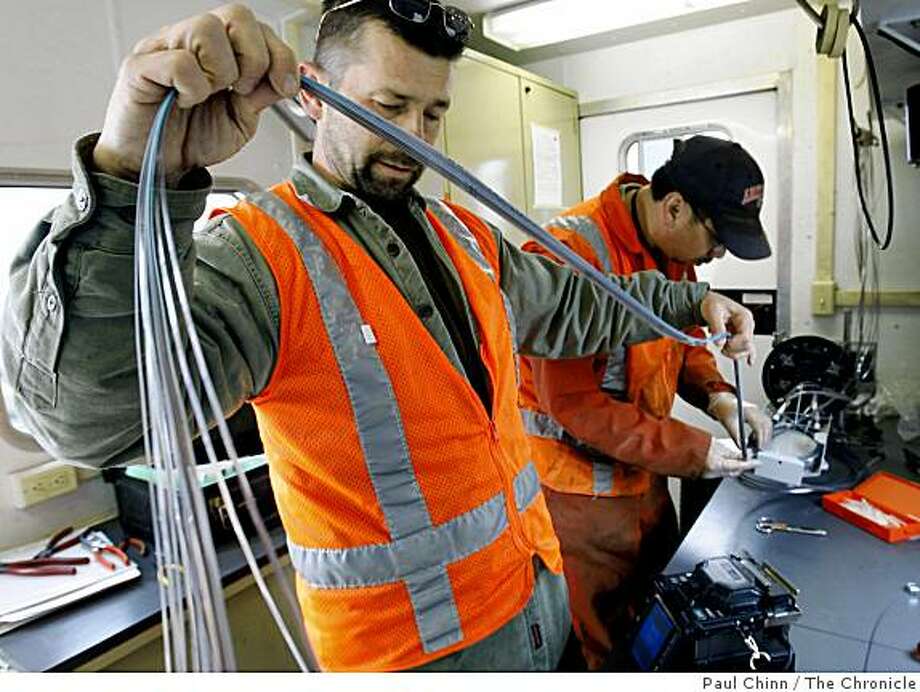
Caption for above Figure: AT&T Tech pulling Fiber cables
References:
http://www.sacurrent.com/Blogs/archives/2015/09/21/5-things-to-know-about-atandt-gigapower
http://www.ksat.com/news/att-gigapower-internet-coming-to-san-antonio
Title II Threatens US Broadband Investment according to US Telecom, others…
Last week, in a speech to the American Enterprise Institute, Federal Communications (FCC) Commissioner Ajit Pai said that the agency’s decision to impose utility-style regulation on broadband has slowed infrastructure investment and deployment, referencing recent capex research that showed a 12% decline in capital expenditures by major wireless companies during the first half of 2015.
According to USTelecom analysis for wireline, wireless and cable broadband providers, U.S. broadband providers invested $78 billion in network infrastructure in 2014, which was $14 billion, or 22%, greater than the $64 billion invested just five years ago in 2009. However, these surging investment levels have taken place during a period of light regulation. Now, with the FCC order to require broadband providers to follow Title II rules, numerous economic analyses forecast negative long-term consequences on investment, innovation and other long-term economic benefits.
On Sept 18, 2015, Tara Shields wrote in a TechZone360 blog post:
“The FCC can only be called “embattled” when it comes to the legal storm brewing around Net neutrality. It’s facing lawsuits from several broadband providers, and one of that group’s top industry associations argues that regulation of the world of the Internet will have a chilling effect on investment.”
“This policy shift is particularly unfortunate given that the nation and economy have reaped substantial benefits from broadband investment over the last couple of decades,” said Patrick Brogan, vice president of industry analysis at USTelecom, the industry association, in a blog. He added, “The recent FCC decision to reverse course and regulate broadband as a Title II utility risks dampening broadband investment, thereby slowing the pace of innovation over the long term. As USTelecom has written, the rules dampen expectations of long-term revenue growth, increase compliance costs, and increase the risk-adjusted cost of capital.”
Brogan added, “The U.S. approach to date has emphasized light regulation and investment in competing facilities rather than resale, leading to more facilities-based competition than most of the rest of the world.”
Continued wireline industry investment will be essential to network modernization and international competitiveness of course, to support demand for cloud computing and data centers, telework, video and audio streaming, video calling and conferencing, data analytics and other services based on the growing Internet of Things. Meanwhile, nearly all mobile broadband traffic depends on fixed network backhaul or offload onto Wi-Fi-enabled fixed networks. Thus, wireline providers are among the critical contributors to our nation’s innovative capacity.
FCC regulation threatens that, according to USTelecom and its members.
“While it is hard to isolate the impact of regulation among all relevant factors, and it takes time for a major regulatory shift to reveal the full extent of its market impact, at least one independent financial analysis predicts a 4.5 percent decline in wireline and wireless telecommunications services capital investment in 2015, excluding cable,” Brogan warned.
IHS Residential Gateway Survey Highlights + Softness in Cable Broadband Equipment Market to End Later This Year
DEFINITION & SURVEY:
Residential gateways (RGs) combine a DSL, FTTH, cable or 3G/LTE modem with routing and switching capabilities and a WiFi access point, and are increasingly used by service providers to deliver voice, data and video services. For example, this author has a RG for AT&T U-verse, which includes a VDSL modem, WiFi AP for home internet use, and a separate WiFi bridge/ private network for U-verse wireless receivers.
IHS-Infonetics conducted in-depth interviews with service providers across the globe who use residential gateways to provide broadband services and found that only 31% of respondents plan on virtualizing their residential gateways by 2017.
RESIDENTIAL GATEWAY SURVEY HIGHLIGHTS:
- 75% of respondents currently offer Gigabit Ethernet connections on residential gateways, growing to 88% in 2016.
- Among the wireless interfaces IHS asked about, 802.11ac shows the most growth, with 69 percent of respondents saying they plan to include it in their residential gateways by next year.
- Consistent with last year’s findings, Arris topped the list of perceived top residential gateway vendors, followed once again by Pace.
Analyst Quotes:
“Despite the obvious benefits of virtualizing residential gateways in the home-namely shortening of provisioning time and elimination of truck rolls-our survey respondents aren’t completely convinced it’s something they will implement in the next couple of years. Nearly 70 percent said they weren’t planning on doing so or didn’t know if they would be virtualizing their gateways by 2017,” said Jeff Heynen, research director for broadband access and pay TV at IHS.
“Unlike the data center, where virtualization has been in place for some time, it will take longer for service providers to virtualize their residential access networks and CPE,” Heynen said.

SURVEY SYNOPSIS:
The 25-page 2015 “IHS Infonetics Residential Gateway Strategies and Vendor Leadership: Global Service Provider Survey” captures service providers’ strategies for deploying residential gateways and delves into which applications will be the primary drivers for residential gateway deployments. The study also covers service provider opinions of manufacturers including Actiontec, Alcatel-Lucent, Arris/Motorola, Comtrend, D Link, FiberHome, Huawei, Netgear, Pace, Technicolor, ZTE, ZyXel, and others.
Separately, IHS Infonetics said that softness in cable broadband equipment spending seen in the first quarter of 2015 continued into the second, with global revenue dipping 2 percent quarter-over-quarter, according to IHS. Traditionally, the second quarter has been a very good one for cable broadband expenditures.
“Right now, the cable broadband market is like seeing the forest for the trees. The second quarter of the year was slower, but looking at year-over-year revenue comparisons, the market grew by double digits. There’s no question that the continued rollout of 100Mbps+ services via DOCSIS 3.0 today and DOCSIS 3.1 later this year will continue to drive the market forward. There are committed initiatives in place at Comcast and Liberty Global, with others certain to follow as the year progresses,” said Jeff Heynen, research director for broadband access and pay TV at IHS.
In an email, Mr. Heynen wrote to this author: “First, let’s make sure we are talking specifically about the cable broadband CPE market only (DOCSIS modems, etc.) and not the CMTS/CCAP business, which is network infrastructure. If we are comparing revenue for just DOCSIS CPE (no set-top boxes), then pre-Motorola ARRIS had around a 20-25% market share in terms of global revenue, compared with Cisco’s 15-20%. Once ARRIS gobbled up Motorola Home, its global revenue share jumped to 35-40%, while Cisco’s stayed at roughly 15%.”
Author’s Note on Arris:
In an email, Kim Howard, IHS-Infonetics Marketing Manager (and this author’s principal contact at the firm) wrote:
“We’ve been tracking ARRIS for as long as I can remember. The report I looked at goes back only to 2005, but we have older data too. At that time, ARRIS’s cable broadband equipment revenue was only about a quarter of Cisco’s, but then they pulled ahead of Cisco in 2009 by a bit.”
From an April 13, 2010 Forbes article:
“Time Warner Cable and Comcast have increased their business offerings through Arris. Arris has upgraded its modems to the latest DOCSIS 3.0 technology which supports higher broadband speeds up to 100 Mbps. Cable operators like Comcast and Time Warner Cable are now offering higher broadband speeds through Arris modems.”
In April 2013, Google sold its Motorola Home business to Arris. (Google later sold it’s Motorola mobile handset business to Lenovo). Motorola Home covers cable TV modems/set top boxes and internet devices, which combined with Arris’ existing businesses creates what it’s calling “the Premier Video Delivery and Broadband Technology Company.”
In a June 10, 2015 report IHS-Infonetics said “ARRIS dominated the cable broadband market again in 1Q2015, supported in part by the early availability of its E6000 CCAP-capable product.”
CABLE BROADBAND MARKET HIGHLIGHTS:
- Global CCAP, CMTS, CMC and edge QAM revenue totaled $465 million in 2Q15
- In the key North American market, DOCSIS channel shipments were down 25 percent sequentially in 2Q15 after increasing 13 percent in 1Q15; revenue was also down 19 percent due to a slowdown among a handful of larger operators
- Coax media converters are being used in emerging markets, particularly China and Southeast Asia, to provide lower-cost C-DOCSIS services to multiple dwelling units; IHS expects this trend to continue through at least 2019
- Thanks to the early availability of its CCAP-capable product, Arris dominated the cable broadband market once again in Q2, capturing over half of worldwide revenue

To purchase any of the IHS-Infonetics reports, please visit www.infonetics.com/contact.asp
WEBINAR: CABLE SERVICES IN THE CLOUD ERA
Join Jeff Heynen Sept. 29 at 11:00 AM ET for Delivering Cable Services in the Cloud Era, an event examining how virtualization will impact the MSO network and looking at key residential and commercial offerings enabled by NFV and SDN. Register here.
IHS-Infonetics: Mobile Infrastructure Market= $11.4 Billion in Q2; Maturing Market ROI; Ericsson Outlook
Overview:
Driven by strong 3G W-CDMA capacity projects in EMEA and unabated LTE activity in China, the global macrocell mobile infrastructure market was up 2 percent in the 2nd quarter of 2015 (2Q15) from the prior quarter, and up 2 percent year-over-year, according to the IHS Infonetics Mobile Infrastructure Equipment report from IHS (NYSE: IHS).
“This time around, W-CDMA alone pulled the 2G/3G market out of the dumps and contributed to the growth of the whole mobile infrastructure market. Substantial 3G deployments took place in Brazil, India, the Middle East, Myanmar, Thailand and Vietnam,” said Stéphane Téral, research director for mobile infrastructure and carrier economics at IHS.
“Brazil kicked off a massive 2G GSM to 3G W-CDMA migration, and Thailand has ordered mobile operators to shut down their GSM network to re-use the spectrum for LTE,” Téral said.
MOBILE INFRASTRUCTURE MARKET HIGHLIGHTS:
- In 2Q15, the worldwide macrocell mobile infrastructure market totaled $11.4 billion
- LTE revenue was essentially flat (+1 percent) in 2Q15 from 1Q15, but grew 10 percent from the year-ago 2nd quarter
- IHS believes LTE will peak at $23 billion in 2015 and then start to decline as a result of diminishing rollouts worldwide
- 422 commercial LTE networks have been launched as of July 2015, 363 of which are of the FDD (frequency division duplex) variety
- Ericsson and Huawei share the LTE infrastructure market share lead in 2Q15, each claiming just over 20 percent
- Mobile infrastructure software is forecast by IHS to grow at a 5-year (2014–2019) compound annual growth rate of 8 percent

MOBILE INFRASTRUCTURE REPORT SYNOPSIS:
The quarterly IHS Infonetics Mobile Infrastructure Equipment market research report tracks more than 50 categories of equipment, software and subscribers based on all existing generations of wireless network technology, including radio access networks (RANs), base transceiver stations (BTSs), mobile softswitching, packet core equipment and E-UTRAN macrocells. The research service provides worldwide and regional market size, vendor market share, forecasts through 2019, deployment trackers, in-depth analysis and trends. Vendors tracked include Alcatel-Lucent, Cisco, Datang Mobile, Ericsson, Fujitsu, Genband, HP, Huawei, NEC, Nokia Networks, Samsung, ZTE, others.
To buy the report, contact Infonetics: www.infonetics.com/contact.asp
CLOUD RAN WEBINAR:
Join analyst Stéphane Téral Sept. 15 at 11:00 AM ET for How to Achieve Full-Blown Cloud RAN, an event exploring the benefits and challenges operators can expect to encounter on the road to a full-blown cloud RAN architecture. Register here.
RELATED RESEARCH:
- Good News for Mobile Networks in Large Venues: Carriers Adding More DAS
- 5G Hype Aside, True 4G Is Finally Materializing, Says IHS
- Mobile Services Market Dragged by Europe Again
- Operators Spent $67B Outsourcing Network Tasks in 2014
- LTE Peaking at $6 Billion a Quarter – Not Enough to Offset 2G/3G Decline
- Mobile Operators Using EDGE, HSPA+ to Improve User Experience on Road to LTE
Mobile Infrastructure Equipment Market:
The latest report from telecoms research firm Dell’Oro Group (July 2015) forecasts a 2% annual decline in the global mobile infrastructure market between 2014 and 2019.
What are the reasons behind this decline? Firstly, large-scale rollouts of LTE networks in the US and China, the world’s two biggest economies, are coming to an end. In China, operator rollouts of LTE are reaching their peak. Meanwhile, in the US, both Verizon and AT&T have announced their intention to slow down their capital spending after years of intense LTE investment.
Regardless of the rate at which data consumption is growing, CAPEX investment by operators is projected to grow globally at just 1% between 2013 and 2019, with most of this growth coming from emerging markets. In contrast, mature markets such as North America and Western Europe have already slowed to a halt and show negative CAPEX growth for this period.
Revenue trends for the period also highlight the problem for operators to monetize data. Globally, revenues are set to only grow by 1.6% annually up to 2019: once again, it will be emerging markets, and not mature ones, that will deliver this growth (source: Ericsson). This is a clear sign that mobile broadband (like voice before it) is on course to become a commoditised service that offers operators only limited opportunities for differentiation.
A maturing market with limited ROI:
It’s therefore high time to acknowledge that the network equipment market, after almost thirty years, has transformed from a fast-moving, high-growth emerging sector into an established mature market that delivers much lower returns.
The explanation for this is quite simple. Thirty years ago we had no mobile subscriptions and no mobile networks: today we have 7.1 billion mobile subscriptions worldwide and networks that cover 90% of the world’s population.
The success of the mobile industry was built with investment money attracted by the promise of lucrative growth prospects. In those early days, telecoms vendors made a fortune selling expensive infrastructure equipment for operators to build their networks.
However, those days are at an end: technology advances means that today, every node in the network not only costs just 10-20% of what it did 15 years ago, but can also handle 100x more network traffic.
With 90% of the world now covered by mobile networks, new rollouts are also coming to an end. Operators simply have no need to continue building out their macro networks at the same rate and scale as previous years.
Installing new infrastructure – for example, to deliver better coverage in rural areas: or to improve indoor coverage levels – is expensive and delivers only limited returns. Add in the paradox of the sharp rise in data traffic versus flat revenues for operators, and it’s easy to understand why operators are struggling to find new ways to boost margins and deliver growth.It’s this quest for better margins and an uptick in growth that explains the current trend for operator consolidation and the popularity of network-sharing deals. Of course, for equipment providers, these developments mean that their operator customer base is actually now shrinking.
From standardisation to commoditization:
Today’s global mobile telecoms sector could never have achieved the growth and the success it has without standardisation in the industry. This was vital in the early days in order to build a truly international market. Today, however, standardisation serves vendors rather less well. Infrastructure equipment has become a standardised commodity where large scale is all that matters. As a result, we now only have three global vendors competing in a market of ever-decreasing margins and returns.
http://telecoms.com/opinion/telecoms-vendors-reach-their-moment-of-truth/
Ericsson Outlook:
Ericsson has long been a leader in the global mobile infrastructure market, holding a market share of over 30%. However, its share has declined over the past three years due to a technology shift from CDMA to 3G-4G/LTE and growing competition from lower cost China vendors Huawei and ZTE. The company’s mobile infrastructure equipment revenues have been down 6% since 2011, and this trend is expected to continue in the near future, with the Nokia-Alcatel Lucent merger emerging as a threat in the U.S. and Huawei presenting a serious challenge in Europe.
Ericsson has an operating margin of 6-8% on equipment sales. It’s also currently undertaking yet another cost reduction program. The company is looking to build its capacity in the LTE equipment domain, mainly in markets such as India and China, where the LTE presence is still limited. While the technology shift from CDMA/2G/WCDMA to 3G-4G/LTE has negatively impacted Ericsson, the company is not dwelling much on its dominance in the older CDMA domain. Instead, it is evolving with the market, investing in research and development (R&D) related to 4G/LTE and 5G technologies.
Networking Highlights from 2015 Hot Interconnects Conference: Aug 26-28, 2015
Introduction:
The always excellent Hot Interconnects 2015 conference was held in Santa Clara, CA, August 26-28, 2015. This article summarizes presentations and a panel session relevant to Data Center and Wide Area Networking.
Facebook Panel Participation & Intra- DC invited talk by Katharine Schmidtke:
A 90 minute panel session on “HPC vs. Data Center Networks” raised more questions than it answered. While comprehensively covering that panel is beyond the scope of this article, we highlight a few takeaways and the comments and observations made by Facebook’s Katharine Schmidtke, PhD.
- According to Mellanox and Intel panelists, InfiniBand is used to interconnect equipment in HPC environments, but ALSO in large DC networks where extremely low latency is required. We had thought that 100% of DCs used 1G/10G/40G/100G Ethernet to connect compute servers to switches and switches to each other. That might be closer to 90 or 95%, with InfiniBand and proprietary connections making up the rest.
- Another takeaway was that ~80 to 90% of cloud DC traffic is now East-West (server to server via a switch/router) instead of North-South (server to switch or switch to server) as it had been for many years.
- Katharine Schmidtke, PhD talked about Facebook’s intra DC optical network strategy. Katharine is responsible for Optical Technology strategy at Facebook. [She received a PhD in non-linear optics from Southampton University in the UK and did post doctoral work at Stanford University.]
- There are multiple FB DCs within each region.
- Approximately 83% of active daily FB users reside outside the US and Canada.
- Connections between DCs are called Data Center Interconnects (DCIs). There’s more traffic within a FB DC than in a DCI.
- Fabric, first revealed last November, is the next-generation Facebook DC network. It’s a single high-performance network, instead of a hierarchically oversubscribed system of clusters.
- Wedge, also introduced in 2014, is a Top of Rack (ToR) Switch with 16 to 32 each 40G Ethernet ports. It was described as the first building block for FB disaggregatedswitching technology. Its design was the first “open hardware switch” spec contribution to the Open Compute Project (OCP) at their 2015 annual meeting. Facebook also announced at that same OCP meeting that it’s opening its central library of FBOSS – the software behind Wedge.
- Katharine said FB was in the process of moving from Multi-Mode Fiber (MMF) to Single Mode Fiber (SMF) for use within its DC networks, even though SMF has been used almost exclusively for telco networks with much larger reach/distance requirements. She said CWDM4 over duplex SMF was being implemented in FB’s DC networks (more details in next section).
- In answer to a question, Katherine said FB had no need for (photonic) optical switching.
Facebook Network Architecture & Impact on Interconnects:
FB’s newest DC, which went on-line Nov 14, 2014, is in Altoona, IA, which is just north of Interstate Highway 80. It’s a huge nondescript building which is 476K square feet in area. It’s cooled using outside air, uses 100% renewable energy and is very energy-efficient in terms of overall power consumption (more on “power as pain point” below). Connectivity between DC switches is via 40G Ethernet over MMF in the “data hall.”
Fabric (see above description) has been deployed in the Altoona DC. Because it “dis-aggregates” (i.e. breaks down) functional blocks into smaller modules or components, Fabric results in MORE INTERCONNECTS than in previous DC architectures.
As noted in the previous section, FB has DCs in five (soon to be seven) geographic regions, with multiple DCs per region.
100G Ethernet switching, using QSFP281 (Quad Small Form-factor Pluggable) optical transceivers, will be deployed in 2016, according to Katharine. The regions or DCs to be upgraded to 100G speeds were not disclosed.
Note 1. The QSFP28 form factor is the same footprint as the 40G QSFP+.The “Q” stands for “Quad.” Just as the 40G QSFP+ is implemented using four 10-Gbps lanes or paths, the 100G QSFP28 is implemented with four x 25-Gbps lanes or paths.
Cost efficient SMF optics is expected to drive the price down to $1/Gbit/sec very soon. SMF was said to be “future proofing” FB’s intra DC network2, in terms of both future cost and ease of installation. The company only needs a maximum reach of 500m within any given DC, even though SMF is spec’d at 2km. Besides reach, FB relaxed other optical module requirements like temperature and lifetime/reliability. A “very rapid innovation cycle” is expected, Katharine said.
Note 2. Facebook’s decision to use SMF was the result of an internal optical interconnects study. The FB study considered multiple options to deliver greater bandwidth at the lowest possible cost for its rapidly growing DCs. The 100G SMF spec is primarily for telcos as it supports both 10Km and 2Km distances between optical transceivers. That’s certainly greater reach than needed within any given DC. FB will use the 2Km variant of the SMF spec, but only up to 500m. “If you are at the edge of optical technology, relaxing just a little brings down your cost considerably,” Dr. Schmidtke said.
A graph presented by Dr. Schmidtke, and shown in EE Times, illustrates that SMF cost is expected to drop sharply from 2016-to-2022. Facebook intends to move the optical industry to new cost points using SMF with compatible optical transceivers within its DCs. The SMF can also be depreciated over many years, Katharine said.
FB’s deployed optical transceivers will support Coarse Wavelength Division Multiplexing 4 (CWDM4) Multi-Source Agreement over duplex SMF. CWDM4 is a spec for 4 x 25G Ethernet modules and is supported by vendors such as Avago, Finisar, JDSU, Oclaro and Sumitomo Electric.
CWDM4 over duplex SMF was positioned by Katharine as “a new design and business approach” that drives innovation, not iteration. “Networking at scale drives high volume, 100s of thousands of fast (optical) transceivers per DC,” she said.
Other interesting points in answer to audience questions:
- Patch panels (which interconnect the fibers) make up a large part of Intra DC optical network system cost. For more on this topic, here’s a useful guide to fiber optics and premises cabling.
- Power consumed in switches and servers can’t keep scaling up with bandwidth consumption. For example, if you double the bandwidth, you CAN’T double the power consumed! Therefore, it’s critically important to hold the power footprint constant as the bandwidth is increased.
- More power is consumed by the Ethernet switch chip than an optical transceiver module.
- Supplying large amounts of power into a mega DC is the main pain point for the DC owner (in addition to the cost of electricity/power there are significant cooling costs as well).
- FB is planning to move fast to 100G (in 2016) and to 400G Ethernet networks beyond that time-frame. There may be a “stop over” at 200G before 400G is ready for commercial deployment, Katharine said in answer to a question from this author.
Recent Advances in Machine Learning and their Application to Networking, David Meyer of Brocade:
This excellent keynote speech by David Meyer, CTO & Chief Scientist at Brocade, was very refreshing. It demonstrated that real research is being done by a Silicon Valley company other than Google!
Machine learning currently spans a wide variety of applications, including perceptual tasks such as image search, object and scene recognition and captioning, voice and natural language (speech) recognition and generation, self-driving cars and automated assistants such as Siri, as well as various engineering, financial, medical and scientific applications. However, almost none of this applied research has spilled over into the networking space. David believes there’s a huge opportunity there, especially in predicting incipient network node/link failures. He also talked about Machine Learning (ML) tools for DevOps/ network operations (see below).
- OpenConfig (started by Google) aims to specify a vendor neutral/independent configuration management system. That management system has a big ML component from a telemetry configuration model.
- OPNFV consortium is specifying Operating System components to realize a Network Function Virtualization (NFV) system. There’s a Predictor module that includes an intelligence training system.
- One can envision a network as a huge collection of sensors that form a multi-dimensional vector space. The data collected is ideal for analysis/learning via deep neural networks.
- There are predictive and reactive roles for ML in network management and control.
- “We are at the beginning of a network intelligence revolution,” David said.
- ML tools for DevOps: domain knowledge is needed from an analytics platform, which should include a recommendation system.
- Application profiling was cited as an example to build tools for a DevOps environment: 1] Predict congestion for a given application. 2] Correlate with queue length to avoid dropped packets. 3] Anomaly detection of a pattern that doesn’t conform to expected behavior (if that behavior can be defined?)
Future of ML – What’s Next:
- Deep neural nets that learn computation functions.
- More emphasis on control- analyze sophisticated time series.
- Long range dependencies via reinforcement learning.
- Will apply to compute, storage, network, sensors, and energy management.
- Huge application in networking will be predictive failure analysis (and re-route BEFORE the failure actually occurs).
3. Software Defined WANs- a tutorial by Inder Monga of ESnet & Srini Seetharaman of Infinera
This was a terrific “tag team” lecture/discussion by Inder & Srini who alternated describing each slide/diagram. We present selected highlights below.
Inder summarized many fundamental problems in all facets of WANs:
- Agility requirements are not met for WAN provisioning (sometimes takes days or weeks to provision a new circuit or IP-MPLS VPN)
- Traditional wide-area networking is inflexible, opaque and expensive
- WAN resources are not efficiently utilized (over-provisioning prevails)
- Interoperability issues across vendors, layers and domains reduces chance of automation
- Hard to support new value propositions, like: Route selection at enterprises, Dynamic peering at exchanges, Auto bandwidth and bandwidth calendaring, Mapping elephant (very large) data flows to different Flexi-Grid channels
Srini commented that the Network Virtualization (NV)/ overlay model has more market traction than the pure SDN/Open Flow model.
Overlay networks run as independent virtual networks on top of a (real) physical network infrastructure. These virtual network overlays allow cloud service and DC providers to provision and orchestrate networks alongside other virtual resources (like compute servers). They also offer a new path to converged networks and programability. However, network overlays shouldn’t be confused with “pure SDN” which doesn’t permit overlays or network virtualization. [We’ve previously described both of these “SDN” approaches in multiple articles at viodi.comand techblog.comsoc.org]
Several vendors provide NV software on compute servers running in DCs (e.g. VMWare, Nuage Networks, Juniper, etc). They support VxLAN for tunneling L2 frames withing a DC network (in lieu of VLANs) and then map VxLAN frames to IP-MPLS packets for inter DC transport. However, none of those NV software vendor’s inter-operate with other vendors on an end to end basis. That confirms again that at least the NV version of SDN is not really “open,” as the same vendor’s NV software must be used on the compute servers.
Gartner Group finds that SDN in general (including all the myriad versions, twists and tweaks), is approaching the bottom of the “trough of disillusionment” after falling hard from the peak of inflated expectations that was built up due to all the hype and BS. This is illustrated in the graph below:

Image courtesy of Gartner
It’s interesting to note that SD- WANs, which have a much broader connotation than SDN for WANs, continue to ramp up the innovation trigger curve. They’ve yet to reach their peak of excitement and/or hype. White box switches, which we think is the future of true open networking, is on the downward path towards disillusionment, according to Gartner.
We totally disagree as we see years of tremendous potential ahead for open networking software running on bare metal switches (made by ODMs in China and Taiwan).
In closing, we note that National Research & Education Networks (NRENs) have deployed an East-West interface for multi-domain SDN – something we’ve screamed was missing from ONF specified SDN specs for a long time! Please refer to Dan Pitt’s remarks on that topic during my interview with him at the 2015 Open Networking Summit.
The NREN East-West/multi-domain interface is evidently based on a Network Services Interface (NSI) spec from the Open Grid Forum.
The OGF- NSI document Introduction states:
“NSI is designed to support the creation of circuits (called Connections in NSI) that transit several networks managed by different providers. Traditional models of circuit services and control planes adopt a single very tightly defined data plane technology, and then hard code these service attributes into the control plane protocols. Multi-domain services need to be employed over heterogeneous data plane technologies.”
Kuddos to Inder and Srini for looking through all the marketing hype, identifying WAN problems and some potential solutions that might be solved by new software. The one that I’m most enthusiastic about is theOpenConfig project (described above in the Machine Learning section) for vendor neutral configuration. It’s purpose and functions are described in this tutorial article.
References:
http://viodi.com/2015/09/03/2015-hot-interconnects-summary-part-i-oracle…
http://viodi.com/2015/09/02/2015-hot-interconnects-summary-part-ii-huawe…
