

LightCounting’s 3Q 2017 Optical Market Update + China’s Optical Network Comeback?
I. Light Counting’s 3Q2017 Market Update:
In its newly released “December 2017 Quarterly Market Update” LightCounting LLC states that demand for optical communications technology in 3Q 2017 followed what has been a year-long trend: Telecom/network service provider spending declined year-on-year while data center operators increased their investments in fiber optic infrastructure.
The decline in telecom optical network spending hit the optical components segment hardest, but was negative for vendors selling to telcos which can be seen from the chart below:

In 3Q 2017, data center use of optical communications technology was considerably more than that of telecom/network service providers.
Source: LightCounting LLC
…………………………………………………………………………………………………………..
Chinese carriers (see companion piece below) followed through on their announced plans to trim spending. LightCounting reports that China Telecom will continue to cut capex in 2018. Elsewhere in the world, only Orange looks like it will spend more this year than last among LightCounting’s list of top 15 telecom service providers.
Upticks in 100G DWDM transponders and WSS module sales paled in comparison to the declines experienced in the FTTx and wireless front haul markets, both sequentially and annually (see “Demand for FTTx, wireless optics declines from 2016: LightCounting”).
LightCounting says that check-ins with semiconductor vendors such as Analog Devices, Qualcomm, and Xilinx revealed increased activity in wireless/cellular communications, including 4.5G and 5G projects. This information leads the market research firm to expect initial commercial deployments of next generation wireless technologies in 2018, which in turn should boost the demand for optical front haul technology.
Optical vendors with exposure to the data center and internet content provider markets fared better than long haul/DWDM vendors. For example, Alibaba, Facebook, and Google increased their infrastructure spends by 142%, 62% and 39%, respectively, leading to overall spending records in the space during the quarter. Facebook plans to double capex in 2018, leading to hopes that data center optical spending growth is sustainable.
Optical transceiver vendors benefited during the quarter, which Applied Optoelectronics seeing a 27% increase in revenues and Innolight a 94% boom versus 3Q16. Shipments of PSM4 and CWDM4 100GbE modules set records during the quarter. However, 100GBASE-LR4 QSFP28 optical transceiver demand in the third quarter of 2017 proved softer than LightCounting expected.
…………………………………………………………………………………………………………….
LightCounting LLC says:
Our analysis is based on confidential sales data provided by leading suppliers and offers a unique port-based view of the industry.
References:
https://www.lightcounting.com/News_121317.cfm
https://www.futuremarketinsights.com/reports/optical-networking-market
…………………………………………………………………………………..
II. China’s Optical Market Comeback (via Barron’s on-line), by Tiernan Ray
China’s optical fiber market is coming back, but slowly, according to a note this morning from Rosenblatt Securities analyst Jun Zhang, who follows shares of laser vendor Oclaro, Acacia Communications, Applied Optoelectronics, and other vendors.
“Demand in China is stabilizing and slightly improving,” writes Zhang, “but we do not see a broad acceleration in China’s recovery yet.
“Chinese vendors recently concluded 2018 component and module procure- ments. Therefore, optical module and component suppliers should have base- line procurement contracts from Chinese vendors for 2018.”
The tricky part, indicates Zhang, is that Chinese buyers of components are increasingly coming up with their own internal components, which is going to dent some of the demand:
Instead of over promising volume to suppliers, we believe Chinese vendors offered baseline procurement volume estimates for 2018. Additionally, we believe these current procurement forecasts do not include any upside from initial 5G deployments in 2H18. However, line and client side module procurements from Chinese vendors are all down YoY due to internal sourcing. Therefore, due to conservative forecasts and increasing competition in the module market, most optical suppliers will likely continue to speak conservatively on China demand.
Zhang goes through what to expect, and it’s quite a mixed bag for various different vendors:
As we expected, ZTE is attempting to increase its internal sourcing for line side CFP2 DCO modules in 2018. Therefore, Acacia’s business could be negatively impacted in 2018 by ZTE. On the other hand, we believe there’s a chance Acacia can qualify at Huawei for DSP in 2018, but we see no signs yet. Intel’s CWDM4 has been qualified at Facebook and could have a sizeable market share, similar to the share size we expect InnoLight to also have at Facebook in 2018. However, Applied Optoelectronics shares are down significantly at Facebook in 2018 likely putting its CQ4 guidance at risk […]
NeoPhotonics could be up YoY, Lumentum flat YoY, Oclaro down slightly YoY, and Acacia down YoY. We also estimate Huawei and ZTE’s 100G ports to grow to 150K and 35K from 130K and 45K, respectively, in 2018. FiberHome recently saw a large share gain at China Unicom and we expect it to double its 100G port shipments in 2018 from a small basis.
FCC Votes to Reverse Net Neutrality & No Longer Regulate Broadband Internet Services
Overview:
By a 3 to 2 vote along party lines, the Federal Communications Commission (FCC) voted on Thursday to dismantle landmark rules regulating the businesses that connect consumers to the internet, granting broadband ISPs the power to potentially reshape Americans’ online experiences. The agency scrapped the so-called net neutrality regulations that prohibited broadband providers from blocking websites or charging for higher-quality service or certain content. The federal government will also no longer regulate high-speed internet delivery as if it were a utility, like phone service. The upshot is that the “Restoring Internet Freedom” order passed today, removes the FCC as a regulator of the broadband industry and relegates rules that prevented blocking and throttling content to the honor system.
That means a consumer or business is helpless if they have a complaint against an ISP or broadband service provider although there’s lip service saying that “the FCC and FTC will securely share consumer complaints pertaining to the subject matter of the Internet Freedom Order’s requirements to the extent feasible…….” FTC enforcement action is mentioned, but from our experience the FTC does nothing when it receives a complaint! They don’t even contact the business you’re complaining about (like the BBB does).
From the FCC’s Memorandum of Understanding (bold font added– see other FCC.gov references below):
(1) Pursuant to the FCC’s authority under the Communications Act of 1934, as amended, on December 14, 2017, the FCC adopted a Declaratory Ruling, Report and Order, and Order in the proceeding Restoring Internet Freedom, WC Docket No. 17-108, Declaratory Ruling, Report and Order, Order, FCC 17-166 (Dec. 14, 2017) (“Internet Freedom Order”), which, in principal part, restores broadband Internet access service to its Title I information service classification,reinstates the private mobile service classification of mobile broadband Internet access service, and returns to the Transparency Rule the FCC adopted in 2010 with certain limited modifications to promote additional transparency. As authority for the Transparency Rule, the FCC relies on Section 257 of the Communications Act, among other provisions, which requires the FCC to identify and eliminate market entry barriers for entrepreneurs and other small businesses in the provision and ownership of telecommunications services and information services and to report to Congress on how such marketplace barriers have been addressed by regulation or could be addressed by recommended statutory changes; and
(2) Congress has directed the FTC to, among other things, prevent unfair methods of competition and unfair or deceptive acts or practices in or affecting commerce under Section 5 of the Federal Trade Commission Act, 15 U.S.C. § 45, and has charged the FTC with enforcing a number of other specific rules and statutes.
Therefore, it is agreed that:
1. Consistent with its jurisdiction and to fulfill its duties under Section 257 of the Communications Act, among other provisions, the FCC will monitor the broadband market and identify market entry barriers by, among other activities, reviewing informal complaints filed by consumers, and will investigate and take enforcement action as appropriate with respect to failures by an Internet service provider to comply, in whole or in part, with the Internet Freedom Order’s requirements to file with the FCC or display on a publicly available, easily accessible website the specified subjects of disclosure.
2. Consistent with its jurisdiction, the FTC will investigate and take enforcement action as appropriate against Internet service providers for unfair, deceptive, or otherwise unlawful acts or practices, including but not limited to, actions pertaining to the accuracy of the disclosures such providers make pursuant to the Internet Freedom Order’s requirements, as well as their marketing, advertising, and promotional activities.
3. Consistent with each agency’s jurisdiction and to maximize the resources of each agency, at the regular coordination meeting established by the Agencies’ 2015 Memorandum of Understanding, the Agencies will discuss potential investigations against Internet Service Providers that could arise under each agency’s jurisdiction, and coordinate such activities to promote consistency in law enforcement and to prevent duplicate or conflicting actions, to the extent appropriate and consistent with law.
4. To further support coordination and cooperation on these matters, the Agencies will continue to work together to protect consumers, including through:
• Consultation on investigations or enforcement actions that implicate the jurisdiction of the other agency;
• Sharing of relevant investigative techniques and tools, intelligence, technical and legal expertise, and best practices in response to reasonable requests for such assistance from either Agency; and
• Collaboration on consumer and industry outreach and education efforts, as appropriate.
5. The FCC and FTC will securely share consumer complaints pertaining to the subject matter of the Internet Freedom Order’s requirements to the extent feasible and subject to the Agencies’ requirements and policies governing, among other things, the protection of confidential, personally identifiable, or nonpublic information.
6. The Agencies may coordinate and cooperate to develop guidance to assist consumers’ understanding of Internet service provider practices.
7. In seeking to encourage and facilitate the enforcement of applicable law, the Agencies recognize that decisions by one agency to take or withhold action are not, except by operation of law, binding on or intended to restrict action by the other agency.
8. To ensure the effective exchange of information between the Agencies, the persons signing below and their successors shall be deemed Designated Liaison Officers to serve as the primary sources of contact for each agency. Formal meetings between appropriate senior officials of both Agencies to exchange views on matters of common interest and responsibility shall be held from time to time, as determined to be necessary by such liaison officers…..blah, blah, blah!
……………………………………………………………………………………………………………………………………………………………….
Analysis:
The action reversed the agency’s 2015 decision, during the Obama administration, to better protect Americans as they have migrated to the internet for most communications. It will take a couple of weeks for the changes go into effect, but groups opposed to the action have already announced plans to sue the agency to restore the net neutrality regulations. Those suits could take many months to be resolved.
FCC chairman Ajit Pai said the rollback of the rules would eventually help consumers because broadband providers like AT&T and Comcast could offer people a wider variety of service options. We are helping consumers and promoting competition,” Mr. Pai said in a speech before the vote. “Broadband providers will have more incentive to build networks, especially to under-served areas.” We think that’s disingenuous nonsense!
The discarding of net neutrality regulations is the most significant and controversial action by the F.C.C. under Mr. Pai. In his first 11 months as chairman, he has lifted media ownership limits, eased caps on how much broadband providers can charge business customers and cut back on a low-income broadband program that was slated to be expanded to nationwide carriers.
His plan for the net neutrality rules, first outlined early this year, set off a flurry of opposition. Critics of the changes say that consumers may have more difficulty finding content online and that start-ups will have to pay to reach consumers. In the past week, there have been hundreds of protests across the country, and many websites have encouraged users to speak up against the repeal. After the vote, numerous groups said they planned to file a lawsuit challenging the change.
As expected, the five FCC commissioners were fiercely divided along party lines. In front of a room packed with reporters and television cameras from the major TV networks, the two Democratic commissioners warned of consumer harms to come from the changes.
Mignon Clyburn, one of the Democratic commissioners, presented two accordion folders full of letters in protest to the changes, and accused the three Republican commissioners of defying the wishes of millions of Americans. “I dissent, because I am among the millions outraged,” said Ms. Clyburn. “Outraged, because the F.C.C. pulls its own teeth, abdicating responsibility to protect the nation’s broadband consumers.”
“I dissent from this rash decision to roll back net neutrality rules,” said FCC Commissioner Rosenworcel. “I dissent from the corrupt process that has brought us to this point. And I dissent from the contempt this agency has shown our citizens in pursuing this path today. This decision puts the Federal Communications Commission on the wrong side of history, the wrong side of the law, and the wrong side of the American public.”
On the other hand, Brendan Carr, a Republican FCC commissioner, said it was a “great day” and dismissed “apocalyptic” warnings. “I’m proud to end this two-year experiment with heavy-handed regulation,” Mr. Carr added.
During Mr. Pai’s speech before the vote, security guards entered the meeting room at the F.C.C. headquarters and told everyone to evacuate. Commissioners were ushered out a back door. The hearing restarted a short time later. That shows you how unpopular the repeal of Internet Neutrality really is!
Despite all the uproar, it is unclear how much will change for internet users. The rules were essentially a protective measure, largely meant to prevent telecom companies from favoring some sites over others. And major telecom companies have promised consumers that their experiences online would not change.
Mr. Pai and his Republican colleagues have echoed the comments of telecom companies, who have told regulators that they weren’t expanding and upgrading their networks as quickly as they wanted to since the creation of the rules in 2015.
“There is a lot of misinformation that this is the ‘end of the world as we know it’ for the internet,” Comcast’s senior executive vice president, David Cohen, wrote in a blog post this week. “Our internet service is not going to change.” We certainly hope so!
But with the F.C.C. making clear that it will no longer oversee the behavior of broadband providers, telecom experts say, the companies could feel freer to come up with new offerings, such as faster tiers of service for business partners such as HBO’s streaming service or Fox News. Such prioritization could stifle certain political voices or give the telecom conglomerates with media assets an edge over rivals.
Is this net neutrality repeal set in stone? Not necessarily. The repeal could be overturned in court or by Congress. A Democratic senator is already working on legislation. Net neutrality advocates are also saying they’ll push ahead with both options to fight the repeal. In order for the repeal to go into effect, it must be approved by the Office of Management and Budget — a process that could take several months.
Other Voices:
Consumer groups, start-ups and many small businesses say there are examples of net neutrality violations by companies, such as when AT&T blocked FaceTime on iPhones using its network.
These critics of Mr. Pai, who was nominated by President Trump, say there isn’t enough competition in the broadband market to trust that the companies will try to offer the best services for customers. The providers have the incentive to begin charging websites to reach consumers, a strong business model when there are few places for consumers to turn when they don’t like those practices.
“Let’s remember why we have these rules in the first place,” said Michael Beckerman, president of the Internet Association, a trade group that represents big tech firms such as Google and Facebook. “There is little competition in the broadband service market.”
Mr. Beckerman said his group was weighing legal action against the commission. Public interest groups including Public Knowledge and the National Hispanic Media Coalition said they planned to challenge Mr. Pai’s order in court. Eric T. Schneiderman, the New York attorney general, also said he would file a lawsuit.
Dozens of Democratic lawmakers, and some Republicans, have pushed for Congress to pass a law on the issue, if only to prevent it from flaring up every couple of years at the F.C.C. — and then leading to a court challenge.
One Republican commissioner, Mike O’Reilly, said he supported a federal law created by Congress for net neutrality. But he said any law should protect the ability of companies to charge for faster lanes, a practice known as “paid prioritization.” Any legislation action appears to be far off, however, and numerous online companies warned that the changes approved on Thursday should be taken seriously.
“If we don’t have net neutrality protections that enforce tenets of fairness online, you give internet service providers the ability to choose winners and losers,” Steve Huffman, chief executive of Reddit, said in an interview. “This is not hyperbole.”
Netflix, which has been relatively quiet in recent weeks about its opposition to the change, said that the decision “is the beginning of a longer legal battle.” Netflix via Twitter (tweet) at 10:26 AM – Dec 14, 2017:
“We’re disappointed in the decision to gut #NetNeutrality protections that ushered in an unprecedented era of innovation, creativity & civic engagement. This is the beginning of a longer legal battle. Netflix stands w/ innovators, large & small, to oppose this misguided FCC order.”
This author totally agrees with Netflix! Let us know how you feel by leaving a comment in the box below this post. It can be anonymous if you like and your email address won’t be published! Thanks, Alan
…………………………………………………………………………………………………………………………………………………………………………………………………………
References:
| FCC Acts To Restore Internet Freedom (from FCC.gov website): | |||
| Reverses Title II Framework, Increases Transparency to Protect Consumers, Spur Investment, Innovation, and Competition | |||
| Documents: | |||
| Word : DOC-348261A1.docx DOC-348261A2.docx DOC-348261A3.docx DOC-348261A4.docx DOC-348261A5.docx DOC-348261A6.docx | |||
| PDF : DOC-348261A1.pdf DOC-348261A2.pdf DOC-348261A3.pdf DOC-348261A4.pdf DOC-348261A5.pdf DOC-348261A6.pdf | |||
| Text : DOC-348261A1.txt DOC-348261A2.txt DOC-348261A3.txt DOC-348261A4.txt DOC-348261A5.txt DOC-348261A6.txt | |||
| 12/14/2017 | |||
| Restoring Internet Freedom FCC-FTC Memorandum Of Understanding | |||
| . | |||
| Documents: | |||
| PDF : DOC-348275A1.pdf | |||
| Text : DOC-348275A1.txt | |||
Greg Wyler- OneWeb Satellite-Internet CEO- Telecom Man of the Year + $500M more from Softbank
Greg Wyler, the entrepreneur and CEO of satellite internet company OneWeb, has won the Fierce Wireless “Most Powerful Person In Telecom” tournament for 2017, just edging past T-Mobile CEO John Legere during this weekend’s final matchup and beating other industry notables like Ericsson’s Borje Ekholm, Apple’s Tim Cook and Verizon’s Lowell McAdam.
This past Sunday afternoon, Legere urged his almost 5 million Twitter followers to vote for OneWeb’s Wyler instead of himself:
Join me in voting for Greg as the Most Powerful Person in Wireless! We have until tomorrow morning to put Greg_Wyler (and his mission) on top, where he belongs! #IvoteGreghttps://www.fiercewireless.com/wireless/john-legere-vs-greg-wyler-vote-for-most-powerful-person-u-s-telecom-industry-2017 …
“This has been an amazing public statement about the need for global connectivity. Our mission is to enable affordable access for the world’s unconnected. While we still have a lot of work to do, with the support of partners, friends, governments, and customers, I know we will get there,” Wyler said in a statement issued shortly before voting ended on Tuesday morning.
OneWeb appears to have recently received another vote of confidence from Japan’s SoftBank. According to a Wall Street Journal report, SoftBank has increased its investment in OneWeb by another $500 million, bringing its total to $1.5 billion.
Wyler also told the WSJ that the company’s initial fleet of more than 700 low-altitude satellites is “generally on schedule” for launches beginning in 2018. The company plans to start offering service in Alaska by 2019 and expanding worldwide by the end of 2020, Wyler told the Journal. Further, he said that OneWeb plans to deploy 900 second-generation, higher-orbiting satellites by the mid-2020s, which he said would allow the company to offer speeds of 2.5 Gbps.
Mr. Wyler’s project has final approval from the Federal Communications Commission to turn on domestic service within two years, barring major technical or manufacturing problems. The approval also is contingent on other conditions.
According to Mr. Wyler, his team also is “trying to lead the charge” in reducing orbital debris stemming from potential satellite collisions or failures. OneWeb’s satellites, weighing hundreds of pounds and expected to cost less than $1 million apiece, are designed to be “as high or higher in quality and reliability” than much larger models costing $150 million or more, he said.
An early financial backer of some of the largest internet companies on both sides of the Pacific, SoftBank continues to seek synergies with mobile-phone businesses and the portfolio of assorted technology companies it has assembled over the years. SoftBank also has created the world’s biggest tech investment fund, worth nearly $100 billion. The Vision Fund has been roiling the venture community with its sheer scale, lifting valuations and helping entrepreneurs bypass usual fundraising rounds.
Since its official launch in May with the backing of investors such as Saudi Arabia’s sovereign-wealth fund, the fund has invested hundreds of millions of dollars in companies that SoftBank founder Masayoshi Son believes will corner key technologies in a future of smarter, interconnected, and automated devices. OneWeb’s satellites are geared to help serve as the backbone for those applications, Mr. Son has said.
SoftBank, which has a 40% stake in OneWeb based on a prior investment, walked away from merger talks between its U.S. wireless carrierSprint Corp. and rival T-Mobile US Inc., unwilling to relinquish control as the top shareholder of a spectrum Mr. Son believes will be valuable as everyday objects from cars to refrigerators increasingly communicate with one another.
Mr. Wyler, for his part, has long advocated the advantages of combining satellites circling the earth at different altitudes, arguing such synergies dramatically increase capacity and efficiencies. But unlike Mr. Musk’s concept, he doesn’t favor laser links between satellites on the grounds that such add-ons unduly increase weight and complexity.
…………………………………………………………………………………………………………………………………………………………………………………………………………………………………………
According to Fierce’s readership, Wyler is not only the industry’s top rising starfor 2017, he’s also the industry’s most powerful person. And that comes after Softbank reportedly invested another $500M in One Web- his satellite Internet start-up company!
Gartner Analysis & Predictions: Enterprise Network Infrastructure and Services
by : Bjarne Munch | To Chee Eng | Greg Young | Danellie Young | Vivek Bhalla | Andrew Lerner |Danilo Ciscato of Gartner Group
Overview:
This new Gartner Group report is on the key impacts of digital business, cloud and orchestration strategies. In particular, IT leaders must continue to focus on meeting enterprise needs for expanded WAN connectivity, application performance and improved network agility, without compromising performance.
Key Findings:
- As enterprises increasingly rely on the internet for WAN connectivity, they are challenged by the unpredictable nature of internet services.
- Enterprises seeking more agile WAN services continue to be blocked by network service providers’ terms and conditions.
- Enterprises seeking more agile network solutions continue to be hampered by manual processes and cultural resistance.
- Enterprise’s moving applications to public cloud services frequently struggle with application performance issues.
Recommendations:
IT leaders responsible for infrastructure agility should:
- Reduce the business impact of internet downtime by deploying redundant WAN connectivity such as hybrid WAN for business-critical activities.
- Improve WAN service agility by negotiating total contractual spend instead of monthly or annual spend.
- Improve agility of internal network solutions by introducing automation of all operations using a step-wise approach.
- Ensure the performance of cloud-based applications by using carriers’ cloud connect services instead of unpredictable internet services.
- Improve alignment between business objectives and network solutions by selectively deploying intent-based network solutions.
Strategic Planning Assumptions:
Within the next five years, there will be a major internet outage that impacts more than 100 million users for longer than 24 hours.
- By 2021, 25% of enterprise telecom contracts will evolve to allow for greater flexibility such as canceling services or introducing new services within the contract period, up from less than 5% today.
- By 2021, productized network automation (NA) tools will be utilized by 55% of organizations, up from less than 15% today.
- By YE20, more than 30% of organizations will connect to cloud providers using alternatives to the public internet, which is a major increase from 5% in 3Q17.
- By 2020, more than 1,000 large enterprises will use intent-based networking systems in production, up from less than 15 today.
Analysis:
Gartner Group has five predictions that represent fundamental changes that are emerging in key network domains, from internal networking to cloud services and WAN services.
two key aspects that the majority of Gartner clients struggle with:
- The increased interest in utilizing the internet for WAN connectivity continues to raise concerns about the performance of public internet services and performance of applications deployed in public cloud services. We discuss the risk that enterprises encounter due to the unpredictable nature of the internet, and we discuss how an enterprise can use MPLS to connect directly to public cloud services instead of using the internet.
- Enterprises continue to need new business solutions deployed faster, but remain hampered by the inability of network solutions and network services to respond fast enough and rectify performance issues fast enough. We discuss three options to improve network operations as well as network services.

Source: Gartner (December 2017)
Strategic Planning Assumptions
Strategic Planning Assumption: Within the next five years, there will be a major internet outage that impacts more than 100 million users for longer than 24 hours.
Analysis by: Andrew Lerner, Greg Young
Key Findings:
- We are increasingly seeing organizations use the internet as a WAN, and estimate that approximately 20% of Gartner clients in many geographic regions have at least some critical branch locations entirely connected via the internet.
- Most IT teams don’t have a detailed understanding of the multitude of applications and services that are being used on the public internet and/or their criticality. This is because of years of line of business (LOB)-centric buying and the proliferation of SaaS.
- While the internet is highly resilient, there are specific infrastructure and technology hot spots that, if compromised, could threaten the internet as a whole or large portions of it. This could be the result of natural disasters, man-made accidents or intentional acts.
- Natural disasters and man-made acts that could impact large portions of the internet include earthquakes, solar flares, electronic pulses, meteors, tsunamis, hurricanes, major cable cuts and network operator errors.
- Intentional acts include hacktivism, terrorism toward critical infrastructure, and/or coordinated distributed denial of service (DDoS) attacks, attacks against carrier- and ISP-specific components, and protocols (e.g., SS7).
While the probability of each of these events individually is small, the likelihood that at least some of them will occur over an extended period of time is actually surprisingly high. For example, even if there is only a 1% chance that any of the 11 examples identified above results in an outage within a year, there is a statistical likelihood of over 45% that at least one of them will occur over a five-year period. Further, to date, there have been indications that the internet is vulnerable to sizable outages:
- In 2008, millions of users and large portions of the Middle East and India were impacted by a cable cut. 1
- In 2016, a large DDOS attack resulted in many large e-commerce sites going down, including Twitter, Netflix, Reddit and CNN. 2
- In 2015, Telekom Malaysia created a routing problem that rendered much of the Level 3 network unavailable. 3
- It has been widely reported that 70% of all internet traffic goes thru Northern Virginia 4 and, while this might be an overstated, there’s no doubt that there are several major chokepoints in the internet infrastructure.
Market Implications:
At a minimum, an extended and widespread internet outage would cause dramatic revenue loss for enterprises, and could even create life-threating situations depending on what business the organizations is in. Initially, many organizations often brush this off by saying, “Well there’s not much we can do about it anyway” or “If there is a large internet outage due to a natural disaster, then personal safety is the priority and the enterprise connectivity is the least of our concerns.” However, there are very specific and actionable items that infrastructure and operations (I&O) leaders should take to mitigate the impact of a large outage.
Strategic Planning Assumption: By 2021, 25% of enterprise telecom contracts will evolve to allow for greater flexibility such as canceling services or introducing new services within the contract period, up from less than 5% today.
Analysis by: Danellie Young
Key Findings:
- Enterprise telecom contracts are typically fixed in both term duration and for the services required for procurement.
- Most larger revenue contracts ($1 million annually) require the enterprise to agree to minimum revenue commitments on an annual basis.
- Major WAN decisions are made by 31% to 47% of enterprises each year, including equipment refresh or carrier renegotiations (assuming the refresh cycle on routers is six years, and the average enterprise WAN service contract is three years).
- A large majority of enterprises are struggling with the cost, performance and flexibility of their traditional WAN contracts, further exacerbated by the proliferation of public cloud applications.
Market Implications:
Enterprise telecom contracts remain rigid and fixed, with specified services required to ensure compliance. Typically such contracts penalize customers when services are disconnected midterm. Enterprise telecom contracts are typically negotiated on 36-month cycles, based on either full-term or revenue commitments. Revenue commitments are set based on monthly spend, annual spend or total contract spending. Upon meeting the contract’s revenue commitment, the enterprise can then renegotiate or consider alternative services or providers since their financial obligation has been met. Terminating contracts early for convenience will typically levy penalties on the enterprise. These penalties range from 100% of the monthly recurring charges (MRCs) to a percentage of the MRCs to a declining portion through the remainder of the term (i.e., 100% in the first 12 months, 75% in months 13 to 24 and 50% through the end of the term).
Currently, contracts are split between term and revenue commit contracts, whereby most of the revenue commitments are made on an annualized basis. Alternatively, a small number (5%) are offered or negotiated with total contract values tied to them. Total contract revenue commitments enable the enterprise to meet the obligation earlier in their contract and provide the opportunity to negotiate new lower rates and a new contract, and to solicit competitive proposals before the full 36-month cycle terminates.
In addition to traditional voice and data services, many networking vendors now offer SD-WAN functionality products, while carriers and managed service providers (MSPs) are beginning to launch and roll out managed SD-WAN services as an alternative to managed routers. Contract flexibility will be needed to allow the enterprise the flexibility to migrate to new solutions, without financial risk or paying early termination fees on services. Thus, while we anticipate rapid adoption of SD-WAN and virtualized customer premises equipment (vCPE) solutions in the enterprise, SD-WAN by itself will not improve contractual conditions.
………………………………………………………………………………………………………………………………
5G Americas: LTE & LPWANs leading to ‘Massive Internet of Things’ + IDC’s IoT Forecast
A new by 5G Americas whitepaper, titled “LTE Progress Leading to the 5G Massive Internet of Things”is an overview of the technological advancements that will support the expanding IoT vertical markets, including connected cars and wearables. The term Massive IoT (MIoT) has been recently created by the telecom industry to refer to the connection for potentially large number of devices and machines that will call for further definition in the standards for LTE and later for 5G.
The generic requirements for IoT are low cost, energy efficiency, ubiquitous coverage, and scalability (ability to support a large number of connected machines in a network). To legacy operators, IoT services should ideally be able to leverage their existing infrastructure and co-exist with other services. In the 3GPP Release
13 standard, eMTC and NB-IoT were introduced. These technologies met the above generic IoT requirements. They support in-band or guard band operations. Device cost and complexity are reduced. A large quantity of IoT devices can be supported in a network while battery life is extended. Many of the related features were covered in the 5G Americas whitepaper, LTE and 5G Technologies Enabling the Internet of Things.

Jean Au, staff manager, technical marketing, Qualcomm Technologies, and co-leader of the whitepaper said: “Some cellular service providers in the U.S. are already adding more IoT connections than mobile phone connections, and the efforts at 3GPP in defining standards for the successful deployment of a wide variety of services across multiple industries will contribute to the growing success for consumers and the enterprise.”
At present, low-power wide area networks (LPWANs) are already gaining popularity and it is expected that cellular-based technologies including LTE-M (Machine) and Narrowband-IoT (NB-IoT) will emerge as the foremost standards for LPWA by 2020.
Wireless network operators will have the option to choose from several Cellular IoT (CIoT) technologies depending on their spectrum portfolio, legacy networks and requirements of the services they offer.
Vicki Livingston, head of communications, 5G Americas, said:
“There will be a wide range of IoT use cases in the future, and the market is now expanding toward both Massive IoT deployment as well as more advanced solutions that may be categorized as Critical IoT.”
According to Research and Markets, the global IoT platform market will grow at a CAGR of 31.79 percent from 2017 to 2021. The large number of active IoT devices collect data through sensors and actuators and transmit the back to a centralized location. The IoT platform empowers the end-user to make informed decisions using the data. Together with design innovations in 5G architectures, cloud-native edge computing platforms ensure Industrial IoT (IIoT) applications can be run in a cost-effective manner.
References:
http://www.5gamericas.org/files/3514/8121/4832/Enabling_IoT_WP_12.8.16_FINAL.pdf
………………………………………………………………………………………
Addendum: IDC’s IoT Forecast
Worldwide spending on the Internet of Things (IoT) is forecast to reach $772.5 billion in 2018, an increase of 14.6% over the $674 billion that will be spent in 2017. A new update to the International Data Corporation (IDC) Worldwide Semiannual Internet of Things Spending Guide forecasts worldwide IoT spending to sustain a compound annual growth rate (CAGR) of 14.4% through the 2017-2021 forecast period surpassing the $1 trillion mark in 2020 and reaching $1.1 trillion in 2021.
IoT hardware will be the largest technology category in 2018 with $239 billion going largely toward modules and sensors along with some spending on infrastructure and security. Services will be the second largest technology category, followed by software and connectivity. Software spending will be led by application software along with analytics software, IoT platforms, and security software. Software will also be the fastest growing technology segment with a five-year CAGR of 16.1%. Services spending will also grow at a faster rate than overall spending with a CAGR of 15.1% and will nearly equal hardware spending by the end of the forecast.
“By 2021, more than 55% of spending on IoT projects will be for software and services. This is directly in line with results from IDC’s 2017 Global IoT Decision Maker Survey where organizations indicate that software and services are the key areas of focused investment for their IoT projects,” said Carrie MacGillivray, vice president, Internet of Things and Mobility at IDC. “Software creates the foundation upon which IoT applications and use cases can be realized. However, it is the services that help bring all the technology elements together to create a comprehensive solution that will benefit organizations and help them achieve a quicker time to value.”
The industries that are expected to spend the most on IoT solutions in 2018 are manufacturing ($189 billion), transportation ($85 billion), and utilities ($73 billion). IoT spending among manufacturers will be largely focused on solutions that support manufacturing operations and production asset management. In transportation, two thirds of IoT spending will go toward freight monitoring, followed by fleet management. IoT spending in the utilities industry will be dominated by smart grids for electricity, gas, and water. Cross-Industry IoT spending, which represent use cases common to all industries, such as connected vehicles and smart buildings, will be nearly $92 billion in 2018 and rank among the top areas of spending throughout the five-year forecast.
“Consumer IoT spending will reach $62 billion in 2018, making it the fourth largest industry segment. The leading consumer use cases will be related to the smart home, including home automation, security, and smart appliances,” said Marcus Torchia, research director, Customer Insights & Analysis. “Smart appliances will experience strong spending growth over the five-year forecast period and will help to make consumer the fastest growing industry segment with an overall CAGR of 21.0%.”
Asia/Pacific (excluding Japan) (APeJ) will be the geographic region with the most IoT spending in 2018 – $312 billion – followed by North America (the United States and Canada) at $203 billion and Europe, the Middle East, and Africa (EMEA) at $171 billion. China will be the country with the largest IoT spending total in 2018 ($209 billion), driven by investments from manufacturing, utilities, and government. IoT spending in the United States will total $194 billion in 2018, led by manufacturing, transportation, and the consumer segment. Japan ($68 billion) and Korea ($29 billion) will be the third and fourth largest countries in 2018, with IoT spending largely driven by the manufacturing industry. Latin America will deliver the fastest overall growth in IoT spending with a five-year CAGR of 28.3%.
The Worldwide Semiannual Internet of Things Spending Guide forecasts IoT spending for 14technologies and 54 use cases across 20 vertical industries in eight regions and 53 countries. Unlike any other research in the industry, the comprehensive spending guide was designed to help vendors clearly understand the industry-specific opportunity for IoT technologies today.
https://www.idc.com/getdoc.jsp?containerId=prUS43295217
US Ignite adds 5 New Communities to Smart Gigabit Communities Program
U.S. Ignite’s smart cities project, called the Smart Gigabit Communities program, is a National Science Foundation (NSF) funded program that provides assistance to areas looking to advance gigabit technologies. The nonprofit group’s five new participants are Red Wing, Minn.; Eugene-Springfield, Ore.; Lexington, Ky.; Lincoln, Neb.; and the San Francisco Bay area.

………………………………………………………………………………………………………………
Backgrounder:
U.S. Ignite stimulates the creation of next-generation applications and services that leverage advanced networking technologies to build the foundation for smart communities, including cities, rural areas, regions, and states. The nonprofit organization helps to accelerate new wired and wireless networking advances from research to prototype to full-scale smart community and interconnected national deployments.
………………………………………………………………………………………………………………….
U.S. Ignite said in a press release that each of the communities will begin participating by using their new SGC support to find answers to civic challenges through gigabit enabled apps, tools and other solutions. At the same time, they will also be expected to contribute their insights and technologies with fellow SGC communities. The sharing is designed to create a network for smart city collaboration, a group that now includes 25 national and international communities.
Representing leaders in the San Francisco Bay Area, executive director of the City Innovate Foundation, Kamran Saddique, said that the Bay Area’s participation represents significant support for local cities in developing advanced infrastructure and solving common social problems.
“Smart communities and the Internet of Things are a set of modern digital technologies, civic innovations and social changes that have come together to create the opportunity to drive fundamental changes in government, business and society,” Saddique said in a statement. “Our participation in the US Ignite SGC network will help us to leverage these technologies to enhance the quality of life for the San Francisco Bay Area.”
The City Innovate Foundation is responsible for a number of civic tech and smart city programs that involve the cities San Francisco, Oakland, San Leandro and West Sacramento. Two of its major initiatives include SuperPublic, a Bay Area smart city innovation lab, and the national Startup in Residence program that coordinates partnerships between cities and tech startups.
An SGC requirement is that all cities that join the program must be investing in gigabit connectivity. San Francisco is preparing for a $1.3 billion citywide municipal internet network that will spread high-speed connectivity throughout the city.
Like San Francisco, the other four recently added communities expressed a similar eagerness and optimism to receive SGC’s support. Lexington Mayor Jim Gray said he was “ecstatic” to join the network and looks forward to “unparalleled innovations in the coming months and years,” while in Eugene, Oregon, Mayor Lucy Vinis said she was “thrilled” and expected gigabit connectivity in the community to drive education, healthcare, transportation and advanced manufacturing.
In Lincoln, Nebraksa, Mayor Chris Beutler is counting on the smart city support to bolster its own gigabit internet service that is coming to the city by 2019. A partnership with the internet service provider Allo is expected to connect gigabit fiber to more than 105,000 residences and 20,000 businesses and government offices.
“This public-private partnership creates the digital infrastructure that gives our entrepreneurs and students high-speed internet, supercomputer access to researchers and other innovators across the nation to build next-generation technology,” Beutler said in a statement.
Reference:
Huawei and NTT Docomo “5G” mmWave Field Trial in Tokyo
Huawei is highlighting a Tokyo, Japan trial in which the Chinese telecom/IT vendor achieved “5G” like download speeds of 4.52 gigabits per second over ~ three-quarters of a mile using 28 GHz millimeter-wave wireless technology. The trial took place in downtown Tokyo, where a base station working over 28GHz frequency was located at Tokyo Skytree’s viewing deck, 340m above the city.
Working with Japan’s NTT Docomo, Huawei said it was confident of launching a commercial 5G rollout by 2020 (NOTE: the IMT 2020 set of 5G standards are to be finalized by year end 2020).
“The high-speed and long distance support is one of important technical challenges for 5G mmWave conditions. This successful long distance live-demo on a 5G mmWave is a groundbreaking achievement in our joint effort with NTT DOCOMO to build a fundamental 5G commercial environment. This success makes us more confident in realizing the goal of commercializing 5G by 2020,” said Gan Bin, vice president of Huawei’s 5G product line.

Huawei utilized its 5G base station for the test, which supports Massive MIMO and beam forming technologies. Huawei also provided the 5G core network and the 5G mm wave test user equipment.
Huawei anticipates conducting further testing at the world’s biggest 5G testing site in Beijing’s Huairou District.
The test comes amid a flurry of 5G testing and trials around the world. For example, BT and Nokia announced plans for live “5G” tests in the UK earlier this month.
References:
http://www.huawei.com/en/news/2017/12/NTT-DOCOMO-5G-mmWave-Field-Trial-Tokyo
https://www.totaltele.com/498823/5G-testing-spurs-Huawei-to-deliver-5G-by-2020
IHS-Markit Forecast: Carrier NFV at $37B in 2021 for a CAGR of 30% from 2016-2021
by Michael Howard of IHS-Markit (co-founder and lead analyst at Infonetics)
Network Function Virtualization (NFV) MANO (management and network orchestration) and VNF (virtual network function) software revenue was $3.5B in 2016 and is expected to reach $5.9B for 2017, according to the NFV Hardware, Software, and Services biannual market tracker from IHS Markit.
NFV revenue is not all new: it includes displaced revenue and newly identified parts of existing market segments. In 2021, 49% of the NFV revenue will be new revenue from software and outsourced services, and 8% will be displaced revenue spent on NFVI server/storage/switch hardware purchased instead of purpose-built network appliances. The remaining 43% represent spend on VNF software.
“Operators around the world are planning or extending their NFV environments to customer sites on CPE (customer premises equipment), which we are calling uCPE (universal CPE). We expect operators will spend $11M on physical “uCPE” hardware in 2017, growing to $448M in 2021,” stated Michael Howard, Executive Director Research and Analysis for Carrier Networks at IHS Markit.
“In our 5th annual global carrier surveys on SDN and NFV, 82% of respondents indicated they are deploying or plan to execute VNFs on uCPE located at customer sites (with 97% in COs and 85% in DCs). Because this is such a large part of operator plans and products available now, we have sized and forecast the uCPE market,” Michael Howard added.
Above illustration courtesy of IHS-Markit
…………………………………………………………………………………………
Editor’s Note: NFV and MANO Backgrounder:

………………………………………………………………………………………………………………………..
NFV Reference Architecture showing NFV Orcestrator and VNF Manager

Above illustration extracted from the ETSI NFV MANO Specification
Recently, there’s been more innovation around the MANO portion of the NFV infrastructure and a recognition that MANO might need more development as a model given the gap between the MANO layer in NFV and the OSS/BSS (operations support systems/business support systems) portion of network operator businesses that handle the core orchestration and billing functions as shown above.
………………………………………………………………………………………………………..
More NFV Market Highlights (IHS-Markit):
· Revenue to vendors and systems integrators for outsourced services for NFV projects will grow to $16.6B in 2021 with a 2016-2021 CAGR of 23%.
· NFV software (NFV MANO and VNFs) revenue will grow to $15.5B in 2021 with a 2016-2021 CAGR of 36%.
· NFV hardware (NFVI server, storage, and switches) revenue will grow from $696M in 2016 to $3.1B in 2021 with a 2016-2021 CAGR of 35%.
· Service providers will invest $2B in hardware and software for the enterprise vCPE use case in 2021, and $293M for the consumer vCPE use case.
…………………………………………………………………………………………….
NFV Hardware, Software and Services Report Synopsis:
The IHS Markit NFV Hardware, Software, and Services market tracker provides biannual worldwide and regional market size, forecasts through 2021, analysis and trends for:
(1) NFV hardware [servers, switches, storage and uCPE],
(2) software: NFV MANO, Virtual Network Functions (VNF) [SD-WAN, mobile core & EPC, PCRF & DPI, security, IMS, SBC & DCS, video CDN, vRouters, and other VNFs],
(3) outsourced services for NFV projects, plus NFV use case spending [consumer vCPE and enterprise vCPE].
Vendors tracked include Amdocs, ADVA, Ciena, Cisco, ClearPath, Ericsson, Fujitsu, HPE, Huawei, Juniper Networks, Metaswitch Networks, Nakina Systems, Nokia, Nuage Networks, NEC, NetCracker, Oracle, ZTE, and others.
……………………………………………………………………………………..
Editor’s Note:
I strongly respect Mr. Howard’s work ethic and primary market research findings. While not having read this latest report, I’m sure it’s excellent. However, I’m still much more pessimistic on the NFV market due to the lack of standards for exposed interfaces/APIs and backward compatibility (especially hybrid network management) with the installed base of non NFV equipment/boxes.
ABI Research on NFV Market:
ABI Research forecasts that North America will lead the NFV market, accumulating $13 billion in NFV-related investments during 2022, while Europe will experience the highest growth rate at an estimated 53% CAGR between 2017 and 2022. Early adopters claim several benefits to NFV-enabled systems, which include reductions in network CAPEX & OPEX, service agility, and reduced deployment times for new network elements.
“In 2015 and 2016, the market experienced some early successes but mostly reconsiderations and failures with NFV,” says Neha Pachade, Senior Analyst at ABI Research. “Early adopters conducted proof of concept testing and NFV-integrated system demonstrations with the aim to understand the true impact of NFV in the technical, operational, and cultural domains. Our forecasts indicate that NFV will become a sizeable opportunity for vendors, although it is not yet clear whether it will cannibalize existing hardware-based product lines or create new market use cases.”
ABI Research estimates that total NFV market revenues will reach $38 billion in 2022. Hardware spend—including servers, storage devices, and switches—will reduce with time, while software and services will have higher growth rates of 55% and 50%, respectively. Although the market is evolving and technical expertise is starting to mature, the standardization and multi-vendor involvement challenges will remain stagnant for the next couple of years. Software and services vendors will have opportunities to identify NFV use-cases in enterprise verticals and use these to offer end-to-end integrated systems.
“Early contracts and market trends illustrate the biggest winners are likely to be the established vendors, including Ericsson, Huawei, and Nokia, as well as specialists like Amdocs and Netcracker, with systems integration becoming more important each day,” concludes Pachade. “Several vendors also place heavy and risky bets on open source software, which may increase business opportunities but may also create difficult choices for them in the future, particularly if telco interest in specific open source projects fizzles out. For the time being, NFV is mostly considered as a cost-cutting exercise, since new revenue opportunities require a transformation in a much broader context, which is more likely to be driven by 5G, after 2020.”
These findings are from ABI Research’s Network Functions Virtualization Tracker and Forecasts report.
Small Cell Forum Operator Survey: 36% compound annual growth between 2015 and 2025 in small cells
Overview:
The Small Cell Forum (SCF) commissioned an in-depth survey from Rethink Technology Research to understand more about their deployment plans and business drivers for a dense HetNet, and the barriers they need to overcome. Over 50 tier 1 and 2 mobile and converged operators responded to this survey, which illuminates operators’ deployment plans for network densification, as well as the barriers they expect to have to overcome.
The results showed that cell densification has begun in today’s LTE networks and will intensify in the 5G era, enabled by profound changes to the architecture and economics of small cells.
The SCF forecasts that between 2015 and 2025, new non-residential small cell deployments will grow at a compound annual rate of 36%, to reach almost 8.5 million, and by 2025 deployments will be 22 times higher than in 2015.
Densification is starting in LTE networks and will intensify in the 5G era, enabled by profound changes to the architecture and economics of small cells.
Key findings:
It is clear from the results of the survey that most mobile network operators (MNOs) are starting to plan for dense HetNets, even if they do not intend to deploy the 5G radio network at scale until well into the 2020s. The biggest uptick in new deployments of small cells will be seen in the 2018-2020 period, with a 50% increase, with a second sharp increase in 2023-2024 as 5G densification gets into full swing.
This indicates that many operators are densifying their networks long before they upgrade to 5G – the start of 5G small cell deployment will come in 2020, with 68% of respondents planning to embark on this upgrade before the end of 2022 and the rest later than that. While a smooth migration path to 5G will be important, most MNOs’ main concerns are with immediate issues of deployment in 4G.
Against that context, the following is a summary of some of the key findings of the survey:
• Only 17% of respondents have no plans for large-scale densification. By
contrast, by 2020, 40% of operators expect to deploy between 100 and 350
small cells per square kilometer in the areas they densify (led by transport
hubs, urban downtown regions and business parks).
• When it comes to 5G, 69% of operators planning 5G deployment before 2023
expect to start small cell deployment in tandem with the macro, or ahead of
it. In the first 2-3 years of deploying 5G New Radio, 58% expect to focus
primarily on small cells, 37% mainly in order to densify the network for
enhanced mobile broadband, and 21% mainly to enable new use cases.
• However, densification will happen well in advance of 5G. When asked to
rank their critical requirements for small cells, operators prioritized those
which relate to the here-and-now, not just 5G futures. Low total cost of
ownership (TCO), multivendor interoperability, ease of deployment and good
macro network interworking were the most commonly cited as top three
demands.
• It is vital for the industry to support the key requirements as soon as
possible, since the survey shows that many operators would be keen to
accelerate their deployment timeline if their concerns were addressed. For
instance, 19% would ideally like to start at-scale deployment within one year,
but only 7% believe that will be practical and affordable.
• The key factors which would enable them to bring their deadlines forward
would be new sources of affordable fiber for backhaul and fronthaul (53%
cited this), followed by lower overall TCO (50%) and easier access to sites
(46%).
• The commercial drivers which are creating this new urgency are becoming
more diverse and business-critical. Supporting improved quality of experience
(QoE) – the main determinant of customer satisfaction – through improved
and targeted capacity emerged as the most important driver (placed in the
top three by 40%). This was followed by lower total cost of ownership (TCO)
for the mobile network (38%), and the ability to deploy new services and
revenue streams based on small cells (36%).
• There is increasing diversity of business cases. On top of mobile broadband,
40% plan to introduce new enterprise services enabled by small cells before
2020 – and two-thirds after that – while for IoT services, the figures are 29%
and 39%.
• Density will allow MNOs to address new enterprise requirements. The areas
where the largest number see a business case for density would be transport
hubs, business parks and corporate buildings or campuses, while significant
opportunities are also seen in medium-sized enterprises and the hospitality
and property development sectors.
• To support business case diversity, there is a need for architectural diversity
too. As well as standalone access points, by the end of 2019, 50% also
expect to have deployed distributed radio systems and 33% clusters of small
cells managed by a virtualized controller.
• Other architectural changes are being actively adopted to make densification
easier and support additional use cases. For instance, by the end of 2019,
75% of operators will have implemented small cell SON (self-optimizing
networks), while 25% will have started to deploy end-to-end orchestration of
physical and virtual cells.
• To improve the small cell business case further, especially in the enterprise,
79% expect to support edge computing integrated with small cells, by the
end of 2022. Enterprise edge applications are seen as the leading driver
(40% placed it in their top three).
• To boost capacity, there is a rising need to tap into new sources of spectrum.
By 2022, 66% expect to be using LTE in unlicensed spectrum, and 45% plan
to have deployed small cells in spectrum above 20 GHz.
…………………………………………………………………………………………….
You can download the entire survey (after filling out a form) here.
IHS Markit: VMware acquires top SD-WAN vendor VeloCloud; 3Q17 SD-WAN revenue reaches $116M
Highlights:
SD-WAN (appliance + control and management software) revenue reached $116M in 3Q17, up 18% quarter-over-quarter (QoQ) and up 2.8x year-over-year (YoY). VeloCloud led the SD-WAN market with 22% share of 3Q17 revenue, Aryaka was in second place with 18%. Silver Peak rounded out the top 3 with 12%, according to the DC Network Equipment market tracker early edition from IHS Markit.
“The majority of SD-WAN solutions at first focused on virtualizing the WAN connection problem bringing automation, reliability, and agility to the enterprise WAN using overlays. Current use cases include direct connect for branch offices to the Internet and increased reliability through automated fail-over for a better user experience,” said Cliff Grossner, Ph.D., Senior Research Director and Advisor for the Cloud and Data Center Research Practice at IHS Markit.
Worldwide SD-WAN revenue (US$M)-3Q-2017:
|
VeloCloud |
|
$26.0 |
|
|||
|
Aryaka |
|
$21.3 |
|
|||
|
Silver Peak |
|
$14.1 |
|
|||
|
Viptela |
|
$9.5 |
|
|||
|
InfoVista |
|
$4.4 |
|
|||
|
Citrix |
|
$4.4 |
|
|||
|
Talari |
|
$4.1 |
|
|||
|
TELoIP |
|
$3.9 |
|
|||
|
FatPipe |
|
$3.8 |
|
|||
|
Cisco |
|
$3.1 |
|
|||
|
Huawei |
|
$2.8 |
|
|||
|
CloudGenix |
|
$2.5 |
|
|||
|
Riverbed |
|
$1.7 |
|
|||
|
ZTE |
|
$0.6 |
|
|||
|
Other |
|
$14.2 |
|
|||
|
Total SD-WAN |
$116.2 |
|||||
| Source: IHS-Markit | ||||||
“With the WAN connectivity problem well understood and solutions ramping in deployments, SD-WAN vendors are beginning to offer additional services such as WAN optimization and virtual firewall. The next important challenge for SD-WAN vendors to solve is providing connectivity with SLAs and security for the multi-cloud,” said Cliff Grossner.
More Market Highlights:
· 3Q17 ADC revenue increased 5% from 2Q17 and decreased 5% from 3Q16
· Virtual ADC appliances stood at 28% of 3Q17 ADC revenue
· F5 garnered 45% ADC market share in 3Q17 with revenue down 4% YoY. Citrix had the #2 spot with 29% of revenue, and A10 (8%) rounded out the top 3 market share spots.
Data Center Network Equipment Report Synopsis:
The IHS Markit Data Center Network Equipment market tracker is part of the Data Center Networks Intelligence Service and provides quarterly worldwide and regional market size, vendor market share, forecasts through 2021, analysis and trends for (1) data center Ethernet switches by category [purpose built, bare metal, blade and general purpose], port speed [1/10/25/40/50/100/200/400GE] and market segment [enterprise, telco and cloud service provider], (2) application delivery controllers by category [hardware-based appliance, virtual appliance], and (3) software-defined WAN (SD-WAN) [appliances and control and management software]. Vendors tracked include A10, ALE, Arista, Array Networks, Aryaka, Barracuda, Cisco, Citrix, CloudGenix, Dell, F5, FatPipe, HPE, Huawei, InfoVista, Juniper, KEMP, Radware, Riverbed, Silver Peak, Talari, TELoIP, VeloCloud, Viptela, ZTE and others.
……………………………………………………………………………………………………………………………………
From a Nov 15, 2017 press release:
According to the IHS Markit Data Center and Enterprise SDN Hardware and Software Biannual Market Tracker, SD-WAN is currently a small market, totaling just $137 million worldwide in the first half of 2017 (H1 2017). However, global SD-WAN hardware and software revenue is forecast to reach $3.3 billion by 2021 as service providers partner with SD-WAN vendors to deploy overlay solutions — and as virtual network function (VNF)–based solutions become more closely integrated with carrier operations support systems (OSS) and business support systems (BSS).
“Currently, the majority of SD-WAN revenue is from appliances, with early deployments focused on rolling out devices at branch offices,” Grossner said. “Moving forward, we expect a larger portion of SD-WAN revenue to come from control and management software as users increasingly adopt application visibility and analytics services.”
More highlights from the IHS Markit data center and enterprise SDN report:
- Globally, data center and enterprise software-defined networking (SDN) revenue for in-use SDN-capable Ethernet switches, SDN controllers and SD-WAN increased 5.4 percent in H1 2017 from H2 2016, to $1.93 billion
- Based on in-use SDN revenue, Cisco was the number-one market share leader in the SDN market in H1 2017, followed by Arista, White Box, VMware and Hewlett Packard Enterprise
- Looking at the individual SDN categories in H1 2017, White Box was the frontrunner in bare metal switch revenue, VMware led the SDN controller market segment, Dell held 45 percent of branded bare metal switch revenue and Hewlett Packard Enterprise had the largest share of total SDN-capable (in-use and not-in-use) branded Ethernet switch ports
…………………………………………………………………………………………………………………………………………………………………..
Editor’s Notes:
We’ve repeatedly pounded the table that there are no standards for SD-WANs, despite efforts by MEF [1]. That implies single vendor SD WAN with vendor lock-in and no interoperability between SD-WANs from different vendors.
Note 1. MEF says it will standardize the managed services that SD-WAN network operators deliver, by developing open APIs, along with common terminology and components. This effort builds on MEF’s Lifecycle Service Orchestration effort. Please refer to this MEF document.
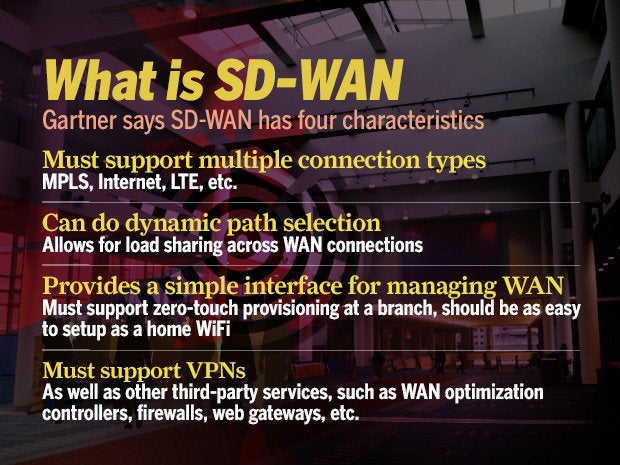
Note 2. Gartner’s definition of SD-WAN
More from Gartner on SD-WANs:
Enterprise network leaders face enormous challenges adapting and changing their managed WAN services to meet constantly changing business needs for new applications, new offices, more users, cloud services and digital business. Based on hundreds of client inquiries and recent Research Circle surveys, a key obstacle is that traditional network services are too slow in meeting these needs, and network leaders need alternative solutions that can meet their evolving needs faster. Compared to traditional WAN services, managed SD-WAN services (including various WAN connectivity services) are emerging with promises of greater agility, flexibility, control and cost-efficiency.
Gartner recommends that network leaders seeking managed WAN services use end-to-end managed SD-WAN and connectivity services to create agile and cost-effective managed WAN services. However, they must avoid buying into overinflated expectations created by the market hype that ignores the limitations of current services. To avoid the inevitable disappointment that follows unfulfilled expectations, network leaders should outline their service requirements, and use these to define evaluation criteria for a balanced analysis of service benefits and limitations.’

Source: Gartner (December 2017)
Enterprise network leaders face enormous challenges adapting and changing their managed WAN services to meet constantly changing business needs for new applications, new offices, more users, cloud services and digital business. Based on hundreds of client inquiries and recent Research Circle surveys, a key obstacle is that traditional network services are too slow in meeting these needs, and network leaders need alternative solutions that can meet their evolving needs faster. Compared to traditional WAN services, managed SD-WAN services (including various WAN connectivity services) are emerging with promises of greater agility, flexibility, control and cost-efficiency.
Gartner recommends that network leaders seeking managed WAN services use end-to-end managed SD-WAN and connectivity services to create agile and cost-effective managed WAN services. However, they must avoid buying into overinflated expectations created by the market hype that ignores the limitations of current services. To avoid the inevitable disappointment that follows unfulfilled expectations, network leaders should outline their service requirements, and use these to define evaluation criteria for a balanced analysis of service benefits and limitations.’
Source: Gartner (December 2017)
Current WAN services take too long to roll out and are too difficult to relocate or terminate, and network leaders are looking for ways to improve this. Network leaders see SD-WAN as a new opportunity to create more agile branch office connectivity due to appliances’ support of “zero-touch-configuration.” Vendors are fueling these expectations with reports of very fast site rollout with reports of 20 to 30 sites deployed overnight, compared to six to 10 sites per week for a traditional managed router service. However, SD-WAN does not change fundamental limitations of connectivity services, for example:
- Fast site deployments are only available for 4G/LTE access services or in cases where the provider already has a wired access service to the building (although in many cases these still require one to two weeks to provision).
- Network leaders who need new wired access services still need to plan for 14 to 90 days (or longer) from order to provisioning.
- All wired branch office connections, private or public, still require network leaders to sign a contract of fixed duration, making it a problem for network leaders to move or terminate a site without financial penalties.
Network leaders who need new WAN sites deployed with short notice should request managed SD-WAN with embedded LTE services. While many providers do not yet offer this service, there are providers in select countries that courier SD-WAN appliances with LTE embedded to customer sites instead of sending a technician. The best-case scenario is only six hours from order placement to on-site delivery of the appliance. Combined with self-service, where the enterprise plugs in the SD-WAN appliance to the LAN and powers up the device, the site can be operational within a day in the best case. However, network leaders who do not want their office staff to plug in the appliance need to plan for up to a week for a technician to be on-site, depending on location.
However, besides expense, the performance limitations of 4G/LTE include lower bandwidth than fiber, lack of geographic coverage and lack of QoS. Also, most of these services are based on using the internet as backhaul to the provider’s internet gateway. This means that, for larger sites and critical applications, network leaders should only employ 4G/LTE connectivity as an interim primary connection until a fiber connection has been deployed.
……………………………………………………………………………………………………………………………………………………………………………………………………
Because of the performance issues that still plague the internet in most parts of the world, the majority of enterprises are not replacing MPLS with internet services. Instead, based on client inquiries, Gartner estimates that around 60% of global WANs use both internet and MPLS in concert in a hybrid WAN that sends critical application traffic over the MPLS and everything else over the internet.
Enterprise experience has shown that for a global managed hybrid WAN, network planners can obtain at least 30% expense savings compared to traditional managed WAN (see “Cloud Adoption Is Driving Hybrid WAN Architectures” ). Network planners that want to replace their global MPLS with internet should progress selectively, and choose a few sites in areas where the internet is most likely to be of good quality. For these sites, demand a two- to four-month pilot as a condition of signing a new WAN contract. Remember that all internet providers and services are not the same. Use only a select few and do not disaggregate internet providers, as WAN and application performance will suffer.
