

U.S. Commerce Secretary Talks Up 5G Implying T-Mobile/Sprint Merger Would Accelerate 5G Deployments in U.S.
The Trump administration is placing a high priority on building 5G mobile networks, Commerce Secretary Wilbur Ross told CNBC in a discussion of T-Mobile’s proposed merger with Sprint. According to a CNBC provided transcript of the interview, Ross said:
“You never know who is really ahead or behind (in 5G) until it is truly perfected. Nobody has 5G totally perfected yet. I think the pitch that Sprint and T-Mobile are making is an interesting one that their merger would propel Verizon and AT&T into more active pursuit of 5G. Whoever pursues it, whoever does it, we’re very much in support of 5G. We need it. We need it for defense purposes. We need it for commercial purposes. We (the U.S.) really need to be the player in 5G.”
A video of the interview can be watched here.
……………………………………………………………………………………………………………………………………………………………………………………….
The Federal Communications Commission (FCC) said in February it planned new auctions of high-band spectrum starting later this year to speed the launch of next-generation 5G networks. Carriers have spent billions of dollars acquiring spectrum and are beginning to develop and test 5G networks, which are expected to be at least 100 times faster than current 4G networks and cut latency, or delays, to less than one-thousandth of a second from one-hundredth of a second in 4G, the FCC has said.
Policymakers and mobile phone companies have said the next generation of wireless signals needs to be much faster and far more responsive to allow advanced technologies like virtual surgery or controlling machines remotely. T-Mobile Chief Executive John Legere met with two FCC commissioners in Washington on Tuesday to discuss the merits of the deal.
………………………………………………………………………………………………………………………………………………………………………………………..
Sprint is beginning to train its employees on what to say regarding the merger.
A memo has leaked out, courtesy of XDA-Developers, that shows the talking points that Sprint wants its customers to focus on. According to the document, Sprint employees are supposed to say that the company is very excited that the two companies have agreed to merge. And add that “this is terrific news for customers.” As well as assuring customers that the new T-Mobile will have “a faster, more reliable network at lower prices and with better value.” Which is basically what Sprint and T-Mobile said on Sunday and on Monday during their press tour with different news sites and TV networks.
Columnist Alexander Maxham wrote: “It is definitely important for Sprint to begin training its employees on what to say to customers regarding this merger, as there are bound to be a ton of questions regarding the merger in the coming weeks and months. T-Mobile is likely also training its employees on what to say about the merger – and many of the talking points are likely very similar if not exactly the same. Though T-Mobile’s memo has not leaked just yet. The two companies believe that merging together, they’ll be able to provide the best 5G network in the US, and also be able to better compete with AT&T and Verizon, both of which are more than twice the size of T-Mobile, and almost three times the size of Sprint.”
T-Mobile Sprint Merger Focus is on 5G and China Competition
T-Mobile USA and Sprint announced they would merge on Sunday. The combined company will be named T-Mobile, which says it “will be a force for positive change in the U.S. wireless, video, and broadband industries. The combination of spectrum holdings, resulting network scale, and expected run rate cost synergies of $6+ billion, representing a net present value (NPV) of $43+ billion will supercharge T-Mobile’s Un-carrier strategy to disrupt the marketplace and lay the foundation for U.S. companies and innovators to lead in the 5G era.”
T-Mobile said in that same referenced press release:
The New T-Mobile will have the network capacity to rapidly create a nationwide 5G network with the breadth and depth needed to enable U.S. firms and entrepreneurs to continue to lead the world in the coming 5G era, as U.S. companies did in 4G. The new company will be able to light up a broad and deep 5G network faster than either company could separately. T-Mobile deployed nationwide LTE twice as fast as Verizon and three times faster than AT&T, and the combined company is positioned to do the same in 5G with deep spectrum assets and network capacity.
The combined company will have lower costs, greater economies of scale, and the resources to provide U.S. consumers and businesses with lower prices, better quality, unmatched value, and greater competition. The New T-Mobile will employ more people than both companies separately and create thousands of new American jobs.
While T-Mobile (AKA “the un-carrier”) has been growing quickly, Sprint has been recovering from its worst days. It’s still growing slowly and bleeding cash, with 54.6 million users across its various brands. “This deal is probably more necessary for Sprint than T-Mobile,” said Amy Yong, a research analyst at Macquarie Capital.
“All the stars have aligned,” Marcelo Claure, Sprint’s chief executive, said in an interview. He added that the deal “allows this company to offer the best product at better prices, lower prices.”
Putting together the country’s third- and fourth-largest mobile service providers would be one of the most significant consolidations in the U.S. wireless market in years. A combined T-Mobile and Sprint, with almost 100 million retail subscribers as of Dec. 31st, would put it ahead of AT&T, with 93.6 million, and not far behind Verizon’s 116.3 million. (Or, as the colorful Mr. Legere put it, the transaction would help it better compete against the companies that he has previously referred to as “dumb and dumber.”)
Behind the Merger — Funding the 5G Infrastructure Build-Out:
A huge part of T-Mobile and Sprint’s push is emphasizing the future of 5G. Proponents say the superfast wireless standard (in late 2020 IMT 2020 standard by ITU-R WP5D is scheduled for its first release) would not only make downloading movies faster, but underpin huge advances in autonomous vehicles, internet-connected devices and more.
Wireless network operators are preparing to spend billions of dollars to expand their pre-standard “5G” infrastructure. Sprint and T-Mobile would have much more difficulty than competitors in funding that “5G” build-out. Sprint has about $32 billion in debt on its books, while T-Mobile generates a small fraction of the cash that Verizon and AT&T do.
Again, quoting from T-Mobile’s press release:
Neither company standing alone can create a nationwide 5G network with the breadth and depth required to fuel the next wave of mobile Internet innovation in the U.S. and answer competitive challenges from abroad.
……………………………………………………………………………………………………………………………………………………………….
Traditional wireless telecoms (like AT&T and Verizon) now find themselves competing against newer contenders looking to chip away at their wireless market share. Comcast and Charter Communications are cable companies/MSOs each with a large installed base of broadband cable Internet customers that have begun offering wireless service plans to their subscribers, mostly as MVNOs.
As pre-standard 5G is first being positioned for fixed wireless broadband access, the unified T-Mobile and Sprint would ostensibly compete against cable providers like Comcast and Charter in addition to wireless mega telcoms AT&T and Verizon. While the IMT 2020 forthcoming ITU-R standard doesn’t implicitly acknowledge “5G fixed broadband access” there is some justification for the combined company to compete with MSOs/Cablecos, AT&T (U-Verse and AT&T Fiber) and Verizon (FiOS).
In addition to varying coverage maps, the two wireless carriers have wide swaths of spectrum that only sometimes overlap (Sprint has the 800MHz and 2.5GHz bands, while T-Mobile has 600MHz and 700MHz). You could see more comprehensive coverage from the merged entity (the new T-Mobile). Moreover, there’s no question that gigabit bandwidth and low latency make that a more of a viable option for fixed broadband internet access. The first “5G” deployments are focused on replacing broadband, not upgrading the smartphone, other mobile gadgets or IoT devices.
T-Mobile CEO John Legere took it further saying, “Global tech leadership in the next decade is at stake. And only the new T-Mobile will have the network and spectrum capacity to quickly create a broad and deep 5G network in the first few years of the 5G innovation cycle, the years that will determine if American firms lead or follow in the 5G digital economy.”
The China Factor:
The hidden agenda here from T-Mobile and Sprint is that failure to keep up in 5G would give China and Chinese firms a huge competitive technology edge. The Trump administration has called 5G a “national priority” and hinted at building a nationwide 5G network, primarily to compete against China (that rumor was later denied).
In March, the Trump administration blocked a hostile bid by Singapore-based Broadcom for San Diego-based Qualcomm, citing national security concerns. Some analysts questioned whether the predominantly foreign ownership of the combined company — including SoftBank, which has business ties to Chinese companies like Huawei — posed possible national security risks.
“They kept pointing to China on the call, but that is just a nice way to grease the skids,” said Will Townsend, an analyst with Moor Insights and Strategy, a research firm based in Texas, referring to a T-Mobile conference call with reporters and analysts on Sunday.
The focus on China does raise tricky questions for Sprint’s controlling shareholder, the Japanese conglomerate SoftBank, which buys telecom equipment from Chinese manufacturers. Still, most experts agree that the deal would produce a healthier company, one with more financial resources to pursue 5G. And where the rivalry in advanced industries between the United States and China is concerned, the prize is significant.
Many pundits (but not this author) say that 5G will impact a huge set of future economic and technological opportunities — from self-driving cars to smart cities and factories to virtual and augmented reality requiring huge amounts of bandwidth and/or low latency.
“It’s hard to argue that 5G is not key to the next five to 10 years,” said Chris Lane, a telecom analyst in Hong Kong with Sanford C. Bernstein. “Strategically, if you’re the U.S. and you’re trying to plan industrial policy, this deal makes sense.”
Mobile carriers in China have already announced bold plans to roll out 5G networks, and it is unlikely that the creation of a new American wireless giant would affect them. China Mobile, which has nearly 900 million wireless customers, is aiming to begin large-scale 5G trials in several Chinese cities this year.
Other Chinese companies are still vulnerable to American pressure, though. In particular, the United States government has placed restrictions on one giant Chinese supplier of the equipment that will make those new networks possible, and is investigating another.
For years, Huawei and ZTE have been unable to sell to large American wireless operators over security concerns. But the Department of Commerce recently went further, blocking ZTE from using American-made components for seven years, saying the company had failed to reprimand employees who violated American sanctions against Iran and North Korea.
ZTE now faces the prospect of being unable to manufacture network gear during the years in which wireless providers in China and elsewhere will most likely be building 5G networks. Huawei, meanwhile, faces an ongoing inquiry related to violations of American trade controls.
Serious disruption to either company’s business could mean a boon for their main rivals in telecommunications equipment, Nokia of Finland and Ericsson of Sweden.
It could also put SoftBank in an awkward position.
“SoftBank has been working with ZTE in Japan, but now they have to try to find other partners,” said Tsutsumu Ishikawa, an independent expert in Tokyo who covers the mobile industry.
As T-Mobile and Sprint seek Washington’s blessing for their union, the Trump administration might even require that SoftBank drop Huawei and ZTE as suppliers, said Mr. Lane of Bernstein. Masayoshi Son, SoftBank’s founder, has also cultivated personal ties with President Trump.
“If the administration for whatever reason doesn’t want Chinese suppliers of network equipment in Japan, either — and it’s possible — then I’m sure Masa would be willing to compromise,” Mr. Lane said, using Mr. Son’s nickname. “I think he’s quite pragmatic.”
“A lot of people are genuinely struggling to figure out, ‘What is the business case for 5G?’” said Ramakrishna Maruvada, a telecom analyst in Singapore with Daiwa Capital Markets. “Most operators do not think faster consumer broadband is a good enough reason to be pursuing a huge leap in technology.” [This author absolutely agrees. However, low latency is probably more important than bandwidth for many “5G” applications like real time control of IoT devices/equipment, autonomous vehicle to vehicle communications, and virtual reality/augmented reality.]
AT&T’s Q1-2018 Earnings Report with Analysis of Business Revenues & Time Warner Deal Impact
Executive Summary:
AT&T reported first-quarter 2018 results after markets closed on Wednesday April 25th. The telecom goliath reported adjusted diluted quarterly earnings per share (EPS) of $0.85 on revenues of $38.04 billion. In the same period a year ago, the company reported EPS of $0.74 on revenues of $39.37 billion. First-quarter results were a bit below the consensus estimates for EPS of $0.87 on revenues of $39.31 billion.
Operating cash flow totaled $8.9 billion and capital expenditures totaled $6.1 billion in the first quarter. Free cash flow totaled $2.8 billion.
AT&T reported total mobile subscribers and connections of 143.83 million for the quarter, of which 77.43 million were postpaid (contract) subscribers. That amounts to a loss of 78,000 postpaid customers, more than the 68,000 loss analysts were expecting. Postpaid net additions totaled 49,000, far better than the 194,000 subscribers lost in the first quarter of 2017, but less than 10% of the 558,000 net adds in the fourth quarter of last year. The company had a big surge in subscribers for its core wireless business during the quarter before this one, but analysts from New Street Research LLP are questioning the quality of those gains.
That’s largely due to aggressive promotions, like AT&T’s buy-one-get-one-free iPhone offer, which required customers who took advantage of the promo to add another wireless subscription. New Street’s analysts are concerned that if customers were prompted “to add lines they don’t need to get free or cheap devices,” a portion of those lines “will be disconnected in due course.” This means investors should watch for higher churn rates down the road. Already the benefits of such promos may be waning, with AT&T adding just 49,000 wireless postpaid customers in the first quarter, versus more than 550,000 in the fourth quarter.
……………………………………………………………………………………………………………………………………………………………..
The DirecTV business lost 187,000 subscribers in the quarter, less than analysts’ estimate for a loss of 257,000. The DirecTV Now streaming service added 312,000 new subscribers.
AT&T saw declining business revenue in the first quarter (see Analysis below), as increased wireless sales to businesses and improved strategic service revenues failed to offset the decline in legacy services.
………………………………………………………………………………………………………………………………………………
AT&T Business Revenues by Carol Wilson of Lightreading:
AT&T saw declining business revenue in the first quarter, as increased wireless sales to businesses and improved strategic service revenues failed to offset the decline in legacy services. However, its chief financial officer pointed to an improving trend in business revenues, with slower declines, and said the move to a software-defined network is beginning to pay off.
Total business wireline revenues were $6.8 billion, down 7.9% year over year, or down 3.3% on a comparable accounting basis, according to AT&T Inc. (NYSE: T). Wireless business revenues were up nearly 4%, but wireline revenues were down 3% year over year, for an overall decline of 1.6% on a comparable basis.
This decline is “an improvement over recent quarters and similar to what we saw in the fourth quarter,” John Stephens, AT&T CFO, told analysts in the earnings conference call. “This improving trend in wireline is encouraging, and this comes before any expected bump from business activity we might see as the result of tax reform.”
AT&T saw a “significant improvement in business wireline margins where EBITDA grew year over year and margins were up 190 basis points on a comparative basis,” he noted, crediting the AT&T Business Solutions team with doing “a great job in driving cost management initiatives.”
Some of those operating expense savings came from the move to a software-defined network, Stephens said, as 55% of network functions were virtualized by the end of 2017.
AT&T also touted gains in what it calls “strategic business services,” which are the wireline offerings including virtual private networks, Ethernet, cloud, hosting IP conferencing, voice over IP, dedicated Internet, IP broadband and security services. Revenues in those areas grew about 6% or $166 million and represented 44% of total business wireline revenues and an annual revenue stream of $12 billion.
That growth could not offset a $440 million decline in legacy business revenues, however, as AT&T, like other telecom operators, continues to see businesses either move to competing carriers or replace legacy services with more cost-efficient offerings.
…………………………………………………………………………………………………………………………………..
Impact of the Time Warner Merger (if it happens or not?):
Without the deal, AT&T’s weaknesses will be more pronounced and its next chapter will be left open-ended—not to mention that nearly two years of planning, negotiations, adviser fees and legals costs will have been for nothing. If the deal does get done, the wireless-service and pay-TV provider’s bundling opportunities and bargaining power will be greatly enhanced, though it will also have to contend with an unprecedented level of debt that must be balanced against a dividend-hungry investor crowd and a costly but crucial 5G-network build. Interpreting the company’s quarterly results depends on which of these scenarios ultimately plays out.
This is week six of the merger trial, in which attorneys for the U.S. Justice Department are trying to make the case that a combined AT&T-Time Warner would be harmful to the industry and result in higher prices for consumers. While it’s still not clear how the judge will rule, shareholders are becoming more confident that the transaction will survive court. If it doesn’t, those shareholders may be forced to see two key operational metrics in a different light.
With Time Warner’s assets—namely HBO, Turner Broadcasting and the Warner Bros. film studio—AT&T will look like an entirely different company. It will look a lot like Comcast, and that’s part of the problem from the Justice Department’s standpoint. Time Warner will face its own challenges around advertising trends and trying to stuff its array of networks into limited streaming packages. But there’s no question that it will help make sense of Randall Stephenson’s expansion of AT&T into the pay-TV market and improve AT&T’s positioning and value proposition.
Should the Time Warner acquisition get blocked, it will mark a third deal disappointment for Stephenson. The first was AT&T’s attempt to buy T-Mobile back in 2011, which also faced regulatory opposition. DirecTV was the second—it got done, but it’s clear now that AT&T overpaid.
IHS Markit: Enterprises Evaluating SD-WAN; Ethernet Access Device Market up 8% YoY
Companies Evaluating SD-WAN As Enterprises Embrace the Cloud, IHS Markit Survey Says
LONDON (April 25, 2018) – IHS Markit (Nasdaq: INFO), a world leader in critical information, analytics and solutions, today released findings from its WAN Strategies North American enterprise survey, which reviews the evolving requirements for wide-area networks (WANs) of medium-to-large companies, including the adoption of software-defined WAN (SD-WAN). Nearly three-quarters (74 percent) of respondents conducted SD-WAN lab trials in 2017; by 2018, many will move into production trials and then to live production.
The latest annual survey of network managers from IHS Markit shows that investments in WANs continue unabated, driven by traffic growth, company expansion, adoption of the Internet of things (IoT), the need for greater control over the WAN, and the need to put WAN costs on a sustainable path. Security in particular is the number one network change by a wide margin, and the top reason to invest in new infrastructure, as companies must fend off the constant threat of cyber attacks.
“As companies shift a greater portion of their IT infrastructure into the cloud, and expand their physical presence to go after new markets or be closer to customers and partners, the need for reliable, secure and high-performance WAN and internet connectivity has never been greater,” saidMatthias Machowinski, senior research director for enterprise networks at IHS Markit. “However, companies don’t have unlimited budgets to fund growing WAN bandwidth consumption, which is why a majority are planning to deploy software-defined WAN in the next three years, to better control how their WANs are used.”
Following are some additional data points from the survey:
- Respondents expect their WAN bandwidth usage to grow over 20 percent annually — data center usage is the highest, while branch offices are experiencing the highest growth, at nearly 30 percent per year.
- Reflecting the significant demands placed on WANs, total WAN expenditures rose nearly 20 percent annually, to reach $300,000 per respondent in 2017.
- 71 percent of respondents will use off-premises cloud service providers by 2018, which will become the top application strategy in 2018.
………………………………………………………………………………………………………………
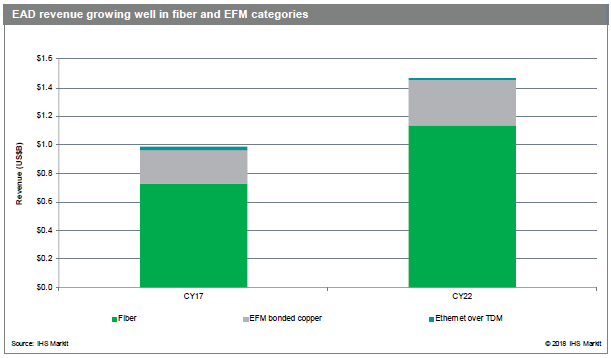
Ethernet access device market up 8 percent year over year in 2017
Worldwide Ethernet access device (EAD) revenue totaled $987 million in 2017, increasing 8 percent over 2016. The market is forecast to reach $1.47 billion in 2021, achieving a 2017–2022 compound annual growth rate (CAGR) of 8 percent.
“The EAD market is growing as a direct reflection of the continuous, steady demand from operators for mobile backhaul and wholesale services — and from business, broadband and building applications,” said Richard Webb, associate director, mobile backhaul and small cells research at IHS Markit.
“A new sub-segment is beginning to make an impact in the EAD market: the universal CPE, or ‘uCPE’ — a device that provides a ‘pico cloud’ of computing, storage and switching capable of executing virtualized functions,” Webb said. “Still, there will be an ongoing role for EADs even as virtual CPE takes off.”
Additional EAD market highlights
- Increasing demand for fiber-connected EADs will be the main driver of the market though at least 2022; in 2017, there was a 6 percent increase in the fiber segment
- Ciena was number one in EAD revenue market share for 2017, followed by ADVA, RAD, Actelis and MRV
- North America remained the largest market for EADs in 2017, with 50 percent of EAD revenue; Europe, the Middle East and Africa (EMEA) had 24 percent, Asia Pacific held 20 percent and the Caribbean and Latin America (CALA) had 6 percent
- For now and in the foreseeable future, North America maintains its lead through the early adoption of higher-capacity ports over fiber
Ethernet Access Devices Market Tracker
The biannual EAD report from IHS Markit tracks fiber and copper (EFM bonded and EoTDM bonded) Ethernet access devices by port speed, form factor and application. It also tracks uCPE. The report provides worldwide and regional market size, vendor market share, forecasts through 2022, analysis and trends.
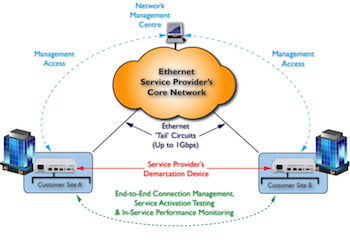
FCM9003: Ethernet Access Device solution
Image courtesy of Metrodata in the U.K.
……………………………………………………………………………………………………….
About IHS Markit (www.ihsmarkit.com)
IHS Markit (Nasdaq: INFO) is a world leader in critical information, analytics and solutions for the major industries and markets that drive economies worldwide. The company delivers next-generation information, analytics and solutions to customers in business, finance and government, improving their operational efficiency and providing deep insights that lead to well-informed, confident decisions. IHS Markit has more than 50,000 business and government customers, including 80 percent of the Fortune Global 500 and the world’s leading financial institutions.
Taiwan Regulator: Price Wars Negative for 5G Development & Deployments
Taiwan’s National Communications Commission (NCC) regulator said that an ongoing price war in the Taiwanese mobile industry could hamper the development and deployment of 5G, according to an article in the Taipei Times.
The warning came after Chunghwa Telecom introduced a fourth-generation (4G) service plan earlier this month that targets government workers, teachers, school staff and military personnel, charging users NT$499 per month for unlimited access to mobile Internet and unlimited phone calls between subscribers of the same network. Taiwan Mobile, Far EasTone Telecommunications and Asia-Pacific Telecom quickly followed suit, introducing the same plan to attract subscribers.
NCC spokesperson Wong Po-tsung (翁柏宗) said that the commission respects a free market system, but added: “If telecoms simply want to boost their market shares and revenue by luring subscribers from competitors, rather than with innovative business models, it would not be positive for the development of 5G in the nation.”
“What they are doing does not help to make the pie bigger. They are not benefiting from innovative business models that could sustain them through the maintenance and operation of 4G services, the auctioning of the 5G service spectrum and finally commercial operation of 5G,” Wong said.
“That would hamper sustainable development of the nation’s telecommunications industry,” he added.
While carriers in other countries have sought to provide original content by buying content producers or have expanded their businesses overseas, Taiwanese telecoms are unlikely to do so, Wong said.
“Either none of them are big enough to develop their businesses overseas, or the acquisition of content providers is out of the question because of regulations that ban the government, political parties and the military from investing in media,” Wong said.
Carriers need to have courage and stop offering unlimited data and call service at unreasonably low prices, which would hurt their development in the long term, Wong said.
It is not the first time that telecoms have engaged in price competition to attract subscribers since 4G was launched in 2014. Average monthly fees dropped from about NT$1,300 to below NT$1,000 within one year of the service being launched, in a bid to motivate people to upgrade to 4G. The tactic was revived last year, with prices dropping further to NT$599 per month.
NCC statistics showed that mobile carriers’ revenue has declined from NT$53.2 billion (US$1.81 billion) in the second quarter of 2016 to NT$49.4 billion in the fourth quarter of last year.
Apart from a continued decrease in revenue from voice communication and a rapid increase in data transmission, industry experts have also attributed the decline in revenue to an ongoing price war. Offering unlimited data and call services at unreasonably low prices will hurt operators’ development in the long term, the regulator added. Operators are already grappling with declining revenue as a result of the price war, coupled with the continued decline in voice revenues.
As noted above, NCC does not believe that Taiwan’s operators will be able to follow the models their overseas counterparts have been pursuing to sustain growth – such as expanding overseas. pursuing acquisitions, or diversifying into original media content – due to Taiwanese operators’ relatively small size and regulatory restrictions.
“5G” terminals to be available 2nd half of 2019 in China; CCS Insight’s Mobile Phone Forecast
The first set of 5G end points, including data terminals, smartphones, tablets, and other products are expected to be released in China during the second half of 2019. That will lead to the commercialization of 5G technology in China, according to an official with the Ministry of Industry and Information Technology (MIIT), Xinhua news agency reported.
Wen Ku, director of the telecom development department at the Ministry of Industry and Information Technology, made the remarks as part of a timetable for 5G at the First Digital China Summit, which opened Sunday in Fuzhou, capital of Fujian province. “China started 5G research experiments in 2016, and entered the third stage of system verification this year,” Wen Ku said at the ongoing first Digital China Summit in Fuzhou, capital of east China’s Fujian Province. Wen noted that device manufacturers such as Huawei and Ericsson had participated in development of 5G products to help create a complete 5G industrial chain.
China has launched 5G cooperation mechanisms with Japan, South Korea, the European Union and the United States, with international companies joining the research and development, he noted.
Given the significantly greater speed — up to 10 gigabits per second — that 5G offers, the next-generation ultra-fast networks will see ways of life change more than in the 4G era, in virtually everything from how we “interact” with our cars to how we use the products in our homes.
In 2013, a working group focusing on 5G is established by the Ministry of Industry and Information Technology, the National Development and Reform Commission and the Ministry of Science and Technology.
At the beginning of 2016, China started its research on 5G technology. The country has finished two rounds of tests on 5G and is conducting a third round now. Initial 5G applications in China are set for 2019.
According to Beijing Youth Daily, China’s three major telecom operators including China Mobile, China Unicom and China Telecom have been approved to set up 5G networks in big cities.
- China Unicom will pilot 5G-technology in 16 cities including Beijing, Tianjin, Qingdao, Guiyang and Zhengzhou. China Unicom said it has started free chip upgrading for 2G users and cut 2G frequencies for the 5G network.
- China Mobile will launch offline testing in five cities in eastern and southern China, with each city installed with more than 100 5G stations as well as 5G application demonstrations in 12 cities.
- China Telecom has confirmed it will pilot 5G-technology in Xiong’an, Shanghai, Suzhou, Shenzhen, Chengdu and Lanzhou, and plans to expand the network to six more cities.
…………………………………………………………………………………………………………………………………………….
CCS Insight believes that manufacturers are increasingly looking to 5G technology to reignite growth in mature markets. Koytcheva comments, “The arrival of 5G handsets offers a glimmer of hope for embattled smartphone makers. They’re betting that this new, faster technology will give consumers a reason to upgrade their phones.”
However, Koytcheva cautions that phone-makers will have to be patient as they wait for this next wave of upgrade activity. “Although we expect the first 5G smartphones will hit the market in 2019, really significant demand won’t start until 2021, eventually having a positive impact in 2022, when we expect over 600 million 5G phones will be sold, accounting for 31 percent of the global market.”
CCS Insight also notes that while advanced markets are focused on the transition to 5G, consumers in emerging markets are taking up smartphones more slowly than previously expected. Koytcheva comments, “The rising cost of components for entry-level smartphones and the arrival of affordable feature phones that support 4G networks mean that many people who otherwise might have bought their first smartphone are sticking with a feature phone for now.”
The chart below provides a summary of CCS Insight’s mobile phone forecast.
Total shipments of mobile phones, 2013-2022

Source: CCS Insight Market Forecast: Mobile Phones Worldwide, 2018-2022
References:
Huawei Diminished Expectations for 5G; Struggles in U.S. vs Booming Business Elsewhere
He noted out that the full 3GPP Release 15 spec – which is expected in June this year – will only address part of future use cases for 5G, which is the enhanced mobile broadband for consumers.
[This author has repeatedly stated that 3GPP Release 16 and parts of Release 15 will be submitted to ITU-R WP5D as a candidate IMT 2020 RIT in July 2019 and NOT BEFORE THEN!]
Xu said the current 4G infrastructure is “pretty robust” and good enough to support most use cases and he doesn’t see many clear use cases or applications which can only be supported with 5G. Xu is not expecting 5G to be used for nationwide coverage in China (or any other country for that matter), at least to begin with. Instead, he expects 5G to be used for specific, more localized deployments where there is a need for increased speed and bandwidth.
However, he noted, this doesn’t mean it’s not worth investing in 5G. “If you’re not investing in 5G, your customers won’t invest in your 4G,” Xu said.
“It’s the same case for telecoms operators. They are driven by competition, if one telco in the market says, ‘I have 5G-enabled services,’ the other service providers will have to launch 5G, for marketing and branding reasons.”
Xu said Huawei will continue to be committed in 5G investment and the company’s progress in this area is quite “encouraging.”
“By the second half of this year we will launch end to end 5G solution to cater our operators customers who do have requirements for 5G. And we are going to launch 5G-capable smartphones in the third quarter of next year.”
………………………………………………………………………………………………………………..
Huawei’s Struggles in the U.S. vs. Booming Business Elsewhere
Huawei has failed to find a U.S. carrier to partner with for its smartphones, and the Federal Communications Commission this Tuesday approved a draft order that could damage Huawei’s existing business in telecom/network equipment. The order cited Huawei and its Chinese rival ZTE by name.
Huawei’s struggles in the United States are in contrast to its booming business in developing countries and growing presence in Europe, where it has been working on next-generation, or “5G,” wireless standards. The company’s profits rose 28.1 percent in 2017, boosted by strong enterprise and consumer sales and booming business overseas.
The recent setbacks have left Huawei’s future in the U.S. uncertain. Huawei recently let go of several American employees in their Washington D.C. office, including William Plummer, who spearheaded efforts to convince the U.S. to allow Huawei in for nearly a decade. Though Huawei declined to comment on the layoffs, the news was first reported by the New York Times and independently confirmed by the Associated Press.
Huawei and ZTE’s burgeoning 5G research is seen as a particular threat, as its expanded transmitting capabilities are seen as crucial for a host of emerging technologies based on artificial intelligence – including self-driving vehicles, robots and other machines that transmit vast amounts of data in real time.
Apart from expanding its influence in the ITU-R WP 5D, which develops cellular technology standards, Huawei joined forces with European companies to develop pseudo “5G” standards. In February, it completed the world’s first “5G” test call in partnership with London-based Vodafone.
Still, while Chinese trade relations with Europe remain calm, Washington has been warning officials in Canada and Australia about Huawei, raising questions about the company’s long-term global prospects.
“Huawei is perceived differently in Europe but that’s definitely a risk for the company,” said Thomas Husson, principal analyst at technology research firm Forrester. “Let’s not forget Europeans can still try to push in favor of European-based solutions from Nokia or Ericsson.”
CTIA Commissioned Study Finds China Ahead of South Korea and U.S. in race to 5G
China has moved slightly ahead of both South Korea and the U.S. in the race to deploy 5G, according to a new report by Analysys Mason. The countries were ranked based on nations’ respective 5G spectrum and infrastructure policies as well as commercial plans by their respective wireless sectors.
China leads the world in 5G readiness, followed by South Korea, the U.S. and Japan in that order, according to the report, which was commissioned by CTIA-the U.S. based trade organization for the wireless industry.
Analysis Mason found that all three major Chinese wireless network operators (China Telecom, China Mobile, and China Unicom) have committed to specific 5G launch dates. The government has also committed to providing at least 100 MHz of mid-band spectrum and 2,000 MHz of high-band spectrum for each operator.
In South Korea, the government is soon expected to free up a combined 1300 MHz of both mid-band 3.5-GHz and high-band 28-GHz spectrum, with an additional 2 GHz of high-band spectrum capable of being utilized for 5G.
While all major US wireless providers are trialing 5G technologies and a number have committed to small-scale fixed wireless 5G launches by the end of the year, the country has yet to announce plan to allocate mid-band spectrum exclusively for mobile by the end of 2020.
“The United States will not get a second chance to win the global 5G race,” CTIA president and CEO Meredith Attwell Baker said.
“Today’s research highlights the importance of policymaker action in 2018 to reform local zoning rules and unlock access to mid-band spectrum as part of a broader spectrum pipeline plan. I’m optimistic we will leapfrog China because key leaders in the Administration, on Capitol Hill, and at the FCC are focused on the reforms needed to win the race.”
In Japan, wireless providers are investing in 5G testing and regulators have committed to releasing mid- and high-band spectrum by early 2019.
In evaluating the current status of the global race to 5G, Analysys Mason studied 5G spectrum and infrastructure policies as well the commercial industry plans of ten countries.
Key findings by Analysys Mason include:
- All major Chinese providers have committed to specific launch dates and the government has committed to at least 100 MHz of mid-band spectrum and 2,000 MHz of high-band spectrum for each wireless provider.
- Countries around the world are moving quickly to make spectrum available for 5G. This year alone, the U.K., Spain, and Italy are all holding 5G spectrum auctions.
- At the end of 2018, the U.S. will rank sixth out of the 10 countries in mid-band (3– 24GHz) spectrum availability, a critical band for 5G. The U.S. joins Russia and Canada as the only countries currently without announced plans to allocate mid-band spectrum on an exclusive basis to mobile by the end of 2020.
- Countries like the U.K. and regions like the European Union are taking significant steps to modernize infrastructure rules to facilitate the deployment of 5G networks.
To understand the potential impact the race to 5G may have on America’s economy, Recon Analytics conducted an historical analysis of how winning and losing wireless leadership effected the economies of the U.S. and other nations.
“When countries lose global leadership in a generation of wireless, jobs are shed and technology innovation gets exported overseas,” said Roger Entner, Founder, Recon Analytics. “Conversely, leading the world in wireless brings significant economic benefits, as the U.S. has seen with its 4G leadership. These are the serious stakes that face American policymakers in the escalating global race to 5G.”
Findings from Recon Analytics include:
- Winning the race to 4G boosted America’s GDP by nearly $100B and our 4G launch spurred an 84% increase in wireless-related jobs – benefits that could have gone to other countries had the U.S. not led the world in 4G.
- U.S. 4G leadership helped secure leading positions in key parts of the global wireless ecosystem, including the app economy.
- Losing wireless leadership had long-term negative effects on Japan and Europe, contributing to job losses and the contraction of their domestic wireless industries.
To highlight the implications of these reports, CTIA is hosting the Race to 5G Summit on Thursday, April 19 in Washington, D.C. The summit will bring together leading policymakers and technology and wireless industry executives involved in shaping America’s 5G future.
Additional resources:
- Race to 5G Report: www.ctia.org/news/race-to-5g-report
- Race to 5G Facts and Figures: www.ctia.org/the-wireless-industry/the-race-to-5g
- Analysys Mason: Global Race to 5G – Spectrum and Infrastructure Plans and Priorities: www.ctia.org/news/global-race-to-5g-spectrum-and-infrastructure-plans-and-priorities
- Recon Analytics: How America’s 4G Leadership Propelled the U.S. Economy: www.ctia.org/news/how-americas-4g-leadership-propelled-the-u-s-economy
About the Analysys Mason Research
This research was commissioned by CTIA. Analysys Mason compared 5G spectrum and infrastructure policies proposed in markets worldwide to advance 5G technology and facilitate successful network deployment, and to prepare a readiness comparison between markets.
About Analysys Mason
Analysys Mason is a global consultancy and research firm specialising in telecoms, media and technology for more than 30 years. Our consulting and research expertise in telecoms, media and technology underpins everything we do to help change our clients’ businesses for the better. Since 1985, Analysys Mason’s consulting and analyst teams have played an influential role in key industry milestones and helping clients around the world through major shifts in the market. Our consulting and research divisions continue to be at the forefront of developments in digital services and transformation are advising clients on new business strategies to address disruptive technologies. Our experts located in offices around the world provide local perspective on global issues.
About the Recon Analytics Research
This research was commissioned by CTIA. This is the fifth report over the last thirteen years that Recon Analytics has authored on the impact of the wireless industry on the U.S. economy. Building on the same consistent framework, these reports have documented how the U.S. wireless industry has revolutionized society and the U.S. economy, relying on extensive primary and secondary research for these studies.
About Recon Analytics: The mission of Recon Analytics is to clear the clutter, help focus executives and policymakers on what is actually happening in the marketplace and what really matters, and make a positive impact on business and policy decisions. Founded and led by leading telecom analyst Roger Entner, Recon Analytics’ approach is bolstered by its industry-first executive advisory board, which helps us hone our strategy, improve our research, and provide unparalleled insights into the matters most relevant to the business and the public policies impacting it. With this foundation, Recon Analytics focuses on three core areas: Syndicated research, custom consulting, policy related data analysis, as well as white papers.
About CTIA
CTIA® (www.ctia.org) represents the U.S. wireless communications industry and the companies throughout the mobile ecosystem that enable Americans to lead a 21st century connected life. The association’s members include wireless carriers, device manufacturers, suppliers as well as apps and content companies. CTIA vigorously advocates at all levels of government for policies that foster continued wireless innovation and investment. The association also coordinates the industry’s voluntary best practices, hosts educational events that promote the wireless industry and co-produces the industry’s leading wireless tradeshow. CTIA was founded in 1984 and is based in Washington, D.C.
Huawei’s growth due to increased smartphone sales (but not in U.S.); China to lead world in 5G handsets
In an annual business report meeting with journalists in late March at the company’s Shenzhen, China headquarters, Huawei reported that its total revenue grew 15.7%, to $92.5 billion, in 2017. More impressive, net profit grew 28.1%, to $7.3 billion, a huge improvement over 2016’s 0.4% rate. Privately owned Huawei gets most of its revenue now from selling telecom/network equipment, which generated roughly $47 billion over the past year. While that was only a 3% growth rate, the Chinese company enjoyed a 35.1% growth in its enterprise business unit, which includes cloud computing and big data, though the overall revenue of $8.7 billion is relatively small.
Until 2020 (or later), when”5G” is deployed by carriers using Huawei base stations, the company’s fastest growing and most visibly prominent area is and will be its smartphones.
Huawei’s Deputy Chairwoman and Chief Financial Officer Sabrina Meng, along with CEO Ken Hu, recently told reporters how the company managed to increase net profits and net profit margins at a rate higher than total revenue growth. The company became more efficient at growing smartphone sales. “In 2016, one of the biggest areas that dragged consumer business group profits down were the high cost of components,” said Meng. “So we developed a better supply management chain and improved our working relationships with vendors.” Hu added that whether it’s brand image with consumers or phone units sold, Huawei made significant improvements in 2017. According to data released to the media, Huawei and sub-brand Honor combined to sell 153 million handsets in 2017, generating $37.85 billion in sales. The smartphone market is arguably the most competitive industry in all of consumer business with many players jockeying for a small market share behind kingpins Samsung and Apple.
………………………………………………………………………………………………………………………………………………………………………………………………………………………………………………………………….
Ben Sin of Forbes recently wrote, “the Huawei P20 Pro is the new low light photography king (of smartphones), and it’s not even close right now.” It’s even better than the Samsung Galaxy S9+ which received excellent reviews from journalists that tested it. The Huawei P20 Pro. Photo courtesy of Forbes.com:
The Huawei P20 Pro has a 6.1-inch display with an 18.7:9 aspect ratio. The screen’s unusually tall aspect ratio makes the phone very easy to hold and reach across, and the panel is an OLED from Samsung, so it’s very good. The resolution here is just 1080p so technically it isn’t as crisp as the Quad HD found on other Android flagships, but frankly it doesn’t matter. What does matter is that the OLED panel on the P20 Pro just doesn’t get as bright as the panel on the Galaxy S9. I suspect Huawei’s Samsung OLED panel is a generation behind the ones used on the S9. The back of the handset is crafted out of glass, and it attracts fingerprints just as much as Samsung or LG phones. The P20 Pro ships in colors that are a bit different from the norm, including an eye-catching Twilight color with a gradient finish. The phone also comes in black or this pinkish gold color.
The triple camera set-up includes: a 40-megapixel RGB lens, 20-megapixel monochrome lens, and an 8-megapixel telephoto lens. Huawei has used the RGB+monochrome combo for its phones since 2016, so the new addition here is the telephoto lens, which offer lossless optical zoom. The optical lens is a 3X zoom compared to the Apple iPhone X’s 2X zoom.
………………………………………………………………………………………………………………………………………………………………………………………………………………………………………………………………….
U.S. Market Difficult to Enter for Huawei, ZTE and other China based Companies:
As the U.S. government, and more recently AT&T and Verizon, have taken numerous steps over the years to prevent Huawei from entering its market. Xiang Ligang, a telecom veteran and CEO of the industry website Cctime, said it has become increasingly challenging for Chinese telecom companies to do business in the U.S. amid heightened concerns over national security.
“The U.S. is a market Chinese companies must conquer if they want to become global players. But now politics rather than technology or products is playing a bigger role in their business prospects in the U.S.,” Xiang said. He also opined that China’s handset producers have an edge in developing 5G terminal devices compared with their U.S. competitors. “In terms of the research and innovation ability, the global top four telecom equipment suppliers are Huawei, Ericsson, ZTE and Nokia… two out of the four are Chinese technology giants and we could barely name a U.S. company,” he said. “Without 5G-capable terminal devices, you cannot access a 5G network.” Xiang believes this year will be a watershed for China’s 5G technology development. He thinks the final testing of “basic 5G” technologies will be completed (this author disagrees and things that won’t be before 2021), paving the way for the next phase of development – 5G products such as terminal devices (e.g. smartphones, other handsets, IoT devices, etc).
In addition to compatible terminal devices, China’s investment in 5G infrastructure also bodes well for its position in the intensifying global competition. Under the guidelines of the National Development and Reform Commission, the country’s three State-owned network operators – China Mobile, China Unicom and China Telecom – have each announced plans to begin building 5G networks this year in at least five cities. China Mobile said in February that it may be able to offer a full 5G service by the end of 2019, a year ahead of the 2020 goal, thanks to a technology known as “slicing packet networks,” which help operators to manage network architectures, bandwidth, traffic, latency and time synchronization, said another Xinhua report.
Huawei, failed to get its smartphones sold in the local carrier retailing channel, which accounts for a majority of smartphone sales in the US. Verizon Communications Inc has dropped all plans to sell Huawei’ s phones, while AT&T Inc also walked away from a similar deal at the last minute under pressure from the U.S. government, according to a Bloomberg report.
…………………………………………………………………………………………………………………………………………………………………………………………………………………………………………………………………………..
Sidebar: Top Smartphone Makers
Currently, Chinese companies account for 7 of the world’s top 10 smartphone vendors (see top 10 below), but in the U.S., only one Chinese brand stood out – ZTE Corp grabbing a market share of 12 percent. “Such contrast is a result of multiple factors, and political concern is certainly one of them,” Xiang said. As a result, Huawei will likely focus on increasing smartphone sales in Asia, Europe and Latin America.
According to marketing91, the top 10 smart phone makers in 2017 were: 1) Samsung 2) Apple 3) Huawei 4) Lenovo 5) Xiaomi 6) LG 7) ZTE 8) Oppo 9) Alcatel 10) Vivo
……………………………………………………………………………………………………………………………………………………………………………………………………………………………………………………………………………
Looking for Future Growth:
This year marks Huawei‘s 30th birthday. Following the general Chinese idea that age 30 is when a boy truly becomes a man, the company is looking for new growth opportunities.
“As we look to 2018, emerging technologies like the Internet of Things, cloud computing, artificial intelligence and 5G will soon see large-scale application,” said Hu. “Throughout this process, Huawei will . . . pay special attention to the practical challenges that our customers face as they go digital. Our job is to help them overcome these challenges and achieve business success. Ultimately, we aim to bring digital to every person, home and organization for a fully connected, intelligent world.”
xRAN Forum approves Fronthaul Interface Specification for NexGen Open RAN architecture
Executive Summary:
On April 12th, the xRAN Forum (xRAN.org) announced the public availability of the xRAN Fronthaul Specification Version 1.0 – the first specification made publicly available from xRAN since its launch in October 2016. The specification was said to permit “a wide range of vendors to develop innovative, best-of-breed RRUs (remote radio unit) and BBUs (base band units) for a wide range of deployment scenarios, which can be easily integrated with virtualized infrastructure and management systems using standardized data models.”
Why is a new RAN architecture needed?
Current RAN architectures result in sub-optimal use of scarce spectrum and radio resources as well as make it hard for operators to program them quickly to meet emerging customer needs. Amid exploding demand for bandwidth and intense demands from new services, carriers need an alternative approach to address the escalating capital and operational costs of the existing design as well as make the network more agile to deploy new services.
Why It’s Important:
The new specification was said to “deliver on important operator member requirements.” It defines open interfaces between the remote radio unit/head (RRU/RRH), the baseband unit (BBU) and the operation and management (OAM) interface to simplify interoperability between suppliers. It’s significant because traditionally, the RRU and BBU had to come from the same vendor. By complying with this spec, different vendors (best of breed?) could provide each of those pieces of equipment. The desired outcome is for a wireless network operator to buy an RRU from one vendor and a BBU from another vendor such that they’ll work together via a common interface. Some say it’s going to bust up the old “cartel” of RRU/BBU suppliers.
The xRAN Fronthaul spec was said to address several key operator-defined requirements, including:
• BBU – RU interoperability based on well specified control, user and management plane interfaces.
• Efficient bandwidth scaling as a function of user throughput and spatial layers to address
increasing bandwidth needs and Massive MIMO deployments.
• Support for LTE, NR, associated features, 2T – 8T RU products and Massive MIMO beamforming
antenna systems.
• Advanced receivers and co-ordination functions.
• Ethernet based transport layer solutions.
• Extensible data models for management functions to simplify integration.
The xRAN Forum Front Haul Working Group is chaired by Verizon. A spokeswoman for Verizon, told Lightreading in an email that the xRAN spec defines an “open Internet-based standard on which future RAN products will be built,” while ORAN is an effort to “ensure various proprietary CPRI-based systems can understand one another’s languages and operations.”
Note: CPRI (Common Public Radio Interface) defines the interface between Radio Equipment Controllers (REC) and Radio Equipment (RE) such that multiple vendors can provide different parts of a base station.
Selected Quotes:
“Our vision to develop, standardize and promote an open alternative to the traditionally closed, hardwarebased RAN architecture is becoming a reality,” said Dr. Sachin Katti, Professor at Stanford University and Director of the xRAN Forum. “Our operator members have been very focused and clear on requirements and our ecosystem of contributing members have risen to the challenge. The Fonthaul Specification is the first of several open interface specifications we expect to be released in 2018.”
“The release of the xRAN Fronthaul Specification is a groundbreaking advancement toward enabling an open RAN architecture to support next-generation products and services,” said Bill Stone, Vice President, Network Technology Development and Planning at Verizon. “xRAN compliant radios coupled with virtualized basebands provide much needed flexibility to support rapid development and deployment of RAN products. By adopting xRAN specifications, we will be able to speed innovation, increase collaboration, and be more agile to a quickly evolving market.”
“We are pleased to have worked with xRAN members in reaching the key milestone of delivering the first open xRAN fronthaul specification,” said Dr. Hiroshi Nakamura, EVP and CTO of NTT DOCOMO. “We believe that the completion and publication of this specification will contribute in further advancing the RAN and in expanding the ecosystem in the 5G era. DOCOMO will keep contributing to this activity with the experience we had in realizing multi-vendor interoperable RAN with our partners using common interfaces for our LTE network.”
“The xRAN Fronthaul Specification is a foundational component in the xRAN architectural vision and vital to accelerating the worldwide deployment of next-generation RAN infrastructure network operators demand,” said Alex Jinsung Choi, SVP Research & Technology Innovation, Deutsche Telekom. “Going forward, by connecting these specification activities to the broad architectural scope in ORAN, we can ensure the implementations across a wider community of suppliers to promote both innovation and open market competition.”
“xRAN’s release of this jointly-developed open specification creates the first wave of a positive sea change for our industry, transforming the way next-generation RAN infrastructure will be built, managed and optimized,” said Andre Fuetsch, CTO and President AT&T Labs. “Equipment that supports open specifications from xRAN (and ORAN in the future), combined with increasing RAN virtualization and data-driven intelligence, will allow carriers to reduce complexity, innovate more quickly and significantly reduce deployment and operational costs.”

The specification is designed to allow for a range of vendors to develop best-of-breed RRUs and BBUs for various deployment scenarios. (Pixabay)
About xRAN Forum:
The xRAN Forum was formed to develop, standardize and promote an open alternative to the traditionally closed, hardware-based RAN architecture. xRAN fundamentally advances RAN architecture in three areas – decouples the RAN control plane from the user plane, builds a modular eNB software stack that operates on common-off-the-shelf (COTS) hardware and publishes open north- and south-bound interfaces to the industry.
xRAN Forum operator members include: AT&T, Verizon and Deutsche Telekom, KDDI, NTT DoCoMo, SK Telecom and Telstra. The vendor and academic community is also represented in the xRAN Forum by AltioStar, Amdocs, Aricent, ASOCS, Blue Danube, Ciena, Cisco, CommScope, Fujitsu, Intel, Mavenir, NEC, Netsia, Nokia, Radisys, Samsung, Stanford University, Texas Instruments and University of Sydney.
References:
http://www.xran.org/resources/
