

Telegeography: Global internet bandwidth rose by 28% in 2022
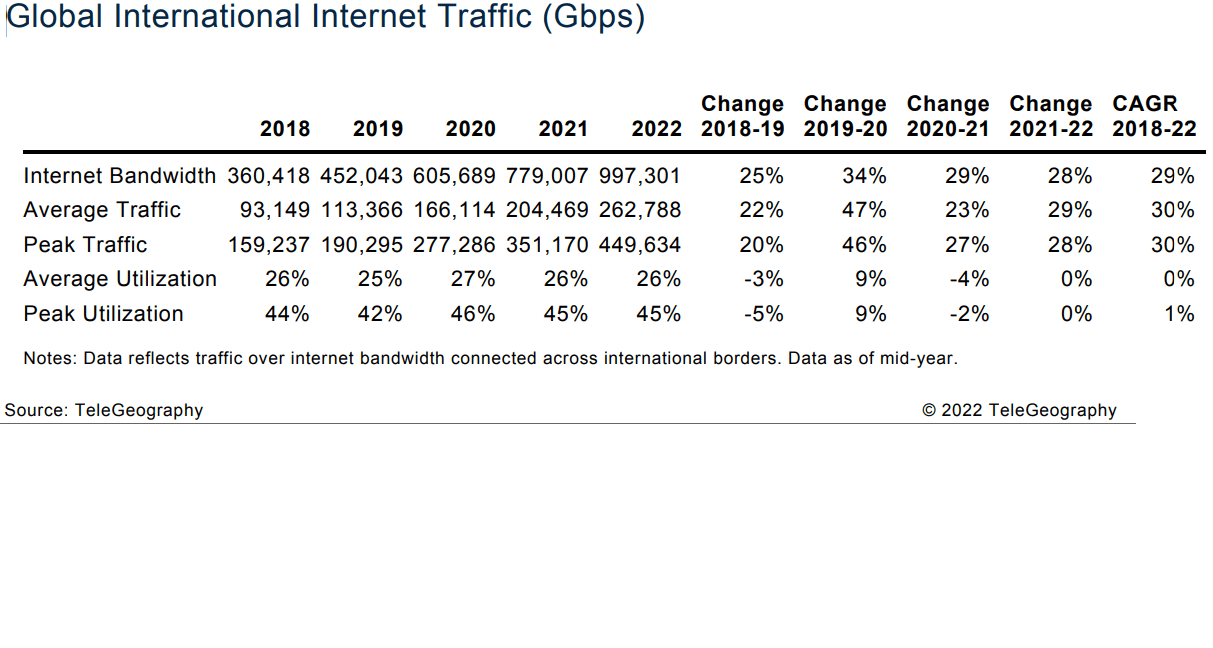
According to Telegeography, Global internet bandwidth rose by 28% in 2022, continuing the return to “normal” from the pandemic-generated bump of 2020.
Total international bandwidth now stands at 997 Tbps, representing a 4-year CAGR of 29%. COVID bump aside, the pace of growth has been slowing. Still, we do see a near tripling of bandwidth since 2018.
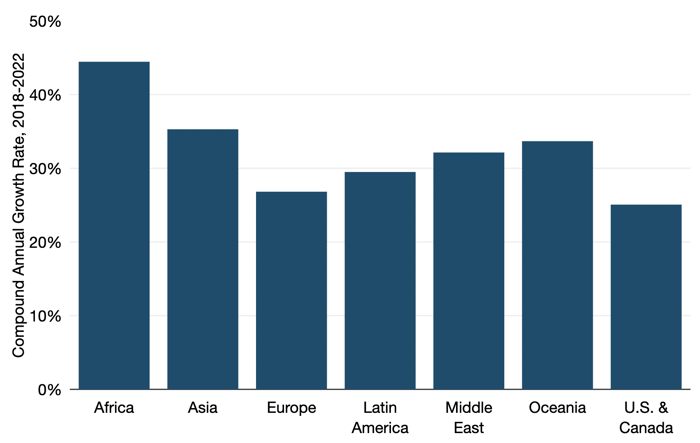
Strong capacity growth is visible across regions. Africa experienced the most rapid growth of international internet bandwidth, growing at a compound annual rate of 44% between 2018 and 2022. Asia is behind Africa, rising at a 35% compound annual rate during the same period.
Source: Telegeography
Both average and peak international internet traffic increased at a compound annual rate of 30% between 2018 and 2022—slightly above the 29% compounded annual growth rate in bandwidth over the same period. All the stay-at-home activity associated with COVID-19 resulted in a spike in traffic from 2019 to 2020. Average traffic growth dropped from 47% between 2019-2020 to 29% between 2021-2022, while peak traffic growth dropped from 46% to 28% over the same time period.
Prices for Internet Service:
ISPs shift to predominantly 100 Gbps internet backbones continues to reduce the average cost of carrying traffic and enables profitability at lower prices. As a result, price erosion remains the universal norm. It reflects the introduction of competition into new markets and the response of more expensive carriers to lower prices. Trends in the IP transit market generally follow regional trends of the transport market. And while some have suggested that price erosion may slow as a result of recent inflation and supply chain constraints (as it has in the wavelength market), we have not seen this trend make its way into the IP transit market.
Across the cities included in the figure below, 10 GigE prices fell 16% compounded annually from Q2 2019 to Q2 2022. Over the same period 100 GigE port prices fell 25%. In Q2 2022, the lowest 10 GigE prices on offer were at the brink of $0.09 per Mbps per month. The lowest for 100 GigE were $0.06 per Mbps per month.
The sharper decline in 100 GigE reflects the advanced maturity of 10 GigE, as well as more carriers offering it and more competition. While 10 GigE remains a relevant increment of IP transit, particularly in more emerging markets, its share of the transaction mix continues to yield to 100 GigE. In 2022, providers indicated that a majority of their sales mix in key U.S. and European hubs was now 100 GigE. On average, across the cities noted, the Monthly Recurring Charge (MRC) for a 100 GigE port was 6.7 times the MRC for a 10 GigE port. Operators are poised to adopt 400 GigE IP transit ports as the next fundamental upgrade from multiple 100 GigE ports.
Outlook:
The combined effects of new internet-enabled devices, growing broadband penetration in developing markets, higher broadband access rates, and bandwidth-intensive applications will continue to fuel strong internet traffic growth. While end-user traffic requirements will continue to rise, not all of this demand will translate directly into the need for new long-haul capacity.
A variety of factors shape how the global internet will develop in coming years:
• Post-COVID-19 growth trajectory. Initial evidence suggests that the spike in the rate of bandwidth and traffic growth in 2020 from the pandemic was a one-time event and we have largely returned to more traditional rates of growth. Operators we spoke to indicated they no longer see the pandemic leading to upward adjustments to their demand forecasts.
• IP Transit Price Erosion. International transport unit costs underlay IP transit pricing. As new international networks are deployed, operational and construction costs are distributed over more fiber pairs and more active capacity, making each packet less expensive to carry.
• We already see a major shift from 10 GigE requirements to 100 GigE requirements and expect that 400 GigE will emerge in two to three years as a significant part of the market.
• The introduction of new international infrastructure also creates opportunities for more regional localization of content and less dependence on distant hubs. As emerging markets grow in scale, they too will benefit from economies of scale, even if only through cheaper transport to internet hubs.
• International versus domestic. While there’s little doubt that enhanced end-user access bandwidth and new applications will create large traffic flows, the challenge for operators will be to understand how much of this growth will require the use of international links. In the near-term, the increased reliance on direct connections to content providers and the use of caching will continue to have a localizing effect on traffic patterns and dampen international internet traffic growth.
• Bypassing the public internet. The largest content providers have long operated massive networks, these companies continue to experience more rapid growth than internet backbones and they are expanding into new locations. Many other companies, such as cloud service providers, CDNs, and even some data center operators, are also building their own private backbones that bypass the public internet. As a result, a rising share of international traffic may be carried by these networks.
References:
https://blog.telegeography.com/internet-traffic-and-capacity-remain-brisk
