

Internet traffic and bandwidth
Ookla Ranks Internet Performance in the World’s Largest Cities: China is #1
Internet connectivity benchmarking firm Ookla, which maintains the popular Speedtest.net service, has updated their ranking of broadband performance in countries around the world to include internet speed rankings for some of the “world’s largest cities.” Ookla’s new list ranks median internet download speeds in nearly 200 cities all over the world.
Overall, China topped the list with Shanghai as the fastest city on their list for mobile broadband with a median download speed of 158.63Mbps (24.32Mbps upload and 17ms latency), while Beijing was fastest for fixed broadband during September 2022 at 238.86Mbps (37.75Mbps upload and 7ms latency).
Beijing (China) and Valparaiso (Chile) were ranked highest in the fixed broadband category, with average speeds of 239 Mbps and 223 Mbps, respectively, followed by Shanghai (222 Mbps), New York (218 Mbps), Bangkok (217 Mbps) and Madrid (197 Mbps).
Fastest Broadband Speeds for the World’s Largest Cities 2022
| Fastest Cities for Mobile (Mbps) | Fastest Cities for Fixed Broadband (Mbps) | ||
| Shanghai, China | 158.63 | Beijing, China | 238.86 |
| Copenhagen, Denmark | 157.54 | Valparaíso, Chile | 222.67 |
| Oslo, Norway | 155.19 | Shanghai, China | 221.85 |
| Busan, South Korea | 147.55 | New York, United States | 218.04 |
| Beijing, China | 145.76 | Bangkok, Thailand | 217.19 |
| Sofia, Bulgaria | 145.28 | Madrid, Spain | 196.7 |
| Ar-Rayyan, Qatar | 140.69 | Bucharest, Romania | 195.6 |
| Abu Dhabi, United Arab Emirates | 137.48 | Lyon, France | 193.34 |
| Dubai, United Arab Emirates | 135.52 | Chon Buri, Thailand | 188.25 |
| Riyadh, Saudi Arabia | 133.65 | Tokyo, Japan | 185.04 |
| Stockholm, Sweden | 126.4 | Los Angeles, United States | 184.15 |
| Antwerp, Belgium | 121.33 | Geneva, Switzerland | 182.84 |
| Gothenburg, Sweden | 120.71 | Abu Dhabi, United Arab Emirates | 178.17 |
| Doha, Qatar | 114 | Zürich, Switzerland | 177.6 |
| Seoul, South Korea | 113.36 | Santiago, Chile | 176.58 |
| Melbourne (Greater), Australia | 111.78 | Copenhagen, Denmark | 175.31 |
| Sydney, Australia | 108.04 | Barcelona, Spain | 173.71 |
| New York, United States | 106.57 | Osaka, Japan | 169.18 |
| Rotterdam, Netherlands | 100.85 | Toronto, Canada | 164.93 |
| Skopje, North Macedonia | 99.02 | Paris, France | 155.24 |
| Toronto, Canada | 98.29 | Auckland, New Zealand | 149.22 |
| Amsterdam, Netherlands | 96.79 | Budapest, Hungary | 147.82 |
| Los Angeles, United States | 95.4 | Taipei, Taiwan | 144.35 |
| Zürich, Switzerland | 89.17 | Kraków, Poland | 138.75 |
| Montreal, Canada | 84.25 | Warsaw, Poland | 138.64 |
| Helsinki, Finland | 83.57 | São Paulo, Brazil | 124.05 |
| Zagreb, Croatia | 82.36 | Dubai, United Arab Emirates | 118.99 |
| Muscat, Oman | 79.66 | New Taipei, Taiwan | 115.36 |
| Auckland, New Zealand | 77.91 | Gothenburg, Sweden | 111.29 |
| Lisbon, Portugal | 76.23 | Porto, Portugal | 110.91 |
| Manama, Bahrain | 72.72 | Stockholm, Sweden | 109.59 |
| Kuwait City, Kuwait | 72.61 | Haifa, Israel | 108.46 |
| Porto, Portugal | 72.16 | Seoul, South Korea | 106.48 |
| Paris, France | 72.12 | Chisinau, Moldova | 105.05 |
| Jeddah, Saudi Arabia | 71.92 | Panama City, Panama | 104.25 |
| Geneva, Switzerland | 70.88 | Oslo, Norway | 102.76 |
| Berlin, Germany | 70.02 | Montevideo, Uruguay | 102.57 |
| Vilnius, Lithuania | 67.7 | Rio de Janeiro, Brazil | 100.49 |
| Manchester, United Kingdom | 67.07 | Amsterdam, Netherlands | 99.66 |
| London, United Kingdom | 66.36 | Milan, Italy | 98.57 |
| Taipei, Taiwan | 65.18 | Rotterdam, Netherlands | 95.39 |
| Vienna, Austria | 65.08 | Kuwait City, Kuwait | 94.65 |
| New Taipei, Taiwan | 64.69 | Medellín, Colombia | 94.48 |
| Brussels, Belgium | 58.78 | Busan, South Korea | 94.43 |
| Rio de Janeiro, Brazil | 58.64 | Bogotá, Colombia | 94.38 |
| Athens, Greece | 57.23 | Vilnius, Lithuania | 94.28 |
| Hamburg, Germany | 56.77 | Ar-Rayyan, Qatar | 94.16 |
| São Paulo, Brazil | 56.58 | Riyadh, Saudi Arabia | 93.71 |
| Thessaloniki, Greece | 56.57 | Lisbon, Portugal | 93.13 |
| Lyon, France | 56.08 | Dublin, Ireland | 91.63 |
| Prague, Czechia | 55.25 | Moscow, Russia | 91.26 |
| Belgrade, Serbia | 53.27 | Riga, Latvia | 91.14 |
| Bucharest, Romania | 52.03 | Montreal, Canada | 90.06 |
| Osaka, Japan | 51.53 | Kuala Lumpur, Malaysia | 89.38 |
| Milan, Italy | 51.27 | Vienna, Austria | 88.05 |
| Budapest, Hungary | 49.88 | Belgrade, Serbia | 87.88 |
| Tokyo, Japan | 49.86 | Antwerp, Belgium | 87.17 |
| Riga, Latvia | 45.88 | Berlin, Germany | 86.65 |
| Kraków, Poland | 44.42 | Doha, Qatar | 86.62 |
| Warsaw, Poland | 43.48 | Hamburg, Germany | 85.35 |
| Barcelona, Spain | 42.88 | Johor Bahru, Malaysia | 85.03 |
| Rabat, Morocco | 41.98 | Tel Aviv-Yafo, Israel | 84.96 |
| Madrid, Spain | 40.78 | Ho Chi Minh City, Vietnam | 84.32 |
| Johannesburg, South Africa | 40.38 | Helsinki, Finland | 84.11 |
| Hanoi, Vietnam | 40.01 | Saint Petersburg, Russia | 83.33 |
| Rome, Italy | 40 | Amman, Jordan | 80.37 |
| Dublin, Ireland | 39.96 | Kiev, Ukraine | 77.42 |
| Bangkok, Thailand | 39.3 | Jeddah, Saudi Arabia | 76.81 |
| Haifa, Israel | 39.05 | Davao City, Philippines | 75.23 |
| Chon Buri, Thailand | 39.03 | Asuncion, Paraguay | 74.18 |
| Baku, Azerbaijan | 37.12 | London, United Kingdom | 73.93 |
| Tbilisi, Georgia | 37.08 | Hanoi, Vietnam | 73.67 |
| Chisinau, Moldova | 36.3 | Sofia, Bulgaria | 73.66 |
| Ho Chi Minh City, Vietnam | 36.09 | Manila, Philippines | 73.47 |
| Johor Bahru, Malaysia | 35.67 | Manchester, United Kingdom | 73.43 |
| Cape Town, South Africa | 35.42 | Port of Spain, Trinidad and Tobago | 73.2 |
| Ankara, Turkey | 35.27 | Brussels, Belgium | 71.71 |
| Montevideo, Uruguay | 34.82 | Buenos Aires, Argentina | 71.41 |
| Istanbul, Turkey | 34.7 | Muscat, Oman | 69.46 |
| Tehran, Iran | 34.24 | Az-Zarqa, Jordan | 67.53 |
| Guadalajara, Mexico | 32.77 | Kharkiv, Ukraine | 67.05 |
| Mashhad, Iran | 32.71 | Rome, Italy | 64.92 |
| Beirut, Lebanon | 32.35 | Zagreb, Croatia | 63.92 |
| Tel Aviv-Yafo, Israel | 31.69 | Delhi, India | 63.2 |
| Kharkiv, Ukraine | 31.06 | San José, Costa Rica | 61.44 |
| Yangon, Myanmar (Burma) | 30.98 | Prague, Czechia | 60.67 |
| Casablanca, Morocco | 30.84 | Mexico City, Mexico | 59.56 |
| Mosul, Iraq | 30.77 | Minsk, Belarus | 59.14 |
| Sfax, Tunisia | 30.74 | Maracaibo, Venezuela | 57.31 |
| Kuala Lumpur, Malaysia | 30.1 | Guadalajara, Mexico | 55.63 |
| Kingston, Jamaica | 29.89 | Lima, Peru | 53.68 |
| Moscow, Russia | 29.74 | Sydney, Australia | 53.64 |
| Baghdad, Iraq | 29.62 | Melbourne (Greater), Australia | 53.45 |
| Mexico City, Mexico | 28.28 | Arequipa, Peru | 53.4 |
| Mandalay, Myanmar (Burma) | 28.21 | Gomel, Belarus | 52.91 |
| Samarkand, Uzbekistan | 28.2 | Ulaanbaatar, Mongolia | 52.79 |
| Vientiane, Laos | 28.15 | Kathmandu, Nepal | 52.68 |
| Kiev, Ukraine | 28.15 | Guayaquil, Ecuador | 51.87 |
| Guatemala City, Guatemala | 27.89 | Johannesburg, South Africa | 51.79 |
| Buenos Aires, Argentina | 26.49 | Córdoba, Argentina | 51.67 |
| Almaty, Kazakhstan | 26.44 | Alexandria, Egypt | 51.07 |
| Manila, Philippines | 26.16 | Nur-Sultan, Kazakhstan | 50.05 |
| Tunis, Tunisia | 25.87 | Skopje, North Macedonia | 48.09 |
| Córdoba, Argentina | 25.3 | Bishkek, Kyrgyzstan | 47.85 |
| Valparaíso, Chile | 24.16 | Manama, Bahrain | 47.69 |
| Yerevan, Armenia | 23.98 | Quito, Ecuador | 47.36 |
| Tegucigalpa, Honduras | 23.93 | Almaty, Kazakhstan | 47.21 |
| Luanda, Angola | 23.93 | Tashkent, Uzbekistan | 46.27 |
| San Pedro Sula, Honduras | 23.83 | Kingston, Jamaica | 45.75 |
| Santo Domingo, Dominican Republic | 23.81 | Thessaloniki, Greece | 44.35 |
| Santiago De Los Caballeros, Dominican Republic | 23.64 | Mumbai, India | 43.56 |
| Saint Petersburg, Russia | 21.19 | Ouagadougou, Burkina Faso | 43.14 |
| San Salvador, El Salvador | 20.58 | Managua, Nicaragua | 42.68 |
| Alexandria, Egypt | 20.46 | Dhaka, Bangladesh | 40.38 |
| Cairo, Egypt | 20.43 | Yerevan, Armenia | 40.34 |
| Az-Zarqa, Jordan | 20.4 | Athens, Greece | 40 |
| Davao City, Philippines | 20.35 | Cape Town, South Africa | 39.5 |
| Amman, Jordan | 20.13 | Abidjan, Côte d’Ivoire | 38.44 |
| Kampala, Uganda | 20.01 | Ankara, Turkey | 37.42 |
| Santiago, Chile | 19.87 | Istanbul, Turkey | 36.75 |
| Nur-Sultan, Kazakhstan | 19.79 | Libreville, Gabon | 36.13 |
| Phnom Penh, Cambodia | 18.94 | Tegucigalpa, Honduras | 33.55 |
| Quito, Ecuador | 18.89 | Antananarivo, Madagascar | 33.34 |
| Lagos, Nigeria | 18.85 | Chittagong, Bangladesh | 33.02 |
| Managua, Nicaragua | 18.64 | Lome, Togo | 31.97 |
| Bishkek, Kyrgyzstan | 18.37 | Samarkand, Uzbekistan | 31.58 |
| Addis Ababa, Ethiopia | 17.29 | San Pedro Sula, Honduras | 31.53 |
| Abidjan, Côte d’Ivoire | 17.22 | San Salvador, El Salvador | 31.36 |
| San José, Costa Rica | 17.21 | Santo Domingo, Dominican Republic | 30.87 |
| Nairobi, Kenya | 17.09 | Pointe-Noire, Congo | 30.11 |
| Colombo, Sri Lanka | 16.95 | Guatemala City, Guatemala | 29.53 |
| Tashkent, Uzbekistan | 16.69 | Vientiane, Laos | 29.04 |
| Guayaquil, Ecuador | 16.6 | Accra, Ghana | 28.71 |
| Bekasi, Indonesia | 16.47 | Baku, Azerbaijan | 28.69 |
| Misrata, Libya | 16.46 | Brazzaville, Congo | 27.55 |
| South Jakarta, Indonesia | 16.14 | Bekasi, Indonesia | 27.04 |
| Dakar, Senegal | 16.13 | South Jakarta, Indonesia | 27 |
| Asuncion, Paraguay | 15.93 | Santa Cruz de la Sierra, Bolivia | 26.28 |
| Ulaanbaatar, Mongolia | 15.8 | Tbilisi, Georgia | 26.12 |
| Panama City, Panama | 15.75 | Bamako, Mali | 24.37 |
| Oran, Algeria | 15.57 | Dakar, Senegal | 23.41 |
| Lahore, Pakistan | 15.01 | La Paz, Bolivia | 23.25 |
| Delhi, India | 14.99 | Cairo, Egypt | 22.42 |
| Dhaka, Bangladesh | 14.98 | Nouakchott, Mauritania | 21.75 |
| Kathmandu, Nepal | 14.94 | Baghdad, Iraq | 21.58 |
| Lima, Peru | 14.65 | Casablanca, Morocco | 20.23 |
| Dar es Salaam, Tanzania | 14.51 | Phnom Penh, Cambodia | 19.78 |
| Arequipa, Peru | 13.5 | Dushanbe, Tajikistan | 19.61 |
| Algiers, Algeria | 13.49 | Mandalay, Myanmar (Burma) | 19.37 |
| Damascus, Syria | 12.83 | Yangon, Myanmar (Burma) | 19.03 |
| Tripoli, Libya | 12.36 | Rabat, Morocco | 17.57 |
| Mumbai, India | 12.29 | Colombo, Sri Lanka | 16.65 |
| Bogotá, Colombia | 11.99 | Cotonou, Benin | 15.97 |
| Karachi, Pakistan | 11.92 | Karachi, Pakistan | 14.82 |
| Minsk, Belarus | 11.33 | Port-au-Prince, Haiti | 14.7 |
| La Paz, Bolivia | 10.76 | Luanda, Angola | 14.18 |
| Khartoum, Sudan | 10.66 | Mombasa, Kenya | 14.08 |
| Medellín, Colombia | 10.4 | Dar es Salaam, Tanzania | 13.74 |
| Santa Cruz de la Sierra, Bolivia | 10.07 | Mosul, Iraq | 12.43 |
| Sana’a, Yemen | 9.96 | Lagos, Nigeria | 12.22 |
| Aleppo, Syria | 9.18 | Oran, Algeria | 12.09 |
| Chittagong, Bangladesh | 8.84 | Tehran, Iran | 11.9 |
| Dushanbe, Tajikistan | 8.83 | Algiers, Algeria | 11.87 |
| Gomel, Belarus | 8.72 | Santiago De Los Caballeros, Dominican Republic | 11.71 |
| Maracaibo, Venezuela | 7.75 | Lahore, Pakistan | 10.88 |
| Caracas, Venezuela | 7.16 | Kampala, Uganda | 10.6 |
| Accra, Ghana | 6.41 | Kigali, Rwanda | 9.65 |
| Kabul, Afghanistan | 5.15 | Nairobi, Kenya | 9.58 |
| Port-au-Prince, Haiti | 4.82 | Lusaka, Zambia | 9.12 |
| Havana, Cuba | 4.51 | Tunis, Tunisia | 8.54 |
North America
- United States: T-Mobile was the fastest mobile operator with a median download speed of 116.14 Mbps. Spectrum was fastest for fixed broadband at 211.66 Mbps.
- Canada: TELUS was the fastest mobile operator in Canada with a median download speed of 76.03 Mbps. Rogers was fastest for fixed broadband (223.89 Mbps).
- Mexico: Telcel had the fastest median download speed over mobile at 36.07 Mbps. Totalplay was fastest for fixed broadband at 74.64 Mbps.
Europe
- Albania: Vodafone was the fastest mobile operator with a median download speed of 46.75 Mbps. Digicom was fastest for fixed broadband at 77.83 Mbps.
- Belgium: Telenet had the fastest median download speed over fixed broadband at 126.79 Mbps.
- Denmark: YouSee was the fastest mobile operator in Denmark with a median download speed of 118.32 Mbps. Fastspeed was fastest for fixed broadband at 270.80 Mbps.
- Estonia: The fastest operator in Estonia was Telia with a median download speed of 72.95 Mbps. Elisa was fastest over fixed broadband at 84.09 Mbps.
- Finland: DNA had the fastest median download speed over mobile at 74.65 Mbps. Lounea was fastest for fixed broadband at 103.79 Mbps.
- Germany: Telekom was the fastest mobile operator in Germany with a median download speed of 78.85 Mbps. Vodafone was fastest for fixed broadband at 112.58 Mbps.
- Latvia: LMT had the fastest median download speed over mobile at 63.59 Mbps. Balticom was fastest for fixed broadband at 203.31 Mbps.
- Lithuania: The operator with the fastest median download speed was Telia with 102.09 Mbps. Cgates was fastest for fixed broadband at 131.63 Mbps.
- Poland: Orange had the fastest median download speed over mobile at 43.02 Mbps. UPC was fastest for fixed broadband at 206.22 Mbps.
- Turkey: Turkcell was the fastest mobile operator in Turkey with a median download speed of 51.92 Mbps. TurkNet was fastest for fixed broadband at 50.94 Mbps.
References:
https://www.ookla.com/articles/global-index-cities-announcement
UK Struggles in Ranking of World’s Fastest Cities for Broadband
Telegeography: Global internet bandwidth rose by 28% in 2022
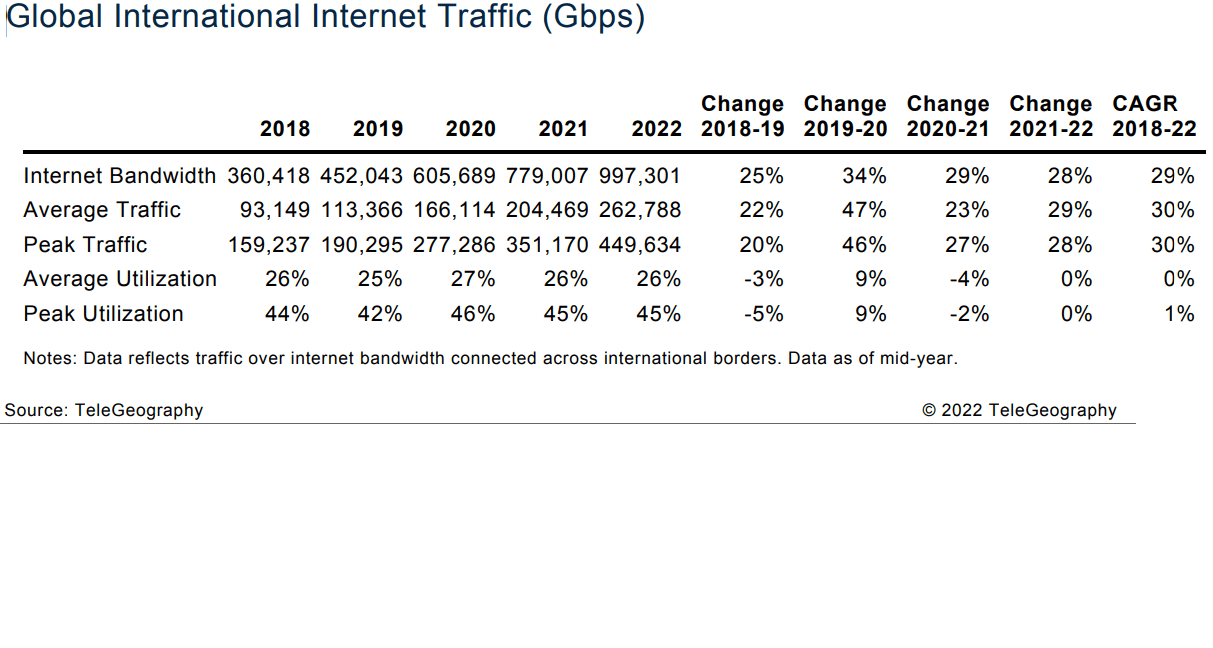
According to Telegeography, Global internet bandwidth rose by 28% in 2022, continuing the return to “normal” from the pandemic-generated bump of 2020.
Total international bandwidth now stands at 997 Tbps, representing a 4-year CAGR of 29%. COVID bump aside, the pace of growth has been slowing. Still, we do see a near tripling of bandwidth since 2018.
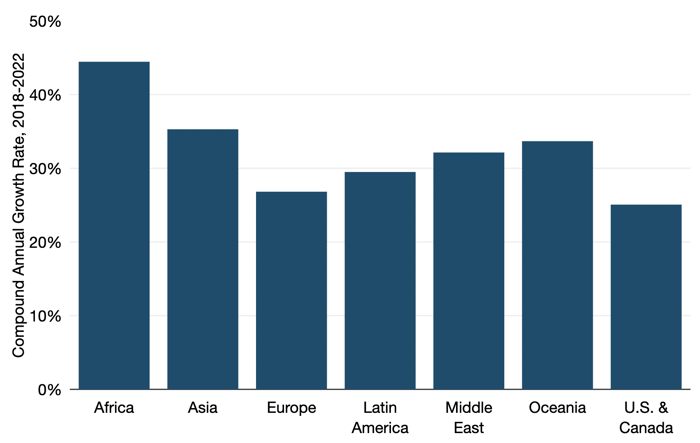
Strong capacity growth is visible across regions. Africa experienced the most rapid growth of international internet bandwidth, growing at a compound annual rate of 44% between 2018 and 2022. Asia is behind Africa, rising at a 35% compound annual rate during the same period.
Source: Telegeography
Both average and peak international internet traffic increased at a compound annual rate of 30% between 2018 and 2022—slightly above the 29% compounded annual growth rate in bandwidth over the same period. All the stay-at-home activity associated with COVID-19 resulted in a spike in traffic from 2019 to 2020. Average traffic growth dropped from 47% between 2019-2020 to 29% between 2021-2022, while peak traffic growth dropped from 46% to 28% over the same time period.
Prices for Internet Service:
ISPs shift to predominantly 100 Gbps internet backbones continues to reduce the average cost of carrying traffic and enables profitability at lower prices. As a result, price erosion remains the universal norm. It reflects the introduction of competition into new markets and the response of more expensive carriers to lower prices. Trends in the IP transit market generally follow regional trends of the transport market. And while some have suggested that price erosion may slow as a result of recent inflation and supply chain constraints (as it has in the wavelength market), we have not seen this trend make its way into the IP transit market.
Across the cities included in the figure below, 10 GigE prices fell 16% compounded annually from Q2 2019 to Q2 2022. Over the same period 100 GigE port prices fell 25%. In Q2 2022, the lowest 10 GigE prices on offer were at the brink of $0.09 per Mbps per month. The lowest for 100 GigE were $0.06 per Mbps per month.
The sharper decline in 100 GigE reflects the advanced maturity of 10 GigE, as well as more carriers offering it and more competition. While 10 GigE remains a relevant increment of IP transit, particularly in more emerging markets, its share of the transaction mix continues to yield to 100 GigE. In 2022, providers indicated that a majority of their sales mix in key U.S. and European hubs was now 100 GigE. On average, across the cities noted, the Monthly Recurring Charge (MRC) for a 100 GigE port was 6.7 times the MRC for a 10 GigE port. Operators are poised to adopt 400 GigE IP transit ports as the next fundamental upgrade from multiple 100 GigE ports.
Outlook:
The combined effects of new internet-enabled devices, growing broadband penetration in developing markets, higher broadband access rates, and bandwidth-intensive applications will continue to fuel strong internet traffic growth. While end-user traffic requirements will continue to rise, not all of this demand will translate directly into the need for new long-haul capacity.
A variety of factors shape how the global internet will develop in coming years:
• Post-COVID-19 growth trajectory. Initial evidence suggests that the spike in the rate of bandwidth and traffic growth in 2020 from the pandemic was a one-time event and we have largely returned to more traditional rates of growth. Operators we spoke to indicated they no longer see the pandemic leading to upward adjustments to their demand forecasts.
• IP Transit Price Erosion. International transport unit costs underlay IP transit pricing. As new international networks are deployed, operational and construction costs are distributed over more fiber pairs and more active capacity, making each packet less expensive to carry.
• We already see a major shift from 10 GigE requirements to 100 GigE requirements and expect that 400 GigE will emerge in two to three years as a significant part of the market.
• The introduction of new international infrastructure also creates opportunities for more regional localization of content and less dependence on distant hubs. As emerging markets grow in scale, they too will benefit from economies of scale, even if only through cheaper transport to internet hubs.
• International versus domestic. While there’s little doubt that enhanced end-user access bandwidth and new applications will create large traffic flows, the challenge for operators will be to understand how much of this growth will require the use of international links. In the near-term, the increased reliance on direct connections to content providers and the use of caching will continue to have a localizing effect on traffic patterns and dampen international internet traffic growth.
• Bypassing the public internet. The largest content providers have long operated massive networks, these companies continue to experience more rapid growth than internet backbones and they are expanding into new locations. Many other companies, such as cloud service providers, CDNs, and even some data center operators, are also building their own private backbones that bypass the public internet. As a result, a rising share of international traffic may be carried by these networks.
References:
https://blog.telegeography.com/internet-traffic-and-capacity-remain-brisk
Sandvine: Google, Facebook, Microsoft, Apple, Amazon & Netflix generate almost 57% of Internet traffic
Sandvine’s newly released 2022 “Global Internet Phenomena Report” aggregates data from more than 160 Tier 1 and Tier 2 fixed and mobile networks worldwide to reveal unprecedented trends, such as:
• Rapid growth of 1Terabyte per month “heavy app users,” a trend that is expected to accelerate with the transition from 4G to 5G and the explosion of video everywhere across social, gaming, messaging, and immersive experiences;
• First-time “tipping of the scales,” with Google, Facebook, Microsoft, Apple, Amazon, and Netflix generating almost 57% of Internet traffic – more than everyone else, combined;
• QUIC [1.] multiplexed transport, encryption, and privacy protocols like Apple iCloud Private Relay obscuring network visibility for capacity planning and congestion management;
Note 1. QUIC is a Transport layer protocol used by more than half of all connections from the Chrome web browser to Google’s servers. Microsoft Edge and Firefox browsers also support it.
• Mashups of videos, payments, maps, chat, and other features increasing the need for more sophisticated machine learning techniques to measure and deliver optimal app quality of experience (QoE);
• Global rankings of “Top-10 Apps” in Video, Gaming, Social, Messaging, Enterprise Conferencing, with Google’s YouTube retaining the top spot in global app traffic share at 14.67% followed by Netflix at 9.39%, as well as other downstream/upstream and regional trends (Americas, EMEA, and APAC).
Samir Marwaha, Chief Strategy Officer, Sandvine said: “Our latest ‘Global Internet Phenomena Report’ shows that people care more about how their favorite apps perform than the underlying networks. This makes it crucial that 5G and Cloud service providers understand, at a granular level, the application quality of experience they are delivering to customers. That’s going to have the greatest impact on their brands and their ability to generate revenue streams within new business models.”
Gabriel Brown, Principal Analyst, Mobile Networks and 5G, Heavy Reading said:
“The top content producers serving more traffic and accounting for a greater share of network load has a big impact, but at least it is a known quantity. The other part of the story is the increasing diversity of traffic sources – from new streamers, live sports, gaming, and device updates – and the growth of complex apps that combine multiple traffic types and services in a single customer experience. In combination with the rise of QUIC and iCloud Private Relay, this is challenging operators to better understand where and when traffic originates. Insight into these emerging patterns can help operators manage network capacity and meet customer expectations.”
Get the Report and on-demand Webinar to see the hottest trends and insights derived from more than 2.5 billion internet subscribers. Also, check out other resources, such as our 5G Service Innovation and Intelligence Whitepaper, 5G Service Intelligence Engine (NWDAF) Whitepaper, Cloud-Ready Options, and Use Cases eBook.
About Sandvine:
Sandvine’s cloud-based Application and Network Intelligence portfolio helps customers analyze, optimize, and monetize application experiences using contextual machine learning-based insights and real-time actions. Market-leading classification of more than 95% of traffic across mobile and fixed networks by user, application, device, and location significantly enhances interactions between users and applications. For more information about delivering superior quality of experience with uniquely rich, real-time data that can drive performance and revenues, visit http://www.sandvine.com or follow Sandvine on Twitter @Sandvine.
Media Contact:
Susana Schwartz, Sandvine +1 816 680 1447 [email protected]
References:
https://www.sandvine.com/global-internet-phenomena-report-2022?hs_preview=khpPseNo-62343537839
Highlights of Cisco’s Internet Traffic Report & Forecast
According to statistics from Cisco Systems global average Internet traffic will increase 3.2-fold by 2021 and will reach 717 Tbps. Busy hour Internet traffic will increase 4.6-fold by 2021 and will reach 4.3 Pbps. Globally, the number of DDoS attacks greater than 1 Gbps will grow 2.5-fold from 2016 to 2021, a compound annual growth rate of 20%.
In 2021:
- Fixed access and Wi-Fi networks represented 52.6% of the world’s total Internet traffic in 2021.
- Mobile networks – including 4G and 5G networks – handled just 20.5% of the world’s total Internet traffic in 2021.
According to Cisco’s findings, future trends favor mobile. The firm reported that fixed and Wi-Fi networks were approximately 52.1% of total Internet traffic in 2016 – virtually the same number as 2021.
Global mobile networks handled just 9.8% of total Internet traffic in 2016, but that figure more than doubled in 2021.
It’s interesting that Cisco predicts an average WiFi speed of 92 Mbps by 2023, while the average mobile speed will then be less than half of that at 44 Mbps.
Global – 2021 Forecast Highlights:
Internet users by 2023:

66% of the population will be using the Internet up from 51% in 2018
……………………………………………………………………….
Mobile devices/ connections by 2023:

up from 1.2 in 2018

up from 2.4 in 2018


IP Traffic:
• Globally, IP traffic will grow 3-fold from 2016 to 2021, a compound annual growth rate of 24%.
• Globally, IP traffic will reach 278.1 Exabytes per month in 2021, up from 96.1 Exabytes per month in 2016.
• Global IP networks will carry 9.1 Exabytes per day in 2021, up from 3.2 Exabytes per day in 2016.
• Globally, IP traffic will reach an annual run rate of 3.3 Zettabytes in 2021, up from an annual run rate of 1.2
Zettabytes in 2016.
• Globally, IP traffic will reach 35 Gigabytes per capita in 2021, up from 13 Gigabytes per capita in 2016.
• Globally, average IP traffic will reach 847 Tbps in 2021, and busy hour traffic will reach 5.0 Pbps.
• In 2021, the gigabyte equivalent of all movies ever made will cross Global IP networks every 1 minutes.
Internet Traffic:
• Globally, Internet traffic will grow 3.2-fold from 2016 to 2021, a compound annual growth rate of 26%.
• Globally, busy hour Internet traffic will grow 4.6-fold from 2016 to 2021, a compound annual growth rate of 35%.
• Globally, Internet traffic will reach 235.7 Exabytes per month in 2021, up from 73.1 Exabytes per month in 2016.
• Global Internet traffic will be 7.7 Exabytes per day in 2021, up from 2.4 Exabytes per day in 2016.
• Global Internet traffic in 2021 will be equivalent to 707 billion DVDs per year, 59 billion DVDs per month, or 81 million DVDs per hour.
•In 2021, the gigabyte equivalent of all movies ever made will cross the Internet every 1 minutes.
• Global Internet traffic in 2021 will be equivalent to 135x the volume of the entire Global Internet in 2005.
• Globally, Internet traffic will reach 30 Gigabytes per capita in 2021, up from 10 Gigabytes per capita in
2016.
• Globally, average Internet traffic will increase 3.2-fold by 2021 and will reach 717 Tbps.
• Globally, busy hour Internet traffic will increase 4.6-fold by 2021 and will reach 4.3 Pbps.
• Globally, the number of DDoS attacks greater than 1 Gbps will grow 2.5-fold from 2016 to 2021, a
compound annual growth rate of 20%.
• Globally, the number of DDoS attacks greater than 1 Gbps will be 3.1 million per year in 2021, up from 1.3 million per year in 2016.
Fixed Wireless/Wi-Fi and Mobile Growth:
• Global Fixed/Wi-Fi was 41% of total IP traffic in 2016, and will be 46% of total IP traffic in 2021.
• Global Mobile was 7% of total IP traffic in 2016, and will be 17% of total IP traffic in 2021.
• Global Fixed/Wi-Fi was 52.1% of total Internet traffic in 2016, and will be 52.6% of total Internet traffic in 2021.
• Global Fixed/Wired was 38% of total Internet traffic in 2016, and will be 27% of total Internet traffic in 2021.
• Global Mobile was 9.8% of total Internet traffic in 2016, and will be 20.5% of total Internet traffic in 2021.
• Globally, mobile data traffic will grow 7-fold from 2016 to 2021, a compound annual growth rate of 46%.
• Globally, mobile data traffic will reach 48.3 Exabytes per month in 2021, up from 7.2 Exabytes per month in 2016.
• Global mobile data traffic will grow 2 times faster than Global fixed IP traffic from 2016 to 2021.
• Global Mobile was 7% of total IP traffic in 2016, and will be 17% of total IP traffic in 2021.
• Globally, mobile data traffic in 2021 will be equivalent to 23x the volume of the entire Global Internet in 2005.
Global Fixed/Wired:
51% of total IP traffic in 2016, and will be 37% of total IP traffic in 2021.
References:
https://www.cisco.com/c/en/us/solutions/executive-perspectives/annual-internet-report/index.html
Omdia: Big increase in Gig internet subscribers in 2022; Top 25 countries ranked by Cable
GAO: U.S. Broadband Benchmark Speeds Too Slow; FCC Should Analyze Small Business Speed Needs
In a report released Thursday, the U.S. Government Accountability Office (GAO) said that the FCC’s benchmark for minimum broadband internet speeds (set six years ago at “always on” access of 25 Mbps downstream and 3 Mbps upstream) is no longer fast enough. That’s especially the case for small business owners. After conducting a study on the matter, the GAO recommends the FCC analyze small business speed requirements at this time and reconsider its current definition.
“FCC officials said they are not aware of any small business requirements that have been taken into consideration in determining the minimum speed benchmark,” the GAO says. “Analyzing small business speed requirements could help inform FCC’s determination of the benchmark speed for broadband.”

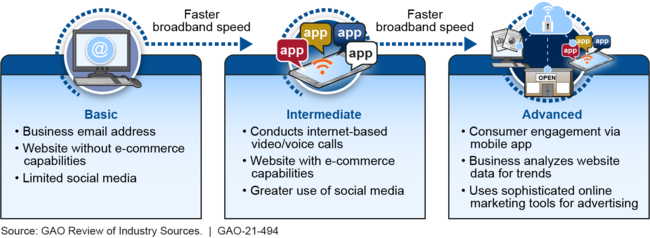
The figure below illustrates the various kinds of business broadband use and the associated relative speed requirements.
Illustrative Examples of Different Kinds of U.S. Business Broadband Use:
Sources vary in terms of the specific speeds they recommend for small businesses. For example, in 2017, BroadbandUSA—a National Telecommunications and Information Administration program—published a fact sheet stating that small businesses need a minimum of 50 Mbps speeds in order to conduct tasks such as managing inventory, operating point-of-sale terminals, and coordinating shipping. A 2019 USDA report on rural broadband and agriculture stated that, as technology advances and volumes of data needed to manage agriculture production grow, speeds in excess of 25/3 Mbps with more equal download and upload speeds will likely be necessary.
Reports from small businesses show that many want a download speed of at least 100 Mbps to run their operations more effectively. According to the FCC’s data, about 67 percent of rural Americans have access to 100 Mbps down/10 Mbps up speeds, compared to about 83 percent with access to the agency’s current minimum benchmark.
To fulfill a statutory requirement to determine annually whether advanced telecommunications capability is being deployed on a reasonable and timely basis to all Americans, FCC sets a minimum broadband speed benchmark.
In its 2021 Broadband Deployment Report, FCC stated that the current benchmark, last set in 2015, continues to meet that requirement. However, FCC officials said they are not aware of any small business requirements that have been taken into consideration in determining the minimum speed benchmark. Analyzing small business speed requirements could help inform FCC’s determination of the benchmark speed for broadband.
Recommendations:
GAO is making one recommendation to FCC to solicit stakeholder input and analyze small business broadband speed needs and incorporate the results of this analysis into the benchmark for broadband. FCC agreed with this recommendation.
References:
https://www.gao.gov/products/gao-21-494
https://www.gao.gov/assets/gao-21-494-highlights.pdf
https://gizmodo.com/the-fccs-definition-of-broadband-internet-is-too-slow-1847257425
Telegeography: Strong international bandwidth demand in LatAm; Global Internet traffic and bandwidth increased in 2020
TeleGeography’s latest research on Latin America shows that international bandwidth demand is strong in the region. With an ongoing surge in new submarine cable deployments, content providers are expanding their geographic reach as both owners and anchor customers of new cable systems.
The market research firm reported in August that the average international internet traffic increased 48% in 2020 while internet bandwidth was up 35%, the biggest increase since 2013. In its annual report on submarine networks and capacity, TeleGeography said the global Internet “bent but – for the most part – did not break” during the COVID-19 pandemic. However, the market research firm wrote that the spike in bandwidth and traffic growth in 2020 is probably a one-time event and a return to typical rates of growth is likely when the pandemic restrictions end.
International Internet Bandwidth Growth by Region:
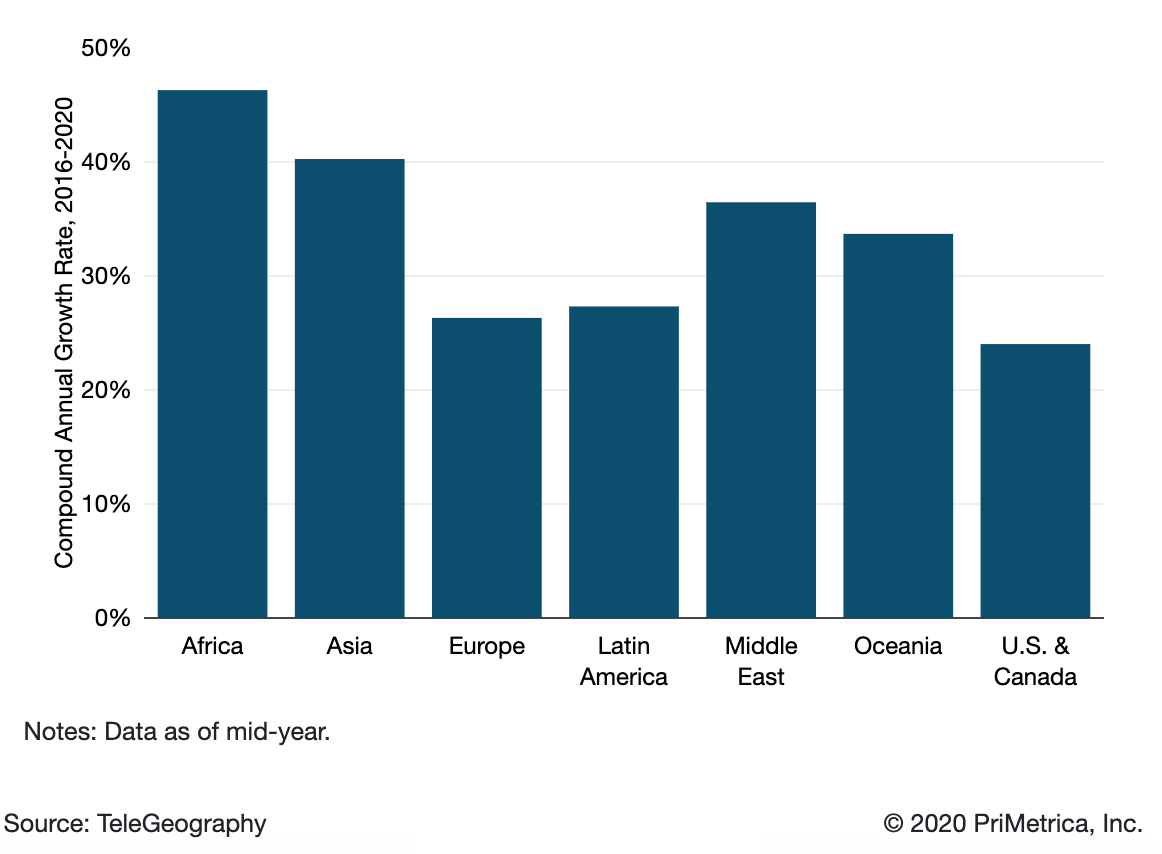
International internet traffic growth largely mirrors that of internet capacity. However, traffic and capacity growth seldom move in perfect tandem. (Network operators will often add capacity in anticipation of traffic growth.). Average and peak international internet traffic increased at a compound annual rate of 30% between 2016 and 2020, comparable to the 29% compound annual growth rate in bandwidth.
Based on discussions with network operators worldwide, TeleGeography believes the trends of recent years will continue. While international Internet bandwidth and traffic growth had been gradually slowing prior to 2020, growth remains brisk. Africa has experienced the most rapid growth in international bandwidth, growing at a compound annual rate of 47% from 2016-2020, with Asia just behind at 40%.
What won’t change is the role of U.S. web giants Google, Microsoft, Facebook and Amazon. They have become far and away the dominant users of international bandwidth, accounting for 64% of all used capacity in 2019. Across six of the world’s seven regions, they added capacity at a compound annual rate of above 70% between 2015 and 2019, compared to a rate of less than 45% for others. Their rapid expansion into subsea capacity has caused a major shift in the global wholesale market, TeleGeography says.
That presence “drives scale to establish new submarine cable systems and lower overall unit costs.” The OTT firms have become a key part of the subsea cable business model. Many of the big cables, invested in by both telcos and Internet players, now rely on the initial capital injection from the Internet content players. This means a share of network capacity or fiber pairs can be allocated to the largest consumers to cover initial costs, with the remaining shares sold as managed wholesale bandwidth.
TeleGeography states that both content players and telcos are trying to cope with massive growth in demand, driven by new applications and greater penetration into emerging markets. “The sheer growth in supply will drive lower unit costs for bandwidth,” it says. “In the face of unrelenting price erosion, the challenge for wholesale operators is to carve out profitable niches where demand trumps competition.” Prices vary enormously even though they are falling sharply. London and Singapore prices have declined 25% since 2017, yet Singapore tariffs are much higher; a 10 GigE port costs roughly three times as much, for example. Thanks to capacity upgrades, the prices for 10 GigE ports in São Paulo and Sydney fell 38% and 22% compounded annually over the past three years. TeleGeography warns that while the unit cost savings from the large cable investments are an incentive to investment for operators, they don’t want to be left with too much excess bandwidth. “It’s often a race to offload wholesale capacity before a new generation of lower-cost supply emerges.”
TeleGeography predicts $8.1 billion worth of new cables will be launched between 2020 and 2022 with the biggest share, $2.3 billion, invested in the trans-Pacific route. But the research firm cautions that the pandemic could disrupt supply. “Temporary cable factory closures combined with delays in permitting and marine installation could hamper the deployment of many planned cables.”
References:
https://blog.telegeography.com/internet-traffic-and-capacity-in-covid-adjusted-terms
https://www2.telegeography.com/covid19-state-of-the-network
