Huawei Vision & Architecture for “All Cloud” Mobile Networks
At the 2016 Global Mobile Broadband Forum in Tokyo on November 25th, Edward Deng- President of Huawei Wireless Solution, described an integrated suite of solutions to enable the full “cloudification” of wireless networks. The company calls this solution ERA, signaling the arrival of the mobile cloud era. ERA includes three integrated solutions: one for cloud-based core networks (CloudEdge), cloud-based radio access networks (CloudRAN), and cloud-based air interface (CloudAIR).
Cloud network technology is a core focus of Huawei’s research and development. Since its release at the 2014 Mobile World Congress (MWC), Huawei’s CloudEdge solution has been deployed in over ten commercial sites and has obtained over 60 commercial contracts. Cloud core networks enable the convergence of multiple radio access technologies (RATs) as well as the provision of more flexible applications through network slicing and tailored scenario-based solutions.
Huawei aims to promote, drive, and lead the development of an All Cloud era. The company launched CloudRAN in April of this year to enable the cloudification of wireless network architecture, paving the way for cloud-based radio access networks. “The goal of CloudRAN is to redesign the entire architecture of wireless networks, transforming resource management, multi-connectivity, and elastic architecture into native capabilities to better meet the challenges of an uncertain future.” CloudRAN has passed business verification procedures in China, Italy, South Korea, and Japan, and is expected to be commercially deployed in Q3 of 2017.
Huawei is backing industry moves towards ‘All cloud’ mobile networks as it evolves it cloud focus in line with overarching trends. CloudEdge was actually launched back in 2014, with the team claiming it has been deployed in over ten commercial sites and has obtained over 60 commercial contracts, and CloudRAN is expected to be commercially deployed in Q3 of 2017. Deng claims CloudAIR uses advanced scheduling to allow different RATs (Radio Access Technologies) to share the same spectrum within a carrier band.
“Air interface is the most valuable resource that operators have. And if this most valuable resource doesn’t support efficient, on-demand, and agile network deployment, then a mobile network isn’t truly cloud-based,” said Deng. “Today, we launched the CloudAIR solution to help reshape air interface. Our focus is on improving the efficiency of air interface, enabling operators to deploy services more flexibly and, of course, enhancing user experience. CloudAIR is designed to enable more efficient sharing of air interface resources like spectrum, power, and channels.”
In a similar fashion to air interface cloudification, power cloudification supports inter-carrier, inter-RAT, inter-band, inter-site power sharing.
Channel cloudification is the third feature of CloudAIR. This allows for the implementation of artificial intelligence-based scheduling to enable any received signals to be recognized as available multi-path resources. This will facilitate convenient site selection and provide an improved user experience.
Huawei’s ERA, combines CloudEdge, CloudRAN and CloudAIR technology to launch a new era of cloud-based mobile networks. “The ERA solution will maximize the value of operator assets, enable on-demand network deployment, accelerate service provisioning, and empower mobile networks to be the true enablers of all industries around the world,” said Deng. “Through nonstop innovation, this solution will create unprecedented value for the industry.”
Details on how the technology works were not disclosed. However, Huawei said spectrum cloudification allows different RATs to share the same spectrum, dynamically allocating spectrum resources based on fluctuations in traffic.
“By enabling more efficient sharing and allocation of resources, spectrum cloudification creates real value for telecom customers,” said Deng. “It’s an important development trend in the industry, and it will take greater collaboration with industry partners to continue pushing things forward.”
Reference:
http://www.huawei.com/en/news/2016/11/Huawei-All-Cloud-Mobile-Networks
2016 Telecom Capex Flat with Asia Pacific Largest Spender
By Stéphane Téral, senior research director, mobile infrastructure and carrier economics, IHS Markit
Bottom Line:
- There will be flat to very moderate growth in global service provider capital expenditures (capex) in 2016
- However, worldwide service provider capex spending is slowly crawling back to 2014 levels
- Asia Pacific is the world’s largest telecom spender and revenue contributor
IHS Analysis:
The telecom industry has been cyclical since the great telecom crash of March 2000, which is typical of deregulated industries. Investment goes through cycles of ups and downs that are more or less pronounced depending on how the major players react.
For 2016, large differences in regional investment agendas point to regional and national cycle de-synchronization—and, consequently, global flatness to very moderate growth in capital expenditures. This is a result of low-digit growth in North America, Europe, the Middle East and Africa (EMEA) and the Caribbean and Latin America (CALA) that is offset by a China-driven decline in Asia Pacific.
We forecast worldwide service provider capex to rise just 0.7 percent to US$341 billion by the end of this year, mainly propelled by a much-needed wave of investment in wireline broadband—for example, fiber to the X (FTTX)—in Europe. Spending on every type of hardware equipment except wireless and time-division multiplexing (TDM) voice will rise in 2016. Meanwhile, capitalized software that is captured in the non-telecom/datacom category—around half of total capex—is expected to grow by double-digit percentages.
As illustrated in the chart below, the service provider capex growth rate slowed down in 2015 followed by a pickup in 2016 that signals long-term flatness triggered by the combination of moderate desynchronized regional investment cycles, themselves triggered by very distinct agendas.
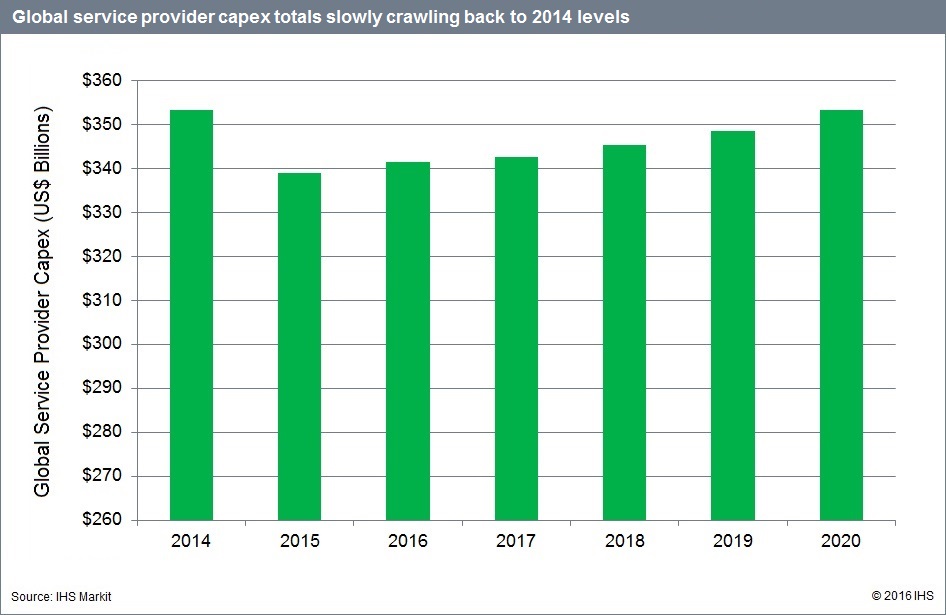
Telcos continue to account for the lion’s share of capex, at more than 88 percent. And from a geographic standpoint, Asia Pacific will remain the world’s largest spender (42 percent share), while North America stays roughly even, followed by EMEA and CALA.
Looking at earnings, the telecommunications service revenue picture remains mixed and contrasted across geographical regions. While global telecom service revenue declined 4 percent year-over-year in 2015, we project it to grow by over a percentage point this year to US$1.93 trillion. Asia Pacific is the world’s largest telecom revenue contributor, shadowed closely by North America—the globe’s most lucrative market.
Capex Report Synopsis:
The biannual IHS Markit service provider capex report provides worldwide and regional market size, forecasts through 2020, analysis and trends for revenue and capex by service provider type (telcos and cable operators) and capex by equipment type (broadband aggregation equipment; wireless infrastructure; IP routers and carrier Ethernet switches; optical equipment; IP and TDM voice infrastructure; video infrastructure; all other telecom/datacom network equipment; and CPE non-telecom/datacom network equipment).
For information about purchasing this report, contact the sales department at IHS Markit in the Americas at (844) 301-7334 or[email protected]; in Europe, Middle East and Africa (EMEA) at +44 1344 328 300 or [email protected]; or Asia-Pacific (APAC) at +604 291 3600 or [email protected]
Related articles:
Telecom’s Capex Tailspin Is Leaving Few Firms Unscathed
Ovum: Communications Provider Revenues & Capex Forecast: 2016–21
AT&T Expands Fiber Plant to Serve 4 Additional Markets; FTTH in Baton Rouge Area
AT&T has rolled out gigabit fiber-to-the-premises services in a handful of cities, mostly in the South. The venerable telco is moving closer to its goal of reaching 67 markets by mid-2019. AT&T Fiber is now available in 44 markets. The new markets include Baton Rouge, Louisiana; Birmingham, Alabama; Charleston, South Carolina; and Reno, Nevada. AT&T also announced expansion of AT&T Fiber in 16 existing markets.
AT&T claims they now have an addressable AT&T Fiber potential customer base of of 3 million locations, of which over 500K are apartments and condo units, or MDUs.
AT&T is expanding their AT&T Fiber locations, just as Google fiber retracts. They have made a point of highlighting this, gleefully so in some instances. As an incumbent provider with an extensive existing network, AT&T has distinct advantages over upstarts like Google fiber, who must overbuild markets at great expense and time.

References:
Also, AT&T Fiber Network Now Available in Baton Rouge, Louisiana Area:
AT&T today launched ultra-fast internet service in parts of the Baton Rouge area, including in parts of Central, Denham Springs, Zachery and surrounding communities. The company is offering a 1 gigabit connection to area homes, apartments and small business locations on their 100% fiber network powered by AT&T FiberSM.
In addition to the homes and small businesses connected to our 100% fiber network in the Baton Rouge area, AT&T connect nearly 20 area apartment and condo properties.
The Baton Rouge, LA area is one of 44 metros nationwide where AT&T ultra-fast internet service is currently available. The telco plans to reach at least 67 metros with their fastest internet service.
AT&T markets their ultra-fast service to over 3 million locations nationwide, of which over 500,000 include apartments and condo units. We’re on track to meet the 12.5 million locations planned by mid-2019.
“We are excited to add North Baton Rouge to the growing list of areas in Louisiana where our 100 percent fiber to the home network is bringing customers the fastest internet speeds available” stated Sonia Perez, state president, AT&T Louisiana. “At AT&T, we are committed to innovation and offering cutting-edge technologies, products and services that provide enhanced opportunities for the many ways our customers live, work and play.”
Verizon expects $1B annually in IoT revenue; XO acquisition leverages fiber assets
The Internet of Things (IoT) helped generate $217 million in revenue for Verizon Communications during the third quarter, a gain of 24% from a year earlier, with telematics accounting for most of that revenue. That’s according to John Stratton, Verizon’s executive VP and president of operations who spoke last week at Wells Fargo Technology, Media & Telecom investor event. Stratton predicted that Verizon would soon surpass $1 billion in IoT-based revenue per year.
So in the case of IoT, we see that the transport layer typically — analyst projection, folks like you would say 7% to 10% of the value would be found in the connection network layer. I look at those as sub-$1 ARPU. Fine. I will take it. Great cash flow. Highly profitable. But when I stack the services, my yields from those customers on the fleet side, on the OEM automotive side, dramatically higher, 10X, 15 times, 20 times with great margin potential.So as we think about our media investments, our telematics investments, things that we are doing in IoT in places like smart cities, what’s most important I think is the layer of connectivity between each of those tiers.
On the acquisition of XO Communications and leveraging the combined companies fiber plant, Stratton said:
When we first announced our intent to acquire XO, it was first seen as a fiber buy and it was before fiber was super sexy. So February of 2016 was a little bit earlier than some of the stuff that’s been going on lately and then people came around and said, oh, okay, we see it, it’s the spectrum assets that are maybe more interesting to Verizon.
Well, the fact is they are both really interesting and we love the spectrum for what it will enable us to do in the context of 5G, but, similarly to your question, the importance of those metro rings — top 50 cities, there’s good infrastructure in 45 of the top 50. If you think about what we used to call Verizon Business, but the long haul and metro assets that we have on that part of the business, it’s a really very nice complement. And the amount of fiber that Verizon has deployed in the US is dramatically higher than any other carrier.
Even before you get to 5G, the case around what we call One Fiber is extraordinarily compelling. So just the soul densification of the wireless network — if you look back, I (Verizon) have 55,000, 56,000 sites today — if you went back six, seven years ago, I had like 30,000 and if I look forward, I will have 100,000.So the fact is the largest wired networks in the world are going to be wireless networks. It’s just the nature of it. And so when I look at what’s required to serve my customer base for 4G LTE and then I combine that with the other fiber dependencies in the other parts of the business, even before I get to 5G, I have a very, very compelling case where I can take those capital dollars and for a minor incremental investment create new market opportunities. And this is the thing that we are really focused on.
And so as I think about where I’m deploying my wireless network, where we will be densifying that wireless network, what else can I do with that common fiber is a big deal.
In closing, Stratton said Verizon’s IoT business was growing at a 24% rate:
The IoT business that we see growing now at 24%, we see that stimulated even further through some of the actions and the acquisitions we’ve done there. But back to the fundamentals, from a top-line perspective, we are very confident in terms of our wireless business. We really love the position we are in in the industry broadly and then our space in it. It should be a good year for Verizon.
IHS: Self-Organizing Network Market Grew Nearly 50% in the Last 2 Years
By Stéphane Téral, senior research director, mobile infrastructure and carrier economics, IHS Markit
Bottom Line:
- Demand for self-organizing networks (SON) is swelling, driven by the need for automation as humans struggle to manage increasingly complex networks
- 3G Evolved High Speed Packet Access (HSPA+) has been the chief force behind SON, not Long Term Evolution (LTE)
- Nokia Networks’ acquisition of Eden Rock Communications in May 2015 has propelled the company to the head of the centralized SON (C-SON) vendor leaderboard.
IHS Analysis:
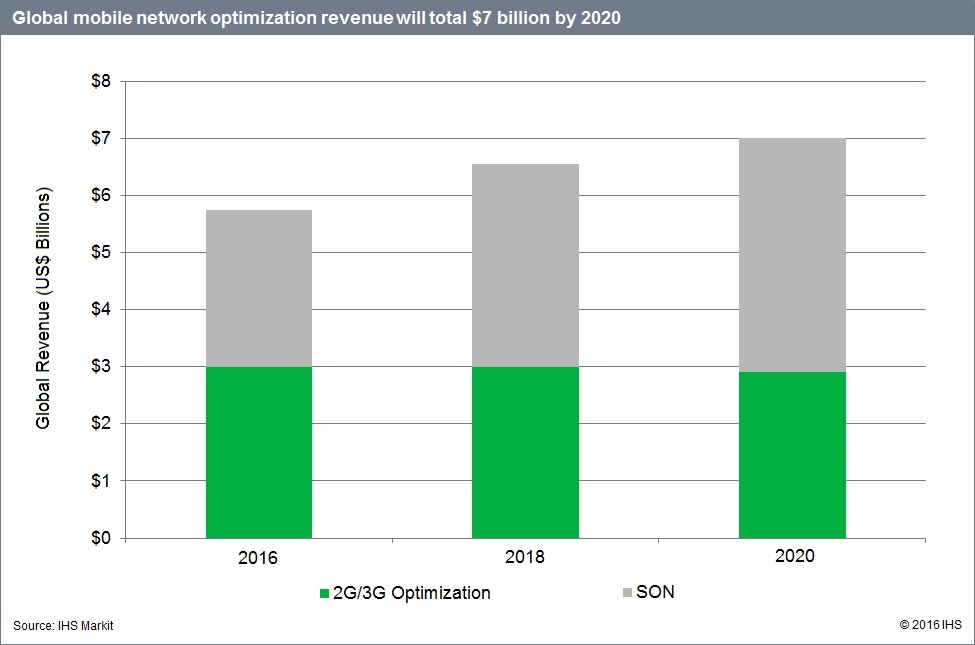
Combined, 2G/3G optimization and SON worldwide revenue grew 18% year-over-year in 2015, totaling $5.1 billion.
SON continues to explode. As a result of AT&T’s and KDDI’s 3G and 4G SON deployments, in addition to a flurry of minor ones around the world for 3G optimization, SON revenue reached $2.2 billion last year—48% more than the size of the 2014 market. At this stage, large European service providers such as BT/EE, Orange, Telefónica and Vodafone are deploying or have deployed SON across their multiple networks.
The chief driver for SON to date has been HSPA+. We found that more than 80% of mobile operators worldwide are using SON for 3G/HSPA/HSPA+ optimization.
As LTE rollouts are reaching their peak—with more than 500 commercial LTE networks worldwide—we are hearing from mobile operators that LTE is extremely reliable and fully optimized, while 3G optimization remains a chief concern and 2G is doing fine.
When it comes to the flavors of SON, C-SON still rules over distributed SON (D-SON). Moreover, the C-SON segment is no longer dominated by SON specialist vendors such as Amdocs and Cisco but rather by tier-1 mobile network vendor Nokia. Last year’s acquisition of Eden Rock Communications has really paid off for Nokia, which scored a major win at Orange in August 2016.
By 2020, the global 2G/3G optimization and SON market is forecast to hit $7 billion. As network complexity continues to rise, the need to reduce opex and remove humans—and the errors they inevitably introduce—from the equation goes on unabated.
SON Report Synopsis:
The annual IHS Markit SON and optimization software report provides worldwide and regional market size, forecasts through 2020, analysis and trends for the mobile network optimization market, including 2G and 3G optimization software and self-organizing network software by generation (3G, 4G) and by architecture (centralized, distributed). The report tracks tier-1 mobile infrastructure vendors with mobile network optimization tools, as well as specialist vendors.
For information about purchasing this report, contact the sales department at IHS Markit in the Americas at (844) 301-7334 or[email protected]; in Europe, Middle East and Africa (EMEA) at +44 1344 328 300 or [email protected]; or Asia-Pacific (APAC) at +604 291 3600 or [email protected].
Reference:
Operators agree: SON pivotal as networks transform to 5G & cloud, Nokia
SON (Self-Organizing Networks) Ecosystem Market Report
Telecom Sector Implications of a Surprise Republican Victory with Congressional Control of Both Houses, FBR&Co
by David Dixon & Mike He of FBR &Co.
Introduction:
The surprise Republican election victory and Congressional control of both Houses have significant policy implications for the telecom services sector. We provide our initial thoughts below.
For the last two terms, the Obama presidency and the FCC, currently led by Chairman Tom Wheeler, have been in favor of content companies working against telecom service providers, contributing to telecom service providers generally not earning their cost of capital. We think this reverses under a Republican administration that will be anti-regulation and pro-business. Key areas in play include net neutrality, wholesale interconnection, regulation of business data services, cable set top box reform, broadband deployment, and M&A.
We expect Wheeler to resign before inauguration day on January 20, 2017, consistent with prior FCC chairman decisions after a change in administration. Below, we discuss these key areas in play including business implications.
Discussion:
■ Net neutrality.
Carriers, generally, are not earning their cost of capital as outsized economic value creation continues to move up the stack to the innovative asset-light application layer. Republicans may allow traditional distribution channels to recover a greater portion of costly network upgrades from content companies going forward. Specifically, Republicans may kill Title 2 price-based regulation and endorse zero-rated content, which has been leveraged by T-Mobile, Verizon, and AT&T to help mitigate churn. We think companies that own distribution and content will still not be allowed to discriminate against new media and OTT players, but we expect OTT players to share in the network cost burdens to a greater extent. Positive for AT&T and VZ. Positive for RLECs CTL/LVLT, WIN.
■ Wholesale interconnection.
The Internet’s impact on traditional distribution channels is a major industry issue. Republicans may reverse the FCC’s recent decision to apply more oversight on wholesale interconnection. This has restricted the ability for telecom service providers to charge content providers and share the cost of expensive network upgrades. We expect higher costs for third-party intermediary Internet networks and content companies. Negative implications for CCOI, AKAM, and LLNW.
■ Spectrum auctions.
We think the incentive auction will remain on track. However, the Democrat administration has been guided by Silicon Valley to shift toward an incumbent spectrum-sharing policy platform. We think this may continue, but instead of agreeing to convert narrowband spectrum bands for broadband spectrum use, a Republican administration may instead auction spectrum that has the potential for higher valuation. Separately, Google has driven momentum on the 3.5 GHz “shared spectrum” (CBRS) band, and opposition to the FCC’s April CBRS Report and Order may impact the auction timing and process in 2017. A slower path on the 3.5 GHz spectrum band has positive implications for DISH. For PDVW, we think we still get an NOI, but there is increased probability that a Republican-led FCC administration auctions this spectrum, which is positive for PDVW as the majority owner of this spectrum. Consistent with our published research, we think PDVW is well positioned in all three possible NOI scenarios, including a spectrum auction.
Regulation of business data services. The Wheeler administration has signaled major regulatory price cap pressure coming for an important wireline access segment. There is an attempt to implement this by year-end. A Republican administration may reverse pricing restrictions to be imposed on the $60 billion business data services market, which has been particularly disruptive for incumbent and rural wireline telecom providers. Positive implications for CTL/LVLT, WIN, and AT&T.
■ Cable set top box reform.
A Republican administration may reverse cable set top box reform that favors application service providers by opening this market up to competition. Application service providers are seeking to establish alternative access into the home. Positive implications for cable companies.
■ Broadband deployment.
The National Broadband Plan was a major Obama initiative, driven in part by content company laments regarding the state of fiber deployment across the U.S. Implementation has been costly and slow, and we think NPV remains negative but necessary for telecom service providers to improve their strategic competitive positioning with cable companies. We think a Republican administration may help accelerate the migration to a less costly blend of fiber and fixed wireless, which is at a nascent stage. Fiber deployments have picked up recently, and we think this continues with less Federal pressure on pricing going forward. A lighter touch on net neutrality and wholesale interconnection may stimulate the pace of fiber deployment. Positive implications for DY.
■ M&A.
The FCC and DoJ have opposed major horizontal consolidation in mobile and broadband under a Democrat administration (AT&T/T-Mobile, Sprint/T-Mobile, Comcast-Time Warner Cable) as the industry reaches peak penetration, T-Mobile approaches capacity challenges, and additional capacity spending is hard to justify given industry ARPU pressures. The risk for Sprint is that a cable company buys a soon to be capacity constrained T-Mobile, but we think it is more likely that a cable company buys Sprint (which has a substantial spectrum advantage) or a merged Sprint and T-Mobile compete on a sustainable basis with AT&T and Verizon. The administration change may benefit DISH Networks in that potential combinations may be looked at more favorably. We believe AT&T and VZ could gain approval to buy the company under a Republican administration, though we maintain our reservations that both companies would be interested as they face capacity challenges with an industry at peak penetration, ARPU pricing pressure, and negative NPV associated with investment in additional 4G and 5G-based capacity. Positive for the prospect of a Sprint and T-Mobile merger and the AT&T and TWX merger despite negative election rhetoric.
■ FCC transition timing.
The FCC is directed by five commissioners appointed by the President and confirmed by the Senate for five-year terms, except when filling an unexpired term. The President designates one of the commissioners to serve as chairman. Only three commissioners may be members of the same political party. The President has the power to designate a new chairman from among the five-member commissioners without the need for Senate approval, i.e., Commissioner Ajit Pai or Commissioner Michael O’Reilly. Both Republican Commissioners have been actively opposed on most major issues before the Democrat-led Commission.
–>We expect Wheeler to resign before inauguration day on January 20, 2017, consistent with prior FCC chairman decisions after a change in administration.
ITU World Telecommunication Standardization Assembly +3GPP on 5G
Standards for the 5G era ITU membership gathered at the quadrennial World Telecommunication Standardization Assembly (WTSA-16) have accelerated support for standards work on 5G, IoT, smart cities, fintech – and more.
ITU membership has called for ITU’s standardization arm to expand its study of the wireline networking innovations required to achieve the ambitious performance targets of smart 5G systems. This call has come in parallel with ITU members’ reaffirmation of the importance of ITU’s standardization work to drive the coordinated development of ultra-high-speed transport networks, the Internet of Things, future video technologies, and smart cities and communities.
The Assembly also revised two of the A series ITU-T Recommendations that guide ITU-T’s work, and in addition approved five ITU standards on subjects including international mobile roaming and Internet Exchange Points.
“The new standardization strategies to be decided at this Assembly will provide the foundation for ICT development and the creation of a knowledge society,” said Youssef Chahed, head of Tunisia’s government. “Standards are important to success in innovation and creativity, for example in 5G communication and Smart Cities.”
ITU Secretary-General Houlin Zhao said: “The WTSA process continues to be the world’s foremost platform for multi-stakeholder collaboration in the interests of leveraging ICTs to drive sustainable development. ITU’s unique public-private partnership of members from government, industry and academia is essential to its value proposition. Our Member States ensure that ITU is globally represented, and this gives great strength to our standardization work. We work with our members to strengthen ITU and the task of this Assembly is to ensure that standardization remains well-positioned to support the development of the global ICT ecosystem.”
The decisions of the WTSA-16 will shape ITU-T into a form optimized to assist government, industry and academia in achieving their ambitions for year 2020 and beyond, in fields including IMT-2020 (5G), the Internet of Things, Smart Cities, and the ICT sector’s contribution to the pursuit of the United Nations’ Sustainable Development Goals.
Key takeaways from a 3GPP presentation on 5G:
• widely varying use cases
• widely varying performance requirements
• is not really about connecting people, but more about connecting things
• No single technology will satisfy all of these requirements
–>These requirements will not all be met at the same point in time
3 High Level 5G Use Cases:
- Enhanced Mobile Broadband
- Massive Machine Type Communications
- Ultra Reliable and Low Latency Communications
Windstream to merge with EarthLink in $673M deal
More consolidation and cost cutting in telco land. Last week, it was Century Link and Level 3. Today, Windstream and EarthLink. Apparently, it’s all about scale. The $1.1 billion (€993.82 million) all-stock deal is a move designed to boost the network service providers ability to compete with larger rivals -both telco’s and MSOs/cablecos.
Under the terms of the deal, Earthlink shareholders will receive 0.818 shares of Windstream for each Earthlink share. The new entity, which will retain the Windstream name, plans to shed $125 million in costs while holding 145,000 route miles of fiber in the Northeast and Southeast.
Windstream serves 1.06 million residential broadband customers, 138,500 small businesses, and 26,600 larger enterprise customers.
“The combination with EarthLink further advances Windstream’s strategy by creating a stronger, more competitive business to serve our customers while increasing free cash flow and reducing leverage,” said Tony Thomas, CEO of Windstream, in a statement. “With this transaction, we are combining two highly complementary organisations with closely aligned operating strategies and business unit structures,” he added.
“We are pleased to join forces with a company that shares our core values and operating philosophies, and whose strategy complements our own,” said EarthLink chief executive Joe Eazor. “In our work with Tony and his team, it’s become clear that we are two companies on parallel paths,” he said. “Now is the right time for us to come together.”
EarthLink currently operates two divisions: Business and Consumer.
- EarthLink Business sells communications, IT and virtualization, cloud computing, IT security, colocation, hosted applications and support services. The company owns and operates a U.S. network including 29,421 route miles of fiber, 90 metro fiber rings, and eight data centers. EarthLink Business has more than 150,000 customers.[4]
- EarthLink’s Consumer division sells broadband (DSL/freestanding DSL, cable internet, 4G Internet, Satellite Internet) dial-up Internet, Web hosting and commerce, and related services. It also sells spamBlocker, Anti-virus and Online Back-up. Earthlink internet services claims to have over 1 million customers.
The merger is expected to generate annual synergies of $125 million within 36 months of the deal’s completion, which is expected to happen in the first half of 2017, subject to approval by the Federal Communications Commission (FCC), and customary closing conditions.
References:
https://www.earthlink.com/about-us/news-center/merger
http://www.reuters.com/article/us-earthlink-hldgs-m-a-windstream-hldgs-idUSKBN1321HF
http://www.totaltele.com/view.aspx?ID=495469
A joint presentation will be available at:
ONUG Fall 2016: Software Defined (SD)-WAN in limited to large scale deployment
Editor’s Note: We remain SD-WAN skeptics due to no standards and hence no vendor or carrier interoperability.
The three primary drivers fo the ONUG Fall 2016 conference: Silo organization structure has run its course. It’s in our best interest to create a market for next generation analytics. Cloudification of technology is the tool to allow organization transformation.
SD-WAN grew out of the needs of attendees from the first ONUG meeting in 2012. Co-founder and ONUG Co-Chair Nick Lippis predicted that 2017 will be the year of SD-WAN.

Results of an ONUG Fall poll indicated that 50% of the ONUG Community are in limited to large-scale SDN deployment. In addition, 64% of the ONUG Community are already in the SD-WAN deployment stage. Of those piloting, 97% said they will move to the deployment phase within the coming year.
With the support of ONUG and others, the use case for SDN in the WAN evolved into its own industry. Led by companies like CloudGenix, Viptela, and VeloCloud, new opportunities arose to simplify the management of WAN connections between branches. Central controllers orchestrated the task of deployment to the point where anyone could connect the device via phone call instead of a plane ticket. Circuit configuration was no longer the stuff of days gone by and instead became something handled remotely by the best people.
SD-WAN also allowed more services to be built on top of traditional WANs. Now, traffic could be encrypted end-to-end. Analytics could provide solid numbers about traffic patterns, which could then be used to provide intelligent decisions about application routing patterns. And even the metrics collected could be used with service providers to ensure service level agreements (SLAs) were being met.
The conversations about SD-WAN on Day 1 weren’t so much about explaining how it works as they were about providing justification to start the proof-of-concept trials. ONUG constituents like Kindred Healthcare and Gap are quickly rolling out massive SD-WAN deployments to reduce costs and simplify management. The success stories of SD-WAN are highlighting the next wave of adoption in enterprises down the food chain.
More at: http://gestaltit.com/tech-talks/tom/onug-day-1-wrap-sd-wan-spotlight/
References:
http://gestaltit.com/tech-talks/tom/onug-live-blog-day-1/
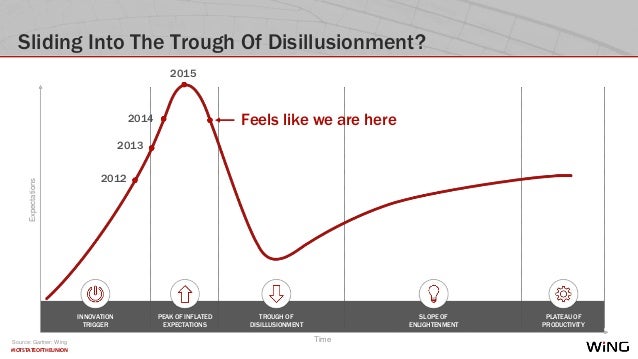
Most Active VCs In The Internet Of Things – IIoT Rules!
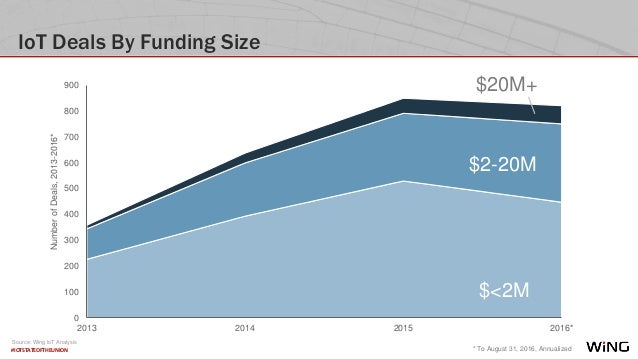
The Internet of Things (IoT) industry is on track to see nearly $3.7B in funding this year as connectivity and software are injected into sensor-laden objects and appliances. An increasing proportion of these dollars are being allocated to startups working specifically on the industrial IoT.
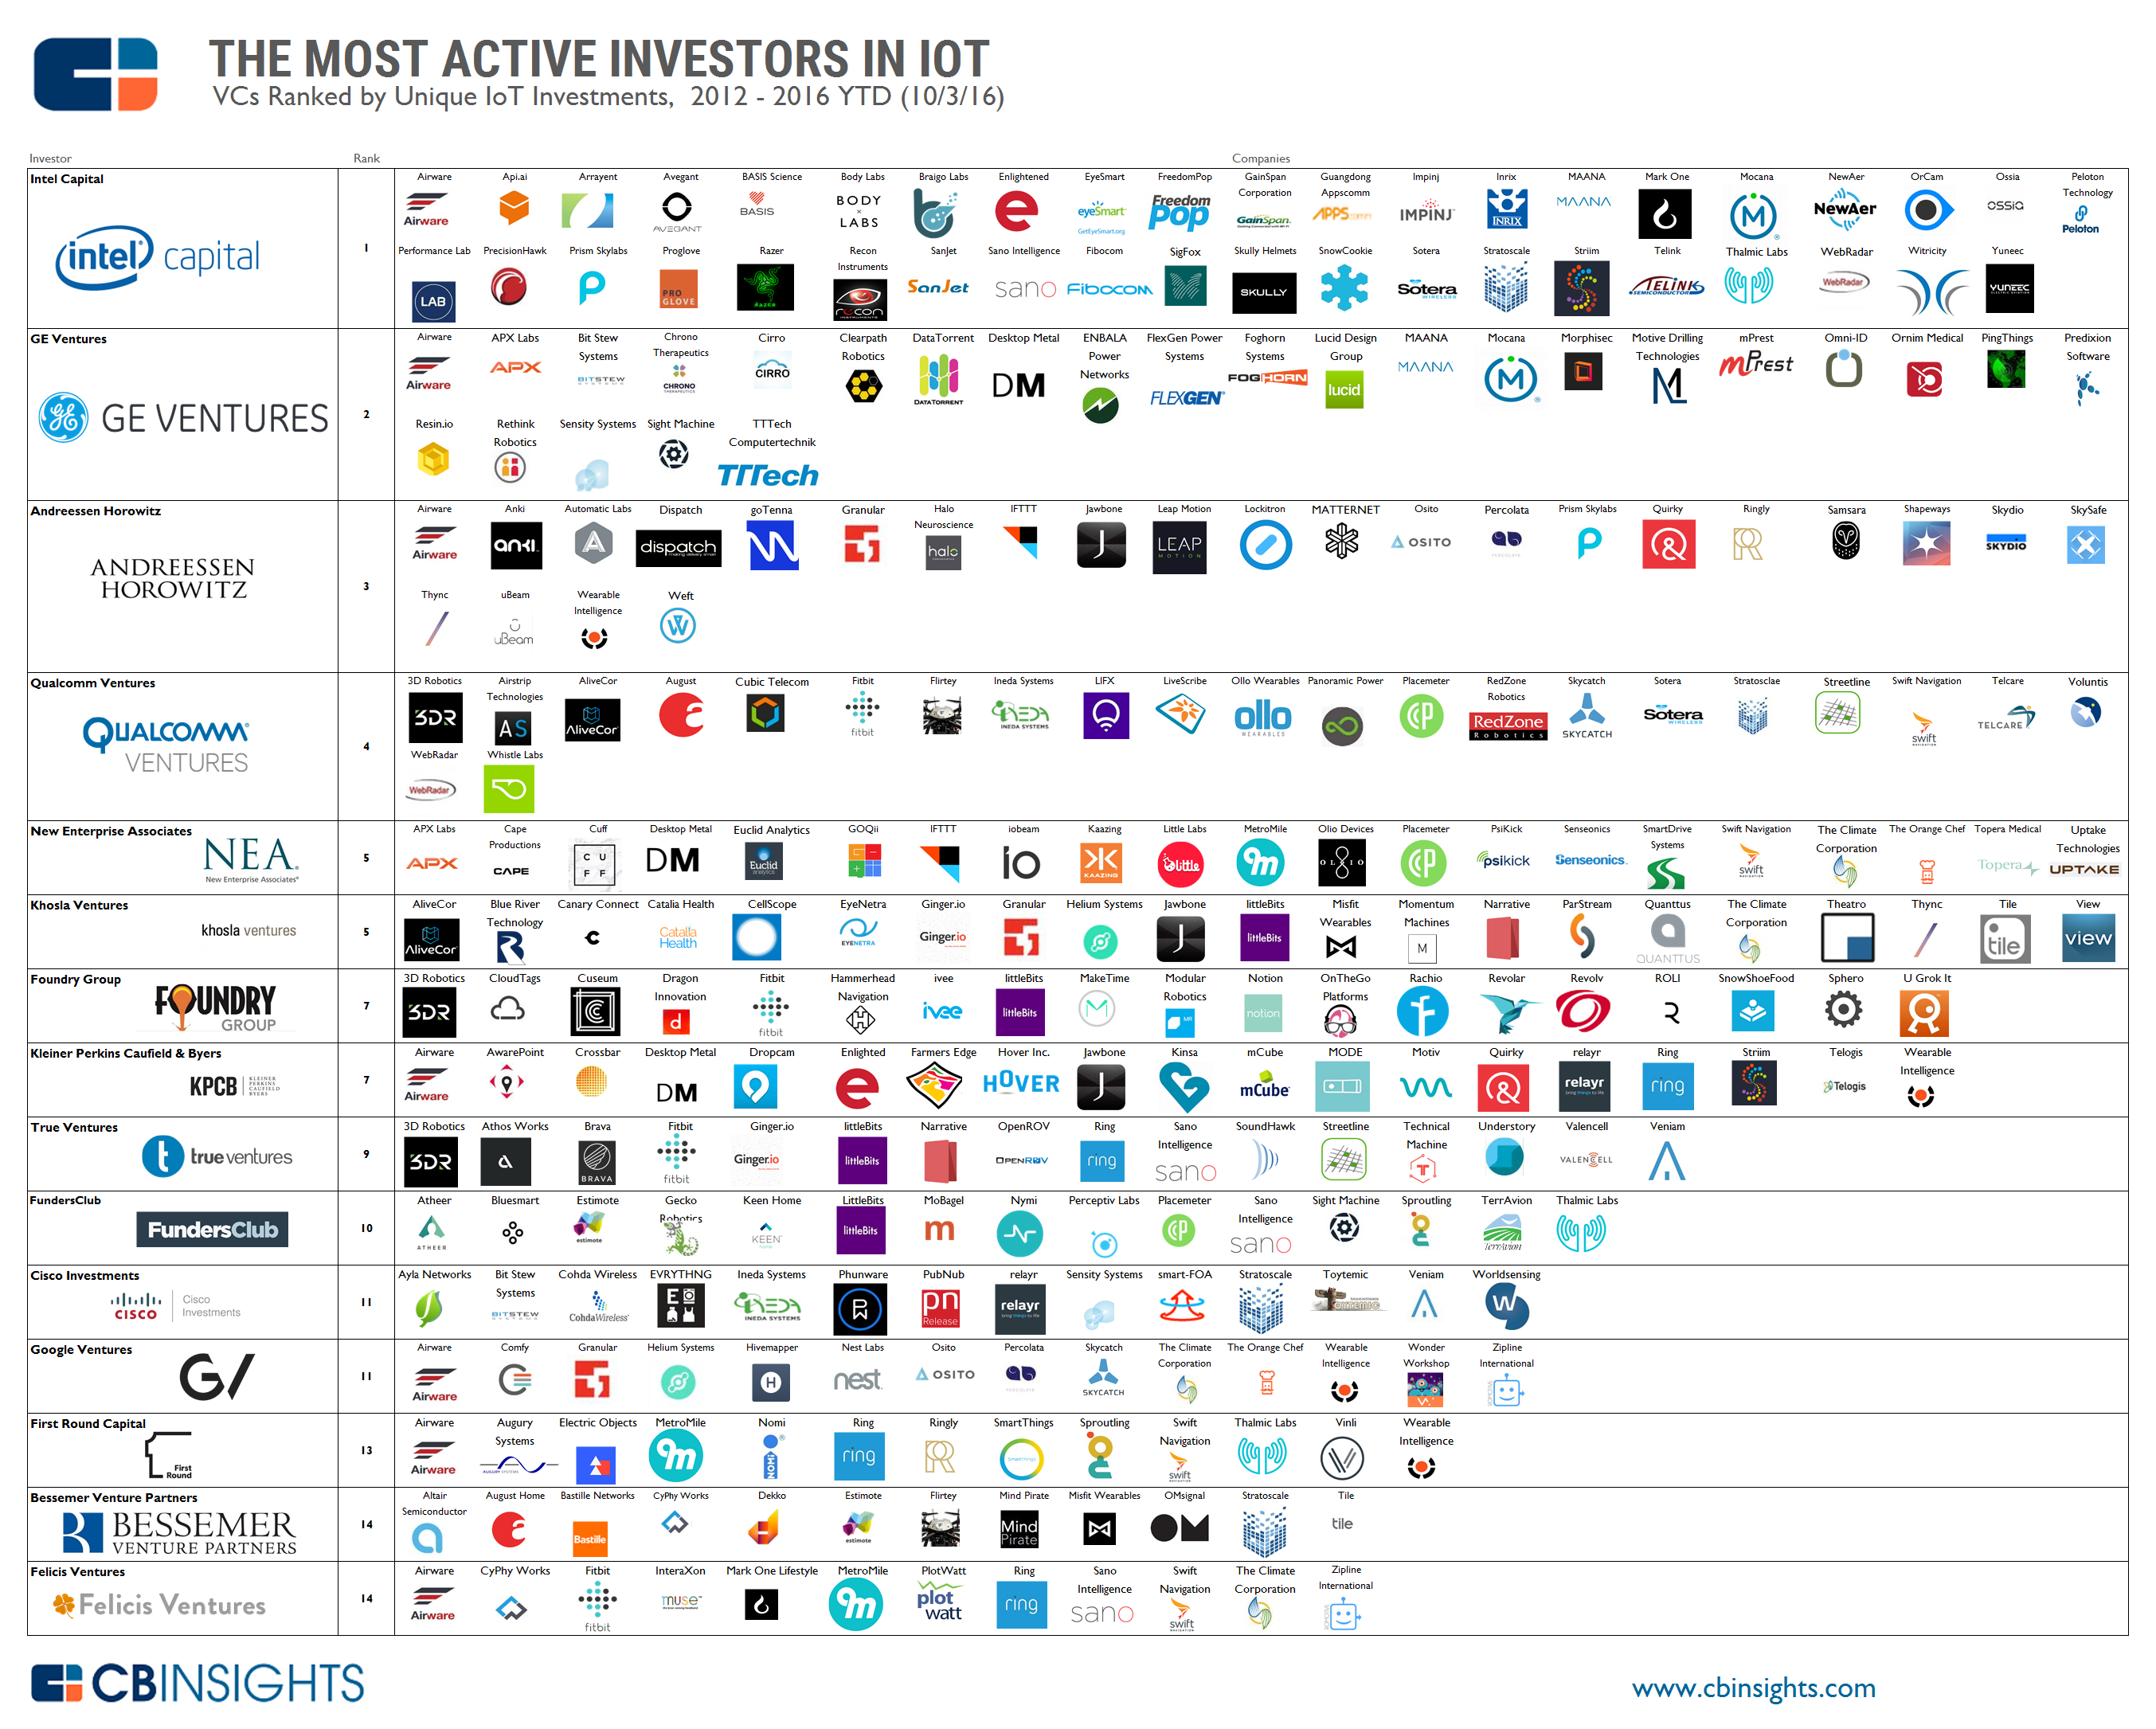
Five of the top 12 IoT investors are now corporate venture arms, including Intel Capital, GE Ventures, and Cisco Investments. Please refer to this chart from CBInsights:

Intel Capital still tops the list as the most active investor in IoT startups, with more than 40 unique IoT companies since 2012. GE Ventures wasn’t far behind (and is new to the ranking of top IoT investors) with recent investments in industrial-focused IoT startups like industrial analytics developer Sight Machine, fog computing platform Foghorn Systems, and commercial 3D printing startup Desktop Metal.
Following Andreessen Horowitz, the fourth-most active IoT investor is another CVC, Qualcomm Ventures. As CBInsights noted in prior investor roundups, Intel and Qualcomm are involved in designing and/or manufacturing ever-smaller chips to power mobile devices, and IoT likely offers them strategic value.
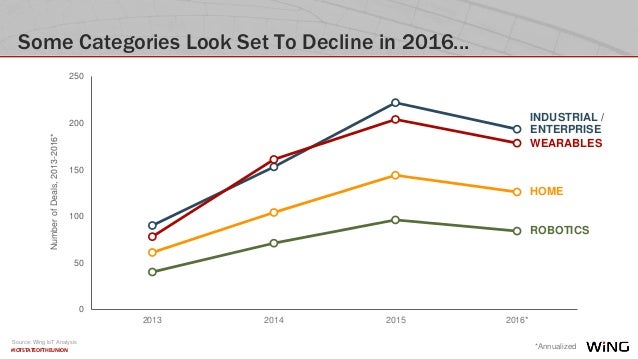
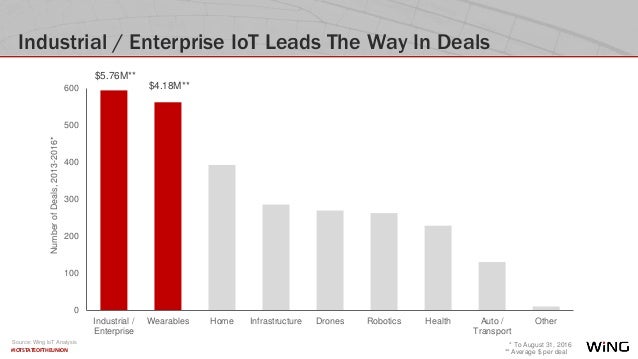
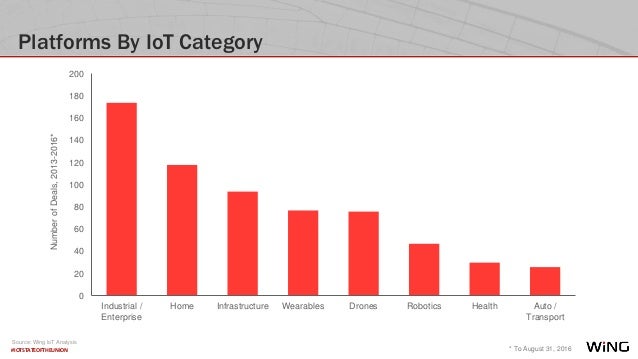
According to Wing VC (see reference& postcript below), Industrial/Enterprise IoT accounts for the largest number of funding deals over the past few years, followed by Wearables.
“When we ranked various sectors by total number of funding deals over the past three-and-a-half years, the Industrial/Enterprise category came out on top with almost 600 deals. We’re entering what’s been called the “Factory 4.0” era, in which a combination of sensors, software and backend cloud compute and storage is giving companies new insights into the performance of their physical assets. Quite a few deals in the manufacturing sub-category of Industrial/Enterprise IoT were of this nature. These startups can demonstrate swift “RoIoT”—or return on investment in IoT—to customers, who use the data and predictive analytics provided to minimize unplanned downtime and outages. On the Enterprise front, we saw a reasonable amount of activity in sub-categories such as building management services, healthcare and retailing.”
References on State of the IoT Market:
http://wing.vc/blog/iot-startup-state-of-the-union-2016
Postscript/Comment based on email from IEEE Member Discussion Group: