

Mobile Network Experience
Telia’s mobile network with CBTC technology deployed in Oslo metro line
Telia is claiming a European first with the deployment of a digital signaling system on the Oslo metro that operates over the Nordic telecom operator’s commercial 4G/5G mobile network. Sporveien is the Oslo subway transport operator.
Developed by Siemens Mobility, the system uses communications-based train control (CBTC) technology to link trains, trackside equipment and central control systems. According to Telia, CBTC enables far more precise train-position tracking than legacy signaling platforms, allowing operators to safely reduce headways and run trains more closely together.

Morten Karlsen Sørby, acting Head of Telia Norway: “As far as we know, only the New York City Subway uses a mobile network as part of a signaling system. It places high demands on availability and service quality, and Telia is ready to deliver. We congratulate Sporveien on this new system, and we’re very proud of our innovative collaboration with both Sporveien and Siemens Mobility.”
Today’s launch is on the Oslo Metro’s line 4 between Brattlikollen and Bergkrystallen, with implementation across the entire subway scheduled for 2030. The current signaling system has been in place since the Metro opened in 1966.
Birte Sjule, CEO of Sporveien: “The subway can only operate with a well-functioning signaling system, so this project is extremely important for Oslo’s residents. By replacing technology that has passed its useful life, we’ll reap additional benefits such as more frequent departures and increased capacity in the years to come.”
The solution delivered to Sporveien is part of Telia’s Enterprise Mobile Network (EMN) portfolio, which offers advanced and customized connectivity services to support industrial digitalization. EMN can use either 4G or 5G technology, or a combination, depending on the specific needs of the business.
Private 5G is now being integrated into CBTC systems to provide higher capacity, lower latency, and improved performance, especially in urban and high-demand environments. Companies are actively rolling out and testing CBTC with 5G, making it a next-generation standard for some new and retrofitted systems.
References;
Ericsson and Telia said to provide lower 5G latency & power dissipation/longer battery life
Non-coherent Massive MIMO for High-Mobility Communications
Selected Applications/Use Cases by Industry for ITU-R International Mobile Telecommunications (IMT) – 3G, 4G & 5G
Speedcheck’s Speed-Price Index (SPI) For Mobile Data in 89 Countries
By Gerard Kearney, Telecoms Consultant and Dr. Frederik Lipfert, CEO of Speedcheck (edited by Alan J Weissberger)
Speedcheck analyzed the mobile broadband speed experienced by the users of their speed test service in 89 countries across five continents and compared them against the prices consumers are paying for data in each country. The results are documented in a new Speed-Price Index (SPI) international ranking – a strong indicator of the value-for-money that consumers are getting for their mobile data when compared internationally.
The index increases as the speed increases and/or as the cost of data reduces. Thus, the higher the index the more value for money the mobile user enjoys.
The results could serve to lobby both governments and mobile telco operators to consider removing the artificial barriers that prevent operators from providing affordable mobile data to consumers worldwide, but without compromising performance.
Critical comparisons between speed (Mbps) and price ($/GB) from 89 countries were analyzed and converted into a unique Speed-Price Index (SPI) expressed in Mbps/$/GB. This service metric represents the most significant one that consumers depend on once connected to a network.
The various prices per GB across all 89 countries are sourced from Cable.co.uk’s1 worldwide mobile data price comparison for 2021 . For this present study, Speedcheck has adjusted these prices with the Purchasing Power Index (PPI) for each country2 which delivers a far more realistic international pricing comparison.
Countries Analyzed by Speedcheck for Value-For-Money Mobile Broadband Data:
|
Country
|
Download Speed [Mbps]
|
Average Price Per GB [$US]
|
Speed-Price Index (SPI) [Mbps/$/GB]
|
SPI Ranking (Global)
|
|---|
|
Country
|
Download Speed [Mbps]
|
Average Price Per GB [$US]
|
Speed-Price Index (SPI) [Mbps/$/GB]
|
SPI Ranking (Global)
|
|---|---|---|---|---|
| Israel | 7.12 | $0.09 | 82.3 | 1 |
| Italy | 18.2 | $0.41 | 44.2 | 2 |
| Fiji | 22.25 | $0.51 | 43.4 | 3 |
| Denmark | 28.68 | $0.90 | 31.8 | 4 |
| France | 17.97 | $0.57 | 31.6 | 5 |
| Australia | 22.4 | $0.88 | 25.5 | 6 |
| Finland | 28.13 | $1.26 | 22.3 | 7 |
| Austria | 26.98 | $1.34 | 20.1 | 8 |
| Russia | 8.67 | $0.67 | 13 | 9 |
| Sweden | 21.42 | $1.66 | 12.9 | 10 |
| Lithuania | 30.32 | $2.61 | 11.6 | 11 |
| Poland | 14.67 | $1.30 | 11.3 | 12 |
| The Netherlands | 36.76 | $3.54 | 10.4 | 13 |
| Kuwait | 9.62 | $0.95 | 10.1 | 14 |
Countries In The Americas Analyzed by Speedcheck for Value-For-Money Mobile Broadband Data:
|
Country
|
Download Speed [Mbps]
|
Average Price Per GB [$US]
|
Speed-Price Index (SPI) [Mbps/$/GB]
|
SPI Ranking (Regional)
|
SPI Ranking (Global)
|
|---|---|---|---|---|---|
| United States | 16.99 | $3.33 | 5.1 | 1 | 31 |
| Chile | 2.97 | $1.08 | 2.7 | 2 | 41 |
| Argentina | 7.43 | $3.16 | 2.3 | 3 | 45 |
| Puerto Rico | 15.49 | $6.90 | 2.2 | 4 | 46 |
| Brazil | 9.01 | $4.04 | 2.2 | 5 | 47 |
| Canada | 15.67 | $7.73 | 2 | 6 | 54 |
| Guatemala | 15.17 | $9.37 | 1.6 | 7 | 59 |
| Paraguay | 17.11 | $12.59 | 1.4 | 8 | 63 |
| Ecuador | 7.46 | $6.31 | 1.2 | 9 | 65 |
| Costa Rica | 8.13 | $7.76 | 1 | 10 | 66 |
| Dominican Rep. | 7.58 | $8.07 | 0.9 | 11 | 68 |
| Honduras | 5.32 | $5.72 | 0.9 | 12 | 69 |
| Mexico | 9.35 | $13.56 | 0.7 | 13 | 73 |
| Panama | 9.67 | $16.45 | 0.6 | 14 | 74 |
| El Salvador | 5.95 | $10.90 | 0.5 | 15 | 77 |
| Colombia | 5.17 | $12.33 | 0.4 | 16 | 80 |
| Peru | 1.03 | $6.32 | 0.2 | 17 | 85 |
Probably most surprising of all is Canada, with a disappointingly low SPI of just 2. It is ranked 6th place regionally and only 54th in the world. This is primarily due to the considerable price Canadian consumers must pay for their mobile data, at $7.73/GB(PPI-adjusted). In the region, Chile, Argentina, Puerto Rico and Brazil, as well as the U.S., all beat Canada for better value for money.
Looking at it from a purely speed metric only, Paraguay, with an average speed of 17.11 Mbps, beats the United States with 16.99 Mbps. But what is more concerning is the overall average speed for the Americas is considerably lower than that of Europe where, as we shall see in the next section, consumers in Bulgaria, Switzerland and The Netherlands are enjoying speeds of 46.63, 43 and 36.76 Mbps, respectively.
This combination of relatively slow speeds coupled with high prices keeps the countries of the Americas generally low on the global SPI ranking table.
Conclusions:
National governments and telecommunications regulators worldwide have had three opportunities over the past 20 years to get the spectrum auctions right for the government, right for the mobile telcos, and, above all, right for the consumer of essential mobile services. And yet, it seems few lessons have been learned from past mistakes.
Instead of focusing on allowing mobile network operators to grow and advance their network infrastructure to provide near-ubiquitous quality data connectivity to consumers, which is an essential backbone of the digital economy, unfortunately, many governments still seem fixated on trying to artificially maximize their revenues while displaying a lack of genuine concern for the fate of the mobile telcos and the consumer.
This has forced mobile telcos to pay exorbitant prices to use what is essentially a national resource that should be made readily available to every citizen. And this cost is undoubtedly being passed on by too many telcos to the consumer as essentially just another government value-added tax.
Consumers gladly pay a reasonable fee for clean water to be delivered to our homes. We do not expect governments to force water companies to pay billions of dollars for rainfall, only to pass that cost onto us! There would be a national uproar if such a thing were to happen.
So why should it be any different for another national resource, radio spectrum, which has now become an essential part of daily life and the furtherance of the digital economy in the form of mobile telecommunications? So, where is the uproar with this?
It is still not too late for national governments to review how they assign the national resource of radio spectrum to mobile telcos, even for the remaining 5G spectrum blocks that have yet to be awarded, and certainly for 6G going forward.
For example, one suggestion might be to use a combination of allocating reasonable fixed prices for blocks of spectrum to be sold to mobile operators based on the so-called “beauty contest” method. In this case, each company would submit its best tender to buy the spectrum resource at the fixed fee.
The spectrum fee would serve several purposes. First, it would eliminate unsuitable or speculative applicants who would never qualify for a mobile network license anyway while also promoting quality competition among the real key players. And second, it would assist in the smooth running of the spectrum allocation process.
The fee should be capped at a price that the operator can reasonably take on as a sunk capital investment or else readily recoup by passing on a small marginal cost to the consumer. It would therefore be up to the economists to determine the optimal market price for such spectrum. And if that should yet again turn out to be in the multiple billions of dollars, then, again, there is something seriously wrong. The market cannot sustain that level of overhead.
This proposed method also leaves the operator with more reserve capital funds to build out their future 5G and 6G network infrastructures and services for the benefit of the consumer.
With this, governments still get their moderate revenue, while operators do not end up saddled with enormous debt or strapped for cash for decades to come that shackles them from rolling out 5G or 6G services promptly. Also, consumers would not need to be unfairly burdened with exorbitant indirect “taxes.”
Whatever the way forward is, what is clear is government regulators must learn from the past. They must avoid policies that artificially inflate the price of radio spectrum for mobile telcos. They should also do away with measures that serve only to encourage unbridled and frenetic bidding sprees for blocks of spectrum that are deliberately released piecemeal as if they are as scarce as hen’s teeth when that is not the case.
Finally, to those mobile operators who do provide great value for money to data consumers despite the poorly managed auctions that have taken place in the past, we salute you. We mark you out as examples that others should be encouraged to follow. Special mention in this regard must go to Denmark, Finland and Australia.
But possibly the most outstanding example in this regard worldwide is a small island in the South Pacific where you can get 22.25 Mbps at only $0.51/GB. In Fiji, at least, the mobile customer still appears to be king.
Sources:
1 https://www.cable.co.uk/mobiles/worldwide-data-pricing/ Mobile data prices are the average within each country for consumer plans, expressed in $/GB.
2 Purchasing Power Index (PPI) reflects the cost of living coupled with the typical income in a country. It is normalised against a reference country, which here is the United States and the U.S. dollar. Our primary source for this index is https://www.worlddata.info, and our secondary source is https://www.numbeo.com.
3 https://www.mobileworldlive.com/featured-content/top-three/italian-regulator-defends-5g.auction/ 11 Oct., 2018.
4 GSMA Spectrum: “Effective Spectrum Pricing In Europe: Policies to support better quality and a more affordable mobile services”, Sept., 2017, Figure 1: Coverage Spectrum Prices by Category (2007-2016), Page 7 (sourced by NERA Economic Consulting). Note: spectrum prices are expressed and categorized in the price paid per MHz of bandwidth, per head of population ($/MHz/pop).
……………………………………………………………………………………………………………………………………………
About Frederik Lipfert, PhD:
Frederik is the CEO and Co-Founder of Speedcheck. He is interested in increasing transparency around internet performance through data-driven analysis. Dr. Lipfert received a PhD in Physics from University of Münster (WWU) in 2014 and a MS in Physics from Technical University Munich (TUM) in 2010.
…………………………………………………………………………………………………………………………………………
Addendum from RootMetrics:
U.S. 5G scorecard: Who’s leading the 5G race so far in 2021?
Our 5G Scorecard also breaks out results from 20 recently tested cities to show trends and demonstrate just how quickly the 5G leaderboard can shift.
We’re also pleased to introduce a new way of looking at 5G performance that captures the most typical user experience of switching between 5G-only and “5G mixed mode,” an increasingly common user experience of switching between 5G and 4G LTE during the same data activity. By combining results on 5G-only technology with those on 5G mixed mode, our Everyday 5G results show the most accurate view of a user’s typical experience when connected to 5G for any amount of time.
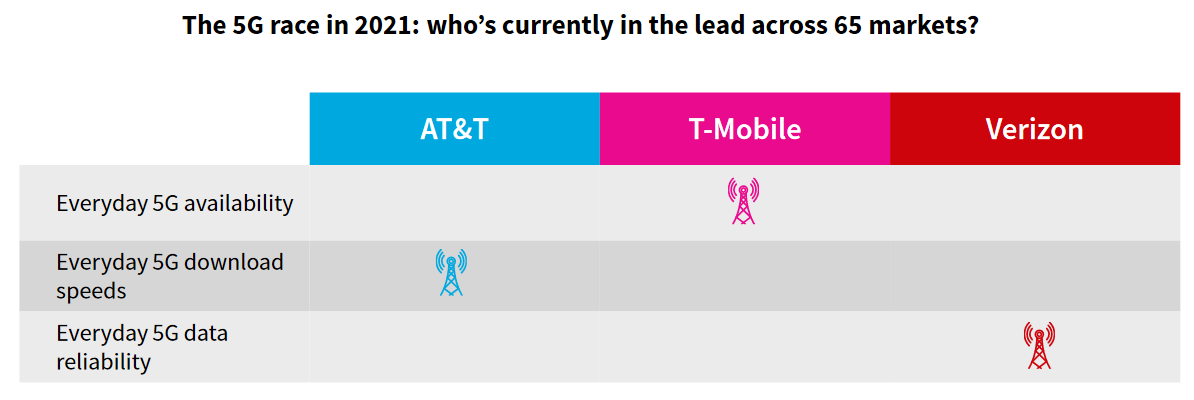
https://www.zdnet.com/article/rootmetrics-5g-scorecard-t-mobile-leads-in-everyday-5g-availability/
…………………………………………………………………………………………………………………………………………..
References:
https://www.speedcheck.org/price-of-speed-mobile-data/
https://www.speedcheck.org/5g-in-the-us-network-of-the-future/
Performance analysis of big 3 U.S. mobile operators; 5G is disappointing customers
Fastest 5G network in the U.S.? T-Mobile vs Verizon; Nokia’s fastest 5G claim
Key findings in OpenSignal’s “State of the Mobile Network Experience” report
According to a new OpenSignal report, South Korea is well ahead of any other country in the world when it comes to Download speed experience, with average speeds topping 50 Mbps. Only Norway comes close, with even third-placed Canada a clear 10 Mbps behind. OpenSignal saw a huge range of scores in this metric, with the lowest average score being less than 2 Mbps.

The biggest variation between Upload speed experience scores of our users was at the top end of the table, where the gap between leader Denmark and tenth-placed Canada was over 5 Mbps.
In only 13 of the 87 countries we rated our users averaged Latency experience scores under 40 milliseconds, while none scored under 30ms. One continent dominated our Latency Experience analysis, with six European countries in our top 10.5G’s designers target much improved latency as one of their goals.
At the other end of the scale we inevitably have developing countries, but it’s surprising to see India still lagging at 6.8 Mbps average despite all the investment from Reliance Jio, which has been focused on coverage rather than speed. India is doing a lot better in terms of 4G availability. The average Indian mobile user has access to 4G about 91% of the time according to OpenSignal.
Only four European countries made OpenSignal’s 4G Availability top 10 — the fewest of any of our award metrics. And both the U.S. and India made the top 10, despite being distinctly mid-table in all other key metrics. One of the standout countries to feature in the top five of our 4G Availability rankings was the U.S. which was distinctly mid-table across all other key award metrics but managed a fifth-place finish in 4G Availability. In our most recent Mobile Network Experience USA report, we saw Verizon overtake T-Mobile following a fierce battle in this metric. This rivalry has driven up 4G Availability in the country, leading to a world-class position for the U.S. in our rankings.

Indeed, 4G is becoming more and more ubiquitous, even in developing markets. OpenSignal’s analysis shows that the average 4G Availability
across the 87 countries experienced by our users is close to 80%, with 15 markets scoring over the 90% mark. The top ends of our tables were
largely dominated by European countries, but no one country appeared in the top 10 for all five of our key metrics. European countries, however,
dominated, racking up far more top 10 entries than any other region.
In a ranking of the 10 countries who scored highly across all five key metrics, only two were from outside Europe.

Norway was #1 in the Video Experience category despite of being even worse than Korea when comes to latency. Hungary was #2. Astonishingly, only six non European countries among the top 25 who all scored a Very Good rating (65-75 out of 100).
5G should mean more consumers will be able to enjoy a good mobile Video Experience more often because of the increased mobile capacity new high frequency 5G spectrum will provide to mobile operators.
You can download the complete OpenSignal (free) report here.
