

Verizon trial validates NG-PON2 interoperability via its OpenOMCI specification; 5G backhaul spending
Verizon reported a successful trial of next-generation passive optical networking NG-PON2 technology using the carrier’s OpenOMCI specification. The OpenOMCI specification is aligned with ITU-T Recommendation G.989.3, but there are different versions from several carriers.
It’s important to note that this is Verizon’s own version of the OpenOMCI spec. Verizon, along with ADTRAN, Broadcom, Cortina Access, Ericsson/Calix and Intel, worked together to develop the OpenOMCI specification that led to the successful trial. The specification defines the OLT-to-ONT interface and is aligned with the ITU-T Recommendation G.989.3. Since the initial NG-PON2 trial by Verizon in December 2016 , these companies intend to make their hardware and software compliant and are actively contributing to the OpenOMCI specification.
AT&T also published an OpenOMCI specification just a few weeks ago, based on ITU-T G.988 Managed Entities. AT&T intends to deploy an XGS-PON architecture as part of the overall FTTP solution for its Lightspeed service, hence its OpenOMCI spec differs from Verizon’s FiOS-based one. XGS-PON is championed by Nokia (who is not part of Verizon’s vendor group) and also delivers 10Gbit/s to customers.
The trial at Verizon’s technology center in Waltham, MA involved optical network terminal management and provisioning.
By outlining the tools necessary to model a multi-wavelength PON, Verizon says the OpenOMCI specification optimises the number of managed entities and methods that can be used to implement a particular service function while disallowing vendor-proprietary objects and features that have provided a major obstacle for interoperability efforts until now. The OpenOMCI also includes specific managed entities that, in Verizon’s opinion, improve the stability of PON systems. With today’s PON deployments, telcos are obliged to use the same vendor for both optical line terminals (OLT) and optical network terminals (ONT) which prevents multi-vendor interoperability.
“The NG-PON2 interoperability effort is important, not only for Verizon but for NG-PON2 technology, and is based on lessons learned over the last 13 years of PON deployment and great partnerships,” said Vincent O’Byrne, PhD and director of technology at Verizon. “We see this work as removing a major roadblock and helping accelerate NG-PON2 deployment.”
O’Byrne told FierceTelecom that the OpenOMCI specification will help to ensure the company can deploy an array of OLTs and ONTs in its network. He said:
“Since October 2016 we have been working with the vendors on enabling interoperability to mix and match one vendor’s OLT with another vendor’s ONTs, which is an object we have had since we started deploying BPON in 2004. “We have been working with these vendors and have developed OpenOMCI communications between the OLT and the ONT and how that issue is handled for NG-PON2.”
Along with ONT management and provisioning, the trial investigated transmission convergence layer features that allow support of not only business and residential traffic but wireless transport services. These features are a unique addition to NG-PON2 compared to other PON systems.
“We continuously sought the various contributors’ feedback and constructive input,” said Denis Khotimsky , Distinguished Member of the Technical Staff and Verizon’s lead engineer for the trial. “NG-PON2 technology creates specific challenges for the management layer to handle, such as multi-wavelength operations, pluggable optics and multiple interface enhancements. The Verizon OpenOMCI specification meets those challenges.”
Representatives of several telcos interested in the NG-PON2 technology – including Deutsche Telekom, SK Telecom and Vodafone – participated in the trial as virtual observers, which gave them access to the specification, test plans and readouts.
Following the successful completion of the trial, Verizon shared its OpenOMCI specification with the industry for possible inclusion within the appropriate standards. A copy of Verizon OpenOMCI specification can be found here.
References:
http://www.telecompetitor.com/verizon-partners-demonstrate-key-ng-pon2-interoperability-milestone/
http://www.fiercetelecom.com/telecom/verizon-completes-openomci-interoperability-testing-for-ng-pon2
………………………………………………………
Addendum: On July 18th, Fierce Telecom reported: 5G backhaul spending to reach $2B by 2022, NG-PON2 to dominate
“The technology that will dominate 5G backhaul will be NG-PON2,” CIR stated. “By 2022, more than $890 million will be spent on this technology for 5G backhaul.”
The analyst firm noted that Verizon has selected NG-PON2 for 5G backhaul. Top vendors, including Cisco, Nokia, Huawei, Calix, Adtran, Ericsson and Alcatel-Lucent all have PON solutions for 5G backhaul.
NG-PON2 should remain the most popular technological choice, provided prices come down as expected, based on the development of less costly tunable components, CIR said. Most of the suppliers of those components will be based in China, the firm expects.
CIR also calculated that more than 170,000 fiber miles (280,000 kilometers) of cable is expected to be shipped for 5G backhaul applications in 2022, with major fiber and cable suppliers such as Corning already showing signs of specifically targeting 5G infrastructure with their products.
The firm also noted that the introduction of high-speed wireless may have the side effect of reducing the need for fiber to the premise/home (FTTP/FTTH).
There will be some short-term uncertainty until 5G standards are finally ratified, but CIR concluded that “5G is potentially a massive opportunity for the fiber optics industry, with this taken to include opportunities for the makers of modules and components as well as the fiber/cable manufacturers themselves.”
Microsoft White Spaces Plan would bring 2 million Americans online by 2022
Microsoft today announced a project to bring broadband internet access to rural parts of the U.S. using TV white spaces, unlicensed and unused spectrum. Microsoft President Brad Smith unveiled details about the initiative at a Tuesday event in Washington, D.C. as a way to bridge the digital divide between urban and rural areas.
Microsoft’s ambitious plan, dubbed the Rural Air-band Initiative, will begin in 12 states, where the company said it will invest in broadband connectivity alongside local telecom services. The company said that it does not intend to enter the telecom business itself or profit directly from the initiative. Instead, Microsoft said it will supply the upfront capital required to expand broadband coverage, then recoup that cost by sharing in the revenue with local operating partners.
The company is calling for a combination of private and public investments to get about 2 million rural Americans online in the next five years. Microsoft plans to partner with telecommunications companies that serve rural counties in 12 states: Wisconsin, Michigan, North Dakota, South Dakota, Kansas, Washington, Texas, Arizona, Georgia, Virginia, New York and Maine. It’s also asking for regulatory support from the Federal Communications Commission.
Mr. Smith will also urge President Donald Trump and his administration to ensure that unlicensed white space is available in all U.S. markets. “As a country, we should not settle for an outcome that leaves behind more than 23 million of our rural neighbors,” Smith wrote in a blog post.
“To the contrary, we can and should bring the benefits of broadband coverage to every corner of the nation,” he added. Smith said the TV white spaces provides powerful bandwidth to allow wireless signals to travel over hills and through buildings and trees.
“Today, 34 million Americans still lack broadband internet access, which is defined by the Federal Communications Commission as a 25 Mbps connection,” Smith posted. “Of these, 23.4 million live in rural parts of our country. People who live in these rural communities increasingly are unable to take advantage of the economic and educational opportunities enjoyed by their urban neighbors.” Smith said Microsoft wants to eliminate the rural broadband gap by July 4, 2022.
“Our goal is to serve as a catalyst for market investments by others in order to reach additional rural communities,” he stated in his blog post.
Microsoft company faces many hurdles with the technology. For one, few manufacturers are making devices compatible with white-spaces technology, and some devices that can be used with the technology cost more than $1,000 each. The National Association of Broadcasters, a trade group, said that only 800 devices that worked with white-spaces technology had been registered with regulators.
“White spaces has tremendous opportunity to help with broadband coverage in rural areas, but it’s hard to justify the cost to device makers who don’t see economies of scale in rural areas,” said Doug Brake, a senior analyst at the Information Technology & Innovation Foundation, a research organization that is sponsored by tech companies including Microsoft.
Mr. Smith said that he would demonstrate four devices that work with white-space technology at Tuesday’s event, adding that prices for such gadgets would fall below $200 by next year.
Another challenge is a battle with television broadcasters who have long argued that devices on the unused airwaves can interfere with the broadcasts run on neighboring channels. This week, the National Association of Broadcasters filed comments with the Federal Communications Commission arguing against Microsoft’s request for one nationwide channel to be set aside for white-spaces use.
“Microsoft has been making promises about white-spaces technology for well over a decade,” Patrick McFadden, an associate general counsel for the association, wrote in comments to the commission. “At what point do we finally conclude that the white spaces project is a bust?”
References:
https://www.microsoft.com/en-us/research/project/dynamic-spectrum-and-tv-white-spaces/
http://whitespaces.microsoftspectrum.com/
https://www.theverge.com/2017/7/11/15953310/microsoft-rural-airband-broadband-strategy
http://www.detroitnews.com/story/tech/2017/07/11/rural-broadband-microsoft/103618818/
https://www.microsoft.com/en-us/research/project/networking-over-white-spaces-knows/
China Orders Telecom Companies To Block VPN Access to Global Internet
China’s government has reportedly directed telecommunications companies to block their users from accessing a secure internet network.
The country’s authorities are specifically mandating that state-run wireless carriers — like China Telecom, China Unicom and China Mobile — forbid people from using virtual private networks (VPNs). China is giving the quasi-private companies until Feb. 1, 2018 to comply with its orders, according to Bloomberg.
The technological capability gives users the ability to navigate the web anonymously through an encrypted, secure connection.
VPNs enable Chinese citizens with the ability to circumvent the country’s firewall (also known as the Great Firewall of China), which technically prohibits people from accessing many online services and sites that are available on the global internet. Social media sites like Facebook and Twitter, for example, are not accessible due to the firewall, so many Chinese citizens use Sina Weibo, a similar platform that is based in China and adheres to government’s calls for targeted censorship.
China’s propensity towards censorship manifests itself quite often, in fact, including in late June when the popular Netflix original “BoJack Horseman” was blocked just days after debuting in the country. (RELATED: China Battles For Internet Hegemony After America Gives Up Control)
“In the past, any effort to cut off internal corporate VPNs has been enough to make a company think about closing or reducing operations in China. It’s that big a deal,” Jake Parker, vice president of the U.S.-China Business Council, told Bloomberg.
“VPNs are incredibly important for companies trying to access global services outside of China,” he said, adding that the order also seems to affect individuals across the country.
References:
https://en.wikipedia.org/wiki/Internet_censorship_in_China
http://www.cnbc.com/2017/07/10/china-bans-vpns-to-further-tighten-internet-controls-says-report.html
https://www.theguardian.com/world/2017/jul/11/china-moves-to-block-internet-vpns-from-2018
https://www.bloomberg.com/news/articles/2017-07-10/china-is-said-to-order-carriers-to-bar-personal-vpns-by-february
Overview & Schedule for ITU-R WP 5D: IMT 2020 True “5G” Standards
Overview of ITU-R Working Party 5D work (as per July 5, 2017 report):
Working Party 5D:
1. Is responsible for the overall system aspects of the terrestrial component of IMT, comprising IMT-2000, IMT-Advanced, and IMT for 2020 and beyond.
2. Has the prime responsibility within ITU-R for issues related to the terrestrial component of IMT, including technical, operational and spectrum related issues to meet the objectives of future IMT systems.
3. Is the lead group for the overall maintenance of existing and the development of new Reports/Recommendations on IMT.
4. Is responsible for studies related on aspects regarding the continued deployment of IMT‑2000 and IMT-Advanced including aspects such as convergence impacts regulatory and operational matters within the purview of Study Group 5.
5. Will continue to work closely with Working Parties 4B and 4C on issues related to the satellite component of IMT.
6. Will continue to work closely with other Working Parties on issues relevant for IMT systems.
……………………………………………………………………………………………….
Scopes for the various ITU-R WP 5D Working Groups:
WG GENERAL ASPECTS:
– To develop deliverables on services, forecasts, and also convergence of services of fixed and mobile networks which take account the needs of end users, and the demand for IMT capabilities and supported services. This includes aspects regarding the continued deployment of IMT, other general topics of IMT and overall objectives for the long-term development of IMT. To update the relevant IMT Recommendations/Reports.
– To ensure that the requirements and needs of the developing countries are reflected in the work and deliverables of WP 5D in the development of IMT. This includes coordination of work with ITU-D Sector on deployments of IMT systems and transition to IMT system.
WG TECHNOLOGY ASPECTS:
– To provide the technology related aspects of IMT through development of Recommendations and Reports. To update the relevant IMT‑2000 and IMT-Advanced Recommendations. To work on key elements of IMT technologies including requirements, evaluation, and evolution. To develop liaison with external research and standardization forums, and to coordinate the external and internal activities related to the IMT-2020 process.
– To manage the research topics website and its findings.
WG SPECTRUM ASPECTS:
– To undertake co-existence studies, develop spectrum plans, and channel/frequency arrangements for IMT. This includes spectrum sharing between IMT and other radio services/systems coordinating as appropriate with other Working Parties in ITU-R.
AD HOC WORK PLAN:
– To coordinate the work of WP 5D to facilitate efficient and timely progress of work items.
…………………………………………………………………………………………………………………………………
Meeting schedule
The following table shows the proposed meeting dates for Working Party 5D following on WRC‑15. Some adjustment of these dates might be required to accommodate availability of facilities at specific venues. Every effort will be made to keep these dates as listed. Please check the ITU website in case meeting details have changed. (http://www.itu.int/events/monthlyagenda.asp?lang=en)
|
GROUP |
No. |
FROM |
TO |
PLACE |
COMMENTS |
|
WP 5D |
23 |
23 February 16 |
2 March 16 |
China |
7 working day meeting |
|
WP 5D |
24 |
14 June 16 |
22 June 16 |
Geneva |
7 working day meeting |
|
WP 5D |
25 |
5 October 16 |
13 October 16 |
Geneva |
7 working day meeting |
|
WP 5D |
26 |
14 February 17 |
22 February 17 |
Geneva |
7 working day meeting |
|
WP 5D |
27 |
13 June 17 |
21 June 17 |
Canada |
7 working day meeting |
|
WP 5D |
28 |
3 October 17 |
11 October 17 |
Germany |
7 working day meeting, including a one-day workshop |
|
WP 5D |
29 |
31 January 18 |
7 February 18 |
[Korea] |
|
|
WP 5D |
30 |
13 June 18 |
20 June 18 |
[TBD] |
|
|
WP 5D |
31 |
9 October 18 |
16 October 18 |
[Japan] |
|
|
WP 5D Expert meeting |
31bis |
[11 February 19] |
[15 February 19] |
[TBD] |
If needed. Focus of meeting towards RA-19 and WRC-19 |
|
CPM19-2 |
– |
18 February 19 |
28 February 19 |
Geneva |
|
|
WP 5D |
32 |
9 July 19 |
17 July 19 |
[TBD] |
7 working day meeting |
|
RA-19 |
– |
21 October 19 |
25 October 19 |
Geneva |
|
|
WRC-19 |
– |
28 October 19 |
22 November 19 |
[Egypt] |
|
|
WP 5D |
33 |
[9 December] 19 |
[13 December] 19 |
[TBD] |
Focus meeting on evaluation (WG Technology Aspects) |
|
WP 5D |
34 |
19 February 20 |
26 February 20 |
[TBD] |
|
|
WP 5D |
35 |
24 June 20 |
1 July 20 |
[TBD] |
|
|
WP 5D |
36 |
7 October 20 |
14 October 20 |
[TBD] |
………………………………………………………………………………………………………………………………..
Work with involved organizations, including research entities:
The strategy for ITU-R WP 5D going forward is to gather information from the organizations involved in the global research and development and those that have an interest in the future development of IMT and to inform them of the framework and technical requirements in order to build consensus on a global level.
ITU-R WP 5D can play an essential role to promote and encourage these research activities towards common goals and to ensure that information from the WP 5D development on the vision, spectrum issues, envisioned new services and technical requirements are widespread among the research community. In the same manner, WP 5D encourages inputs from the external communities involved in these research and technology developments.
It is evident that continuing dialogue between the ITU and the entities taking part in research is a key to the continuing success of the industry in advancing and expanding the global wireless marketplace.
Working Party 5D, as is the case with all ITU organizations, works from input contributions submitted by members of the ITU. In order to facilitate receipt of information from external entities who may not be direct members of ITU, the Radiocommunication Bureau Secretariat may be considered as the point of interface, in accordance with Resolution ITU-R 9‑5.
The following major activities are foreseen to take place outside of the ITU, including WP 5D, in order to successfully complement the WP 5D work:
– research on new technologies to address the new elements and new capabilities of IMT‑2020;
– the ongoing development of specifications for IMT and subsequent enhancements.
………………………………………………………………………………………
Agreed overall deliverables/workplan of WP 5D
The following table provides the schedule of when approval of the planned major deliverables will be achieved following the procedures of WP 5D.
|
October 2017 |
TBD WP 5D #28 |
• Finalize revision of Recommendation ITU-R M.2012 • Liaison Reply to Task Group 5/1 |
|
February 2018 |
TBD WP 5D #29 |
• Finalize input to WP 1A on WRC-19 agenda item 1.15 • Finalize CPM text on WRC-19 agenda item 9.1, issue 9.1.1 • Finalize draft new Report ITU-R M.[IMT.MS/MSS.2GHz] |
|
June 2018 |
TBD WP 5D #30 |
• Finalize CPM text on WRC-19 agenda item 9.1, issue 9.1.8 (MTC) • Finalize draft new Report ITU-R M.[IMT.EXPERIENCES] • Finalize draft new Report ITU-R M.[IMT. MTC] • Further update/Finalize draft new Report/Recommendation ITU-R • Finalize input to WP 4A on WRC-19 agenda item 9.1, issue 9.1.2 |
|
October 2018 |
TBD WP 5D #31 |
• Finalize draft new Report ITU-R M.[IMT.1452-1492MHz] • Finalize draft new Report/Recommendation ITU-R M.[IMT.3300 MHz RLS] • Finalize draft new Recommendation ITU-R M.[MT.3300 MHz FSS] • Finalize draft new Report/Recommendation ITU-R M.[IMT.COEXISTENCE.AMS] • Finalize draft revision of Report ITU-R M.2373 • Finalize revision of Recommendation ITU-R M.1036 • Finalize draft new Report ITU-R M.[IMT.BY.INDUSTRIES] • Finalize revision of Recommendation ITU-R M.1457 |
|
July 2019 |
TBD WP 5D #32 |
• Finalize Doc. IMT-2020/YYY Input Submissions Summary • Finalize Addendum 4 to Circular Letter IMT‑2020 |
|
October 2019 |
TBD WP 5D #33 |
|
|
February 2020 |
TBD WP 5D #34 |
• Finalize Doc. IMT-2020/ZZZ Evaluation Reports Summary • Finalize Addendum 5 to Circular Letter IMT‑2020 |
|
June 2020 |
TBD WP 5D #35 |
• Draft new Report ITU-R M.[IMT-2020.OUTCOME] • Finalize Addendum 6 to Circular Letter IMT‑2020 |
|
October 2020 |
TBD WP 5D #36 |
• Finalize draft new Recommendation ITU-R M.[IMT‑2020.SPECS] • Finalize Addendum 7 to Circular Letter IMT‑2020 |
…………………………………………………………………………………………………………………………………
Detailed timeline and process for Technology related work stream towards IMT-2020:
Working Party 5D has developed a work plan, timeline, process and required deliverables for the future development of IMT, necessary to provide by 2020 timeframe, the expected ITU-R outcome of evolved IMT in support of the next generation of mobile broadband communications systems beyond IMT-Advanced.
Circular Letter(s) are expected to be issued at the appropriate time(s) to announce the invitation to submit formal proposals and other relevant information.
It has been agreed that the well-known process and deliverable formats utilized for both IMT-2000 and IMT-Advanced should be utilized also for IMT-2020 and considered as a “model” for the IMT‑2020 deliverables to leverage on the prior work.
…………………………………………………………………………………………………………………
Dates have been decided for RA-19 (21-25 October 2019) and WRC-19 (28 October – 22 November 2019).
The WP 5D #32 (July) is the main meeting for year 2019.
The WP 5D #33 is to be held in December with a focus on the evaluation process (WG Technology Aspects).
If needed there is an opportunity for expert meeting to focus on preparation towards WRC-19 (WG General Aspects and WG Spectrum Aspects) prior to the WP 5D #32 (July).

Click on above image to enlarge. Source: ITU-R WP5D report, 5 July 2017
………………………………………………………………………………………………
Reference:
Timeline for IMT 2020 (5G) Radio Access Recommendations + Evaluation Methodology
5G in India dependent on fiber backhaul investments
Excerpts of an article in the Economic Times of India by Ankit Agarwal:
Executive Summary:
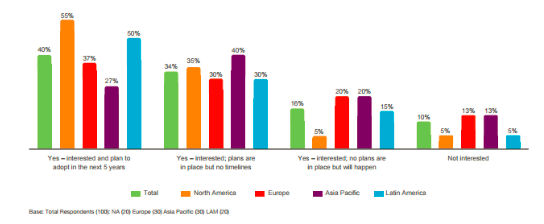
In the wake of growing awareness around Internet of Things (IoT) and the use cases it presents to Indian businesses and consumers, 5G will open a new era of opportunities for telecom operators and ecosystem partners in the country.
AJW Comment: However, fiber backhaul will be needed and that may take some time as India’s fiber infrastructure needs significant improvement.
“One of the fundamental requirements for 5G is strong backhaul which is simply not there and that is the most time consuming part and it is extremely expensive in today’s condition in India,” Jalaj Choudhri, EVP, Reliance Communications said. He adding that even if India is able to circumvent the challenges of standardization and 5G truly becomes available by 2020, yet a good 5G network cannot be expected unless we have a reliable and strong backhaul.
More in this article.
Current Status of 5G in India:
In India, Nokia has recently signed an MoU with wireless network operators BSNL and Airtel to collaborate on 5G technology solutions, and Reliance Jio is working with Samsung to explore various technologies and equipment for 5G.
In the wake of growing awareness around Internet of Things (IoT) and the use cases it presents to Indian businesses and consumers, 5G will open a new era of opportunities for telecom operators and ecosystem partners in the country. Though it’s difficult to get an accurate estimate of the market size right now, IoT is expected to provide a $15 billion market opportunity for Indian businesses by 2020, according to officials at Department of Telecom (DoT). Combine this with the unprecedented growth in the number of smartphone users in India, which is expected to overtake the U.S. in terms of smartphone shipment by 2019. Analysts are optimistic that India will hold around 15% of the world’s smartphone market share by that period – Indian consumers are ready for 5G.
Roadblocks for Indian Operators
Indian operators, however, need to address the issues surrounding 5G infrastructure and deployment. Challenges involving regulatory policies, investments and infrastructure readiness need to be addressed on priority.
Challenges ahead for telecom operators in India are multi-fold compared to their peers in the rest of the world. Diverse geography, disparate population and disparity in economic distribution among the rich and the poor pose serious challenges to operators, preventing uniform investments across different telecom circles. Also, issues such as Right of Way (RoW) have created uncertainty in fiber investments across different states. These apart, the rising cost of air waves and the challenges involved in migrating to new technologies bring additional challenges.
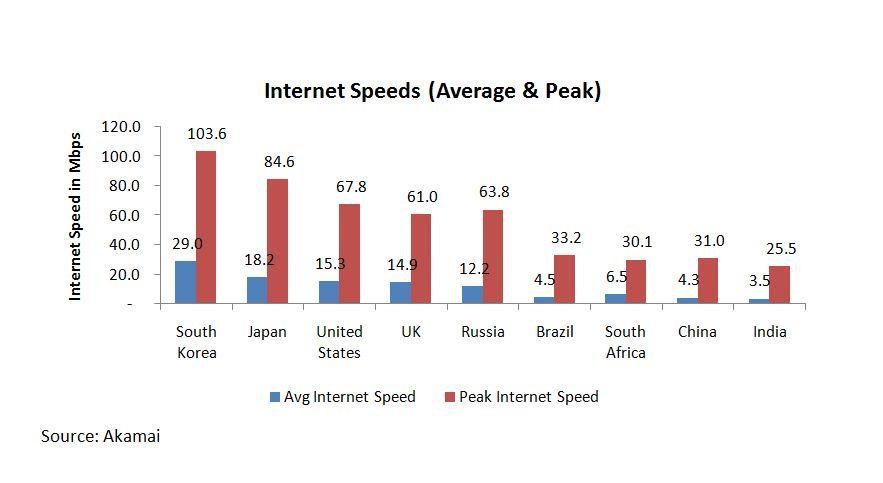
Moreover, the industry’s performance on key indicators such as network speed, coverage and customer service is not satisfactory. For example, average Internet speed in India stands at 3.5 Mbps compared to 29 Mbps in South Korea, 15 Mbps in the U.S., and 4.3 in China (see graph below).
In this context, it is worth analysing where telecom investments should be directed to make commercial 5G a reality in India by 2020.
Fiber to Drive 5G Rollouts
With a promise of 10Gbps speed, less than 1 ms latency and 90% reduction in network energy utilisation, 5G will spur the next round of telecom infrastructure investments across the globe, say experts. The growth of 5G will be fuelled by the sharp hike in consumer data and the proliferation of IoT devices.
ITU estimates the market for IoT devices will result in over USD 1.7 trillion in value added to the global economy by 2019. In view of these developments, ITU expects that investments on fibre infrastructure will surpass $ 144.2 billion during 2014 – 2019. The fact that 5G network will have to support bursty data from emerging applications like Video on Demand (VoD), IoT, Smart Cities, and the like also makes backhaul (from cell tower to network operators Point of Presence) a critical concern.
In several markets, operators are turning to fiber backhaul as an alternative to costly microwave technologies. Since fiber is essential for both wireline and wireless networks, investors show greater levels of confidence in fiber investment.
Fiber Investment: Where does India stand?
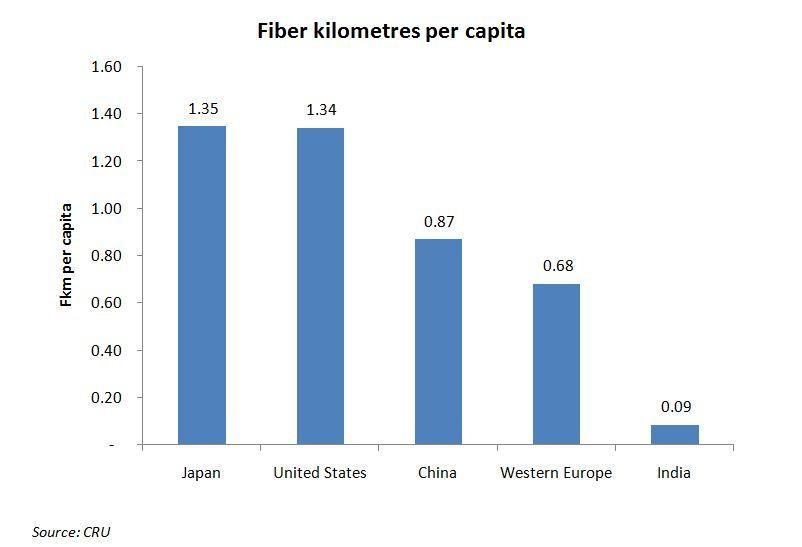
A comparison of optical fiber cable (OFC) rollout among the top performing telecom markets shows that the fiber kilometre (fkm) per capita is much less in India compared to several other key markets. For example, fkm per capita for China with 1.3 billion people is 0.87 whereas that of India with 1.2 billion people is just 0.09 (i.e. one-tenth of China consumption).
In developed markets such as the US and Japan, the score is 1.3 and higher (See graph below).
Preparing 5G Networks in India
The latest Cisco VNI report estimates that global IP traffic will grow at a compound annual growth rate (CAGR) of 23% from 2014 to 2019, and reach 2 zettabyte per year by 2019. Given this, operators across the world are upgrading their backhaul networks with fibre technology. The fact that fibre-based networks are capable of delivering unlimited bandwidth makes them a winning formula for telecom investments.
Leading operators are now mulling ways to reduce the capex associated with fibre deployments. Infrastructure sharing and leasing are gaining popularity among mobile and cable operators in developing markets. In India, the DoT’s amendment of unified license scheme for active infrastructure sharing and the revised public private partnership (PPP) model for BharatNet project adopted last year are two timely steps to boost the infrastructure sharing efforts by operators. Combined with this, a consensus on RoW is also expected soon across all Indian states. A unified RoW policy will pave way for smooth fibre rollout, resulting in faster service rendering.
To rise to the global standards and solidify their stand in the country, Indian operators need to pump in more funds in optical fibre and related technologies. With fibre playing a pivotal role in improving broadband connectivity and building robust 4G/5G backhaul capabilities, operators will find the investment worth of a grab. As penetration improves, they will be in a position to lower tariffs and identify new monetisation opportunities. ARPU will improve, and the market will stabilise gradually.
As the second largest telecom market in the world, India promises great potential for investors. Industry watchdogs believe India and China combined are capable of transforming world’s telecom landscape in the next decade. Recent developments reveal that Chinese operators and technology vendors have come a long way in 5G tests and trials. Now, it’s the turn of Indian operators to prove their readiness to 5G.
This is an exciting time for India, and the impact of 5G and its associated enablement of M2M, IoT, Autonomous driving and AR/VR can be anticipated. Given the 5G requirement for latency reduction (from 50ms to 1 ms) and speed from 100 Mbps to 10Gbps, the fibre deployment in the country will need to increase from current market of 16-18 million fkm per year to at least 2-3x per year. 5G will also require a multi-fold increase in small cells deployment, with each small cell having backhaul on fibre. The percentage of tower backhaul on fibre for the operators will need to increase significantly from 20% to 70-80% levels.
The current main drivers for the increase in deployment lie in the increased 4G deployments in Tier 1 and Tier 2 cities, increased Fibre-to-the-Home (FTTH) deployments by telecom operators, ISP’s and MSO providers. For example, ACT has recently launched 1Gbps broadband service in Hyderabad, which 20x faster than the market average of 50 Mbps. The other drivers for increase in fibre demand include the rural broadband project – BharatNet and large connectivity projects by the Defence. Lastly, optical fibre is a critical component to make the Smart Cities project a success.
Enabling early adoption of 5G, Sterlite Tech is working closely with key stakeholders – DOT, TRAI, telecom operators, equipment vendors and start-ups to enable 5G deployments in the country. Sterlite Tech is actively involved in 5G readiness solutions, and, is a key member of the Telecom Infra Project (TIP) led by Facebook, to completely transform telecom networks using SDN/NFV and make them 5G ready.
DISCLAIMER: The views expressed are solely of the author and ETTelecom.com does not necessarily subscribe to it. ETTelecom.com shall not be responsible for any damage caused to any person/organisation directly or indirectly.
China Telecom: IoT partnerships with 3 network operators; Huawei NB-IoT award from GSMA
China Telecom’s 3 New IoT Partnerships:
China Telecom has entered three new partnership agreements aimed at accelerating the development of services based on an Internet of Things (IoT) open platform.
The operator has announced an expanded partnership with HKT to cover the development of a common IoT open platform to serve the operators’ customers in the combined geographical footprints of mainland China and Hong Kong.
With the arrangement, each network operator’s customers will be able to deploy IoT and M2M services on the other’s network.
The joint offering will allow seamless switching of IoT subscription between networks by integrating the two commonly-deployed embedded universal integrated circuit card platforms. The multi-domestic service is supported by the Ericsson Device Connection Platform (DCP).
China Telecom also announced a similar strategic partnership with Norway-based Telenor Group. That partnership will allow customers from China Telecom and Telenor Connexion to deploy IoT and Machine-to-Machine (M2M) services in each other’s network. It enables China Telecom’s multi-national enterprise customers with outbound IoT business to deploy their assets and offerings under Telenor Connexion’s networks in the European and other Asian Markets.
Similarly, Telenor Connexion’s global customers can enjoy the benefits of the rapidly growing Chinese market by leveraging on China Telecom’s IoT network resources and business capabilities. The seamless switching of IoT subscription between networks is achieved by the integration of the two commonly deployed eUICC platforms which are the key component of IoT collaboration across borders.
To recap, China Telecom’s multi-national enterprise customers will gain access to Telenor Connexion’s IoT networks in Europe and Asian markets, and will serve as Telenor Connexion’s preferred partner for connectivity in China.
…………………………………………………………………………..
A separate agreement with Orange Business Services will enable both companies to serve their respective enterprise customers through a combined footprint across three continents – Asia, Europe and Africa.
The network operators have also agreed to collaborate on the development of new service models supporting global IoT opportunities and to explore the potential of enhancing existing IoT capabilities and applying emerging technologies such as mobile IoT.
GSMA functions to connect participants throughout the global mobile communications ecosystem, including almost 800 operators and over 300 enterprises. The association lays significant emphasis on addressing common concerns to best serve the interests of mobile operators worldwide. GSMA’s “Best IoT Innovation for Mobile Networks” award identifies and rewards Internet of Things (IoT) products, solutions, services, and new business models to highlight innovative breakthroughs based on new technological developments and standards of mobile networks.
Huawei’s NB-IoT solution comprises an NB-IoT terminal chipset, terminal operation system LiteOS, NB-IoT RAN and EPC, OceanConnect (a cloud platform for IoT management), and OpenLab that helps related enterprises develop IoT services and applications. The goal of the Huawei NB-IoT solution is to jointly build a better connected IoT solution and ecosystem with operators and partners from a diverse range of vertical industries. Huawei was the first to launch associated products after 3GPP released standards formulated for NB-IoT – one of multiple competing “standards” for Low Power WANs (LPWANs) targeted at the (non LAN) IoT market.
In 2016, Huawei began conducting NB-IoT trial applications in conjunction with mainstream network operators and partners. In early 2017, Huawei launched Boudica120, the world’s first commercial NB-IoT chip.
http://www.huawei.com/en/news/2017/6/GSMA-Best-IoT-Innovation-Mobile-Networks-Award
Highlights of IoT Developers Conference, April 26-27, 2017 in Santa Clara, CA
Windstream Joins ONAP & Open Source Telco Movement Led by AT&T/ China
Windstream Communications has become a corporate member of the Open Network Automation Platform (ONAP) Linux Foundation project, joining an open-source technology initiative for the first time.
ONAP was formed through the merger of open source ECOMP (contributed by AT&T) and Open Orchestrator Project (OPEN-O), two of the largest open source networking initiatives. It was the big hit of the 2017 Open Networking Summit as we reported in this blog post.
The ONAP Project is focused on creating a harmonized and comprehensive framework for real-time, policy-driven software automation of virtual network functions. ONAP includes participation by prominent networking suppliers and industry-leading service providers from around the world. It’s primary objective is to enable software, network, IT, and cloud providers and developers to rapidly create new services which can be monetized.
The ONAP draft architectural principles, presented at their May 2017 meeting at AT&T Bell Labs in NJ, can be read here.
……………………………………………………………………………………………….
“Combined with our rapid advances in SDN, Windstream’s participation in ONAP increases the value of our network for all of our customers, as we move to virtualization and cloud-based technologies that offer affordable and efficient next-generation services,” said Art Nichols, vice president of network architecture and technology for Windstream.
“For example, not only does our SDNow solution offer automation and accelerated service delivery, but it forges the path that will allow us to deliver flexible, on-demand services across our multi-vendor network ecosystem.”
“Traditionally, we have always worked with engineering groups and maybe a little bit with IT on the back side” in planning this kind of transition, Windstream’s Jeff Brown told Light Reading in an interview.
“In this new world, you are blending IT and engineering and a lot of crossover resources. So, from the IT perspective, [ONAP] was called out as a group that was taking the leadership role as far as developing open standard work with other companies we have similarities with and with some of our vendors as well.”
Windstream has been informally monitoring multiple open source efforts and supporting the concept of open source for some time now, Brown told Light Reading. The move to more actively engage in orchestration through ONAP was driven by the growing influence of Windstream’s IT department in its transition to software-defined networking, he added.
“In any type of industry forum, whether standards-based or not, you have to make the determination of what kind of resources you can dedicate to it,” Brown notes. Having just come out of meetings around MEF and proofs-of-concept for its 2017 event, he says the same discussions come up there. “We don’t have groups allocated that can do that type of thing and work with vendors,” he says.
https://wiki.onap.org/display/DW/Draft+Architecture+Principles
http://about.att.com/innovationblog/onap
Open Network Summit: ONAP Steals the Show with Broad Support
AT&T to Test “5G” via DIRECTV Now in Austin, TX
In the continuing saga of pre-standard “5G” trials, AT&T has begun field trials of its “5G” based fixed wireless system in Austin, TX using its DIRECTV Now streaming-video service. That’s the mega telco’s second commercial trial of gigabit millimeter-wave spectrum technology. Its first “5G” millimeter-wave trial in 2016 was also in Austin.
Earlier this year, AT&T and Nokia combined on a lab test of 5G fixed-wireless streaming of DirecTV Now over a 39-GHz system that was conducted at the AT&T Labs facility in Middletown, NJ.
………………………………………………………………………………………
AT&T is using Ericsson’s “5G” RAN and Intel’s “5G” Mobile Trial Platform and says it plans to incorporate software-defined networks in other “5G” efforts this year.
AT&T said it expects the trial in Austin will deliver speeds up to 1 Gbps using mmWave spectrum.
The latest Austin trial represents a “major step on our journey to deliver state-of-the-art 5G wireless speeds as early as late 2018,” according to an AT&T press release, which also stated:
“We expect 5G to take people and businesses places they’ve never been with all new experiences thanks to the advantages of enhanced mobile broadband, critical IoT solutions and low latency applications.
Lower latency will play a powerful role in the connected experience. It impacts things like the time between clicking a web link and seeing a webpage begin to load on your device. Through this trial, participants will be able to see the real-life, daily benefits that fixed wireless 5G offers them directly or to their customers.”
…………………………………………………………………………………………
“The technology behind 5G is important. But it’s also about advancing social trends like mobile video streaming,” said Marachel Knight, AT&T senior vice president, wireless network architecture and design.
“In Austin, we’re testing DirecTV NOW over ultra-fast internet speeds at a variety of locations,” Knight said. “The network of the future will help redefine what connectivity means to both consumers and businesses. This trial helps show that the new reality is coming fast.”
http://www.multichannel.com/news/content/att-kicks-5g-powered-directv-now-trial/413707
Deloitte: $150B U.S. Fiber Infrastructure Investment for 5G
The U.S. needs $130 billion to $150 billion in fiber network expansion to be fully ready for 5G-based networks and to ensure that the digital economy’s benefits reach all Americans, according to a Deloitte report.
The suggested $130 billion to $150 billion fiber infrastructure investment is required in the U.S. to unleash innovation, close the digital divide, and fully prepare the country for 5G, according to a report from management consulting firm Deloitte. The report says the investment is needed over the next five to seven years to enable ‘deep fiber,’ or fiber infrastructure closer to the end user.
Much of the premise behind the report focuses on 5G, which requires a dense fiber network for backhaul and fronthaul. But it also stresses the discrepancy between rural and urban broadband options. Deloitte is calling on regulators and the broadband carrier community to address this issue, or risk losing leadership for the global digital economy opportunity.
Key Points:
– Future of connectivity remains uncertain in the U.S.; investment needed to ensure U.S. is 5G ready
– Vast discrepancies in choice, affordability and performance exist between rural, underserved and urban geographies
– Deep fiber paramount to unleashing wireless innovation, internet of things (IoT) functionality and immersive entertainment.
…………………………………………………………………………………………..
“Network infrastructure is among the key factors in a nation’s economic growth potential and status as an innovator, and ultimately in propelling our economy’s gross domestic product and job growth,” said Craig Wigginton, vice chairman and telecommunications sector leader, Deloitte & Touche LLP in a press release announcing the report.
“We see a 5G ready U.S. infrastructure as critical to enabling a range of other adjacent industries to compete globally and safeguard our digital economy.”
The report says the U.S. currently lacks the fiber infrastructure necessary to take advantage of 5G. Many tier one carriers, including Verizon, have expressed their plans to ramp up fiber investments. Deloitte seems to suggest it’s not enough.
The report notes that FTTP reaches less than one-third of U.S. homes, with only 39% of U.S. consumers having access to more than one provider who offers a 25 Mbps speed tier or higher. The situation is worse in rural communities, where 10 million rural homes do not have broadband of at least 25 Mbps. The FCC definition for broadband includes a minimum speed of 25 Mbps. Well sort of. It depends on where you live and whether your carrier receives Connect America Fund (CAF) support.
“It is essential that fiber gets deployed closer to the customer to enable next generation wireless and to ensure affordable high speed connectivity across urban, suburban and rural geographies,” said Dan Littmann, principal, Deloitte Consulting LLP in the press release.
The report calls for $35B to $40B for rural fiber infrastructure and $60B to $100B for what Deloitte calls ‘broadband competition.’ I assume broadband competition means enabling multiple broadband providers who offer speeds of 25 Mbps or more.
Deloitte suggests carriers consider “shared infrastructure” models, a play on open access perhaps. IoT presents integration and security opportunities, that Deloitte says carriers need to get better at exploiting. They also suggest, carriers partner with OTT players, inviting them to fund and own their own fiber optic networks. This author believes that’s highly unlikely!
The report suggests that IP migration and regulatory reforms, while important, will not be enough to create the case for fiber deployment. Wireless, wireline and cable require creative new ways to monetize “last mile” access as an incentive for massive fiber deployment. The report contemplates three potential models:
- Synergies between deep fiber and adjacent services in an “unlimited” world: Gartner predicts that affluent households will have up to 500 connected devices by 2022. In some cases, IoT services offer the prospect of new revenue. However, most connected devices will require low bandwidth or be WiFi enabled and, therefore, may not provide carriers with incremental revenue. In such cases, carriers have an opportunity to increase revenue by offering integration, network security, and traffic management services within the increasingly complex mix of IoT devices and ecosystems.
- Partnership between carriers and OTT players to fund deep fiber: As limited fiber availability constrains increased wireless densification and fiber broadband, over the top players may choose to fund fiber deployment, including owning assets or forming partnerships with carriers.
- Deep fiber as a financial investment: Insufficient supply of deep fiber and overwhelming demand growth are strong fundamentals for fiber investment. As interest grows from nontraditional fiber investors, we expect shared infrastructure models to emerge for last mile fiber access. Fiber as leased real estate could allow carriers to maximize asset utilization.

Communications Infrastructure Upgrade – The Need for Deep Fiber (Source: PRNewsfoto/Deloitte)
………………………………………………………………………………….
For regulators, Deloitte offers these suggestions, which on the surface are pretty light on the details:
- Eliminating regulatory barriers that prevent carriers from operating a single IP network, impede deployment of additional fiber assets, or restrict the types of services that may be offered.
- Avoiding regulation that limits carrier innovation in creating new monetization mechanisms.
- Reforming the Universal Services Administrative Company internal operations to meet broader goals of expanding fiber infrastructure and addressing rural internet access to close the digital divide.
References:
http://www.prnewswire.com/news-releases/deloitte-us-investment-of-130b-to-150b-in-deep-fiber-infrastructure-required-to-lead-global-digital-economy-opportunity-300480135.html
Timeline for IMT 2020 (5G) Radio Access Recommendations + Evaluation Methodology
Introduction:
This article was written based on the ITU-R WP5D Niagara Falls, Canada meeting that concluded last week. We attempt to present the true picture for standardizing IMT 2020 (5G) Radio Interface Technologies (RITs – aka Radio Access Networks or Radio Access Interfaces).
We don’t mention 3GPP release 15 (“5G” features over a LTE network) or 16 (pure 5G- no LTE) which will provide different levels of “5G” support. Those specs might be submitted to ITU-R WP 5D for their consideration, based on the IMT 2020 RIT Evaluation methodology described in item 2. below.
Global carriers that have announced 5G specs and trials will likely have to do a major upgrade to their “5G” base stations to support the ITU-R IMT 2020 RIT specifications to be completed at the end of 2020 as per item 1. below. It’s a mystery (to me and other IEEE members on the ComSocSCV email discussion group) as to what companies will provide the pre-standard “5G” handsets and other mobile/fixed end point devices that will have to be upgraded or replaced completely when standardized 5G is finalized in late 2020.
Note: SK Telecom said that’s not a problem as mobile device refresh/replace time is 18 months, so pre-standard 5G handsets will be obsolete when standardized 5G is finally deployed.
1. Development of IMT 2020 (5G) radio access recommendation(s) by ITU-R WP 5D
Critical milestones in IMT 2020 radio interface development process:
(0): Issue an invitation to propose Radio Interface Technologies (RITs) -March 2016
(1): ITU proposed cut off for submission – July 2019
(2): Cut off for evaluation report to ITU – February 2020
(3): WP 5D decides framework and key characteristics of IMT-2020 RIT and SRIT -June 2020
(4): WP 5D completes development of radio interface specification recommendations- October 2020
Terminology:
RIT= Radio Interface Technologies
SRIT= Set of Radio Interface technologies, each meeting the evaluation criteria
…………………………………………………………………………………………………………………………………….
2. Key Sections of Evaluation of IMT 2020 Radio Interfaces (from new ITU-R WP5D draft report):
Scope:
This Report provides guidelines for the procedure, methodology and the criteria (technical, spectrum and service) to be used in evaluating the candidate IMT-2020 radio interface technologies (RITs) or Set of RITs (SRITs) for a number of test environments. These test environments are chosen to simulate closely the more stringent radio operating environments. The evaluation procedure is designed in such a way that the overall performance of the candidate RITs/SRITs may be fairly and equally assessed on a technical basis. It ensures that the overall IMT‑2020 objectives are met.
This Report provides, for proponents, developers of candidate RITs/SRITs and independent evaluation groups, the common evaluation methodology and evaluation configurations to evaluate the candidate RITs/SRITs and system aspects impacting the radio performance. This Report allows a degree of freedom so as to encompass new technologies. The actual selection of the candidate RITs/SRITs for IMT-2020 is outside the scope of this Report.
The candidate RITs/SRITs will be assessed based on those evaluation guidelines. If necessary, additional evaluation methodologies may be developed by each independent evaluation group to complement the evaluation guidelines. Any such additional methodology should be shared between independent evaluation groups and sent to the Radiocommunication Bureau as information in the consideration of the evaluation results by ITU-R and for posting under additional information relevant to the independent evaluation group section of the ITU-R IMT-2020 web page (http://www.itu.int/en/ITU-R/study-groups/rsg5/rwp5d/imt-2020/Pages/submission-eval.aspx)
Evaluation guidelines:
IMT-2020 can be considered from multiple perspectives: users, manufacturers, application developers, network operators, service and content providers, and, finally, the usage scenarios – which are extensive. Therefore candidate RITs/SRITs for IMT-2020 must be capable of being applied in a much broader variety of usage scenarios and supporting a much broader range of environments, significantly more diverse service capabilities as well as technology options. Consideration of every variation to encompass all situations is, however, not possible; nonetheless the work of the ITU-R has been to determine a representative view of IMT‑2020 consistent with the process defined in Resolution ITU-R 65, Principles for the process of future development of IMT‑2020 and beyond, and the key technical performance requirements defined in Report ITU-R M.[IMT-2020.TECH PERF REQ] – Minimum requirements related to technical performance for IMT-2020 radio interface(s).
The parameters presented in this Report are for the purpose of consistent definition, specification, and evaluation of the candidate RITs/SRITs for IMT-2020 in ITU-R in conjunction with the development of Recommendations and Reports such as the framework and key characteristics and the detailed specifications of IMT-2020. These parameters have been chosen to be representative of a global view of IMT-2020 but are not intended to be specific to any particular implementation of an IMT-2020 technology. They should not be considered as the values that must be used in any deployment of any IMT-2020 system nor should they be taken as the default values for any other or subsequent study in ITU or elsewhere.Further consideration has been given in the choice of parameters to balancing the assessment of the technology with the complexity of the simulations while respecting the workload of an evaluator or technology proponent.
This procedure deals only with evaluating radio interface aspects. It is not intended for evaluating system aspects (including those for satellit system aspects).
The following principles are to be followed when evaluating radio interface technologies for IMT‑2020:
− Evaluations of proposals can be through simulation, analytical and inspection procedures.
− The evaluation shall be performed based on the submitted technology proposals, and should follow the evaluation guidelines, using the evaluation methodology and the evaluation configurations defined in this Report.
− Evaluations through simulations contain both system-level and link-level simulations. Independent evaluation groups may use their own simulation tools for the evaluation.
− In case of evaluation through analysis, the evaluation is to be based on calculations which use the technical information provided by the proponent.
− In case of evaluation through inspection the evaluation is to be based on statements in the proposal.
The following options are foreseen for proponents and independent external evaluation groups doing the evaluations:
− Self-evaluation must be a complete evaluation (to provide a fully complete compliance template) of the technology proposal.
− An external evaluation group may perform complete or partial evaluation of one or several technology proposals to assess the compliance of the technologies with the minimum requirements of IMT-2020.
− Evaluations covering several technology proposals are encouraged.
6. Overview of characteristics for evaluation
The characteristics chosen for evaluation are explained in detail in Report ITU-R M.[IMT‑2020.SUBMISSION −Requirements, evaluation criteria and submission templates for the development of IMT‑2020], § 3, including service aspect requirements, spectrum aspect requirements, and technical performance requirements , the last of which are based on Report ITU‑R M.[IMT-2020.TECH PERF REQ]. These are summarized in Table 6-1, together with their high level assessment method:
− Simulation (including system-level and link-level simulations, according to the principles of the simulation procedure given in § 7.1).
− Analytical (via calculation or mathematical analysis).
Inspection (by reviewing the functionality and parameterization of the proposal).
…………………………………………………………………………………………………………………………………….
Summary of evaluation methodologies:
- Characteristic for evaluation
- High-level assessment method
- Evaluation methodology in this report
Related IMT-2020 Reports:
ITU-R M.[IMT-2020.TECH PERF REQ] and ITU-R M.[IMT‑2020.SUBMISSION]
7. Evaluation methodology
The submission and evaluation process is defined in Document IMT-2020/2 − Submission, evaluation process and consensus building for IMT-2020.
Evaluation should be performed in compliance with the technical parameters provided by the proponents and the evaluation configurations specified for the test environments in § 8.2 of this Report. Each requirement should be evaluated independently, except for the average spectral efficiency and 5th percentile user spectral efficiency – both of which criteria shall be assessed jointly using the same simulation; consequently, the candidate RITs/SRITs shall fulfil the corresponding minimum requirements jointly.
Furthermore, the evaluation parameters used for the system-level simulation used in the mobility evaluation should be the same as the parameters used for system-level simulation for average spectral efficiency and 5th percentile user spectral efficiency.
The evaluation methodology should include the following elements:
1 Candidate RITs/SRITs should be evaluated using reproducible methods including computer simulation, analytical approaches and inspection of the proposal.
2 Technical evaluation of the candidate RITs/SRITs should be made against each evaluation criterion for the required test environments.
3 Candidate RITs/SRITs should be evaluated based on technical descriptions that are submitted using a technologies description template
In order for the ITU to be in a position to assess the evaluation results of each candidate RIT/SRIT, the following points should be taken into account:
− Use of unified methodology, software, and data sets by the evaluation groups wherever possible, e.g. in the area of channel modelling, link-level simulation, and link-to-system-level interface.
− Evaluation of multiple proposals using a single simulation tool by each evaluation group.
Evaluations of average spectral efficiency, 5th percentile user spectral efficiency, peak spectral efficiency, user experienced data rate, area traffic capacity, peak data rate, mobility, reliability, and connection density of candidate RITs/SRITs should take into account the Layer 1 and Layer 2 overhead information provided by the proponents.
……………………………………………………………………………………………………………
