

FCC maps
MoffettNathanson: 87.4% of available U.S. homes have broadband; Leichtman Research: 90% of U.S. homes have internet
When the FCC announced the November 18th release date for their long-awaited broadband mapping update, reflecting location-specific broadband availability as of June 2022, analysts at MoffettNathanson thought it would contain information on how many of U.S. homes have access to broadband and how many are too rural and are therefore unserved. However, that FCC release didn’t offer the numbers they needed, and the market research fim didn’t
have the necessary information to calculate it themselves.
In the underlying FCC datasets, which are provided for public download, each location served by a given technology or provider is a separate entry. One location is equivalent to one street address. But many street addresses in the U.S. correspond to multiple living units, and the number of units per location is not publicly available (the location fabric used by the FCC was contracted to a third party, CostQuest Associates, and that fabric is provided only to the FCC, broadband providers, state/local government entities, and select other interested parties). With approximately 31% of residences in multifamily homes, according to a 2019 survey by the Census Bureau, the number of units per location was, as of the November 18th release, a crucial missing piece for any meaningful coverage analysis we could do on our own.
Principal Analyst Craig Moffett wrote:
The FCC’s new maps of broadband availability can tell us coverage for residential locations or business locations, but not the combined total. The companies we cover sometimes break out residential and commercial, but not always. [As an aside, about half of small businesses in the U.S. are actually operated out of peoples’ homes, but hopefully this, at least, doesn’t introduce further distortion, since we are presumably still seeing just one subscription for one location]. So we’ll do our best to make sure we’re matching numerator and denominator by specifying whether we’re looking at all locations or residential locations only.
The FCC’s coverage data also doesn’t distinguish between occupied and vacant units. For our calculation of penetration, we’d want to exclude most vacant units, since vacant units don’t need broadband. Excluding all vacant units likely understates the denominator, though; for example, some second homes (which are treated as vacant) may have year-round broadband subscriptions. The best we can do is assume the coverage of total units is the same as the coverage of occupied units, and that vacant units with broadband subscriptions are negligible.
The FCC does report service coverage for satellite and fixed wireless. But some of those FWA subscribers are in areas where there’s no access to wired broadband, while others are in areas where wired broadband is available. Naturally, the companies won’t tell us how many of each there are. So we’ll just have to leave them all out. We’ll focus just on the availability of wired broadband.
Editor’s Note: The FCC broadband map for my address show a Licensed Fixed Wireless operator serves my condo. It’s California Internet with symmetrical 1G upstream/1G downstream. Also, there are two Satellite providers – Hughes Network Systems, LLC 25M/3M and Space X 350M/40M. Wired internet is available from AT&T and Comcast.
We’d really want to know how many DSL subscribers are in each of those different cohorts. But the
companies we cover don’t report how many of their DSL subscribers are in areas where there is
also a cable or fiber operator, and how many are in areas where DSL is the only option. The first
group is at risk. The second group is not. So, we’ll just have to include all DSL.
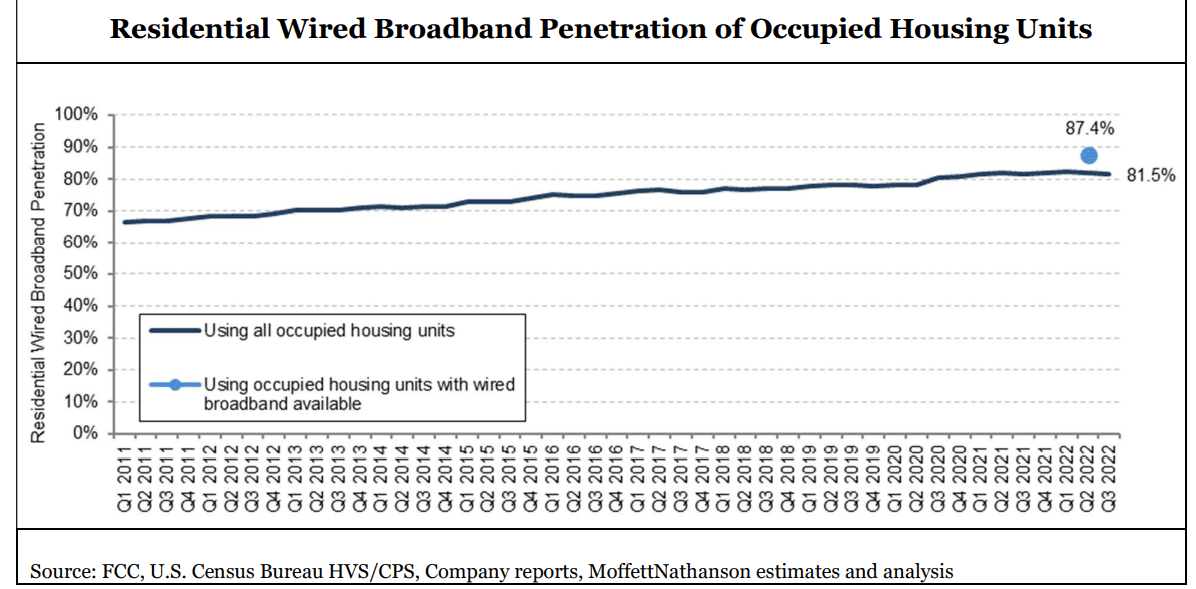
According to the FCC’s current estimates, wired broadband (defined as anything over 200 kbps downstream and 200 kbps upstream) was available to 93.7% of residential units in America as of June 30, 2022. Again, we don’t know the percentage of occupied housing units with wired broadband available, but let’s assume it’s the same. And we don’t know the number of residential units in the location fabric, so we’ll use the Census Bureau’s estimate of 128.1M occupied housing units in the U.S. Given these assumptions, we estimate wired broadband was available to around 120.0M occupied housing units as of June 30, 2022. With, by our count, an estimated 104.9M residential wired broadband subscriptions in America in Q2 2022 – again, including DSL, and sometimes including commercial as well as residential subscribers – that translates into penetration of 87.4% of broadband-available homes. We estimate that 81.5% of all households subscribe to wired broadband.
Craig’s Conclusions:
The goal for the FCC is to create maps that are not frozen in time but instead become living and breathing reflections of a dynamic marketplace. The new maps are subject to a public challenge process, enabling interested parties, including operators, local governments, and even individual would-be subscribers, to dispute reported availability. Challenges will eventually be part of a routine updating process. Indeed, the maps released in November were the product of what had already been a months-long initial challenge process. The maps are, again, a critical input to distribution of $42.5 billion of funds earmarked for rural broadband by the JOBS/Infrastructure Act. The National Telecommunications and Information Administration (NTIA) is required by law to use the FCC’s new map to distribute those funds in what is referred to as the Broadband Equity, Access, and Deployment (BEAD) Program, something they have committed to do by June 2023. They are likely to begin that process almost immediately, based on the number of unserved locations in each state, although NTIA chief Alan Davidson has said they will wait for the FCC to release the second version of its coverage map, later this year, before they actually begin to disburse those funds.
The network operators themselves, including the cable operators in particular, will in our view be major participants in the BEAD process, bidding aggressively to bring broadband to unserved census blocks on the periphery of their current franchise areas.
…………………………………………………………………………………………………………………………………………………………………………….
Meanwhile, Leichtman Research Group indicates that 90 per cent of U.S. households get an Internet service at home, compared to 84 per cent in 2017, and 74 per cent in 2007. Broadband accounts for 99 per cent of households with an Internet service at home, and 89 per cent of all households get a broadband Internet service – an increase from 82 per cent in 2017, and 53 per cent in 2007.
These findings are based on a survey of 1,910 households from throughout the United States and are part of a new LRG study, Broadband Internet in the U.S. 2022. This is LRG’s twentieth annual study on this topic.
Other related findings include:
- Individuals ages 65+ account for 34% of those that do not get an Internet service at home
- 56% of broadband subscribers are very satisfied (8-10 on a 1-10 scale) with their Internet service at home, while 6% are not satisfied (1-3).
- 44% of broadband subscribers do not know the download speed of their service – compared to 60% in 2017
- 61% reporting Internet speeds of >100 Mbps are very satisfied with their service, compared to 41% with speeds <50 Mbps, and 57% that do not know their speed
- 40% of broadband households get a bundle of services from a single provider – compared to 64% in 2017, and 78% in 2012
- 59% of adults with an Internet service at home watch video online daily – compared to 59% in 2020, 43% in 2017, and 17% in 2012
“The percentage of households getting an Internet service at home, including high-speed broadband, is higher than in any previous year,” said Bruce Leichtman, president and principal analyst for Leichtman Research Group, Inc. “Computer usage and knowledge remain the foundation for Internet services in the home. Among those that do not get an Internet service at home, 58% also do not use a computer at home..”
References:
https://broadbandmap.fcc.gov/home
https://www.leichtmanresearch.com/90-of-u-s-households-get-an-internet-service-at-home/
