

Broadband Access Subscriber Growth
Highlights of 2025 Broadband Nation Expo: Comcast, T-Mobile keynotes + selected quotes
Over 100 ISPs from across the U.S., vendors in the broadband ecosystem, organizations and more gathered in Orlando, FL November 17-19th for the TIA’s annual Broadband Nation Expo, to talk about the challenges of delivering broadband today. Keynote speakers discussed topics including Comcast’s 10G network technologies and AI, T-Mobile’s fixed wireless access strategy, AT&T’s fiber expansion, and Google’s use of AI in data center innovation.

- Future-proofing the network: Strategies for evolving existing broadband infrastructure to meet increasing demands from emerging technologies like AI, advanced streaming, and more.
- 10G technology and multigigabit speeds: Nafshi discussed progress and plans for delivering multigigabit upload and download speeds to millions of Americans using this standard.
- Network resilience: Insights into how Comcast is building a more resilient network to keep communities connected, particularly in the face of severe weather events.
- Innovation and strategy: Leading with purpose and innovation in the era of the Broadband Equity, Access, and Deployment (BEAD) program.
- Core-to-edge intelligence: The integration of artificial intelligence and a robust fiber backbone to create a smarter, faster, and more reliable connectivity experience for customers.
Comcast is using artificial intelligence (AI) to create a “smarter,” self-healing 10G network, emphasizing distributed AI at the network edge to improve customer experience and network reliability. He noted that investments in 10G technologies like DOCSIS 4.0 and next-generation amplifiers are aimed at future-proofing the network for anticipated data usage growth. In particular. Comcast applies AI at various levels of its 10G network for automation, self-healing, performance optimization, and cybersecurity. This approach is designed to create a “smarter” and more resilient network, with a focus on real-time, distributed intelligence at the network’s edge.
- Predictive maintenance: Using AI and machine learning (ML), the network can analyze performance data to identify issues before they impact customers, reducing the time needed for repairs. The network also automatically detects when a customer’s modem is offline and analyzes the data to determine the cause of the outage.
- Capacity scaling: The Octave platform uses AI to automatically increase network capacity in areas experiencing unexpected spikes in data traffic, such as during live-streamed events.
- Traffic rerouting: AI agents can perform large-scale tasks like automatically rerouting data traffic around fiber cuts to prevent service interruptions.
- Automated deployment: With its AI and ML capabilities, Comcast automates over 99.7% of all software changes on the network, which also helps prevent human-caused errors.
- In-home WiFi optimization: Every hour, AI analyzes thousands of data points from millions of network devices to enhance in-home WiFi performance. The xFi platform also uses AI to dynamically optimize home WiFi based on user behavior and signal interference.
- Outage restoration: AI helps accelerate recovery efforts during extreme weather by detecting mass outages faster, pinpointing the cause, and identifying where technicians are needed most.
- Threat mitigation: AI agents are being trialed to identify cyber threats and take proactive measures to mitigate them, providing end-to-end cybersecurity protection.
- Optimized power usage: AI agents can also optimize power usage in the network based on spikes and lulls in data consumption.
……………………………………………………………………………………………………………………………………………………………………………………………………………..
II. T-Mobile Chief Broadband Officer Allan Samson said the “uncarrier” has gained sizable 5G FWA market share in urban markets (it’s offered in Santa Clara, CA- hometown of this author). 70% of T-Mobile’s FWA activations come from the “top 100” U.S. cities and approximately 65% of fixed wireless sales per quarter happen in suburban and urban markets.
Samson said improved quality of service is one reason more people in urban areas are drawn to FWA, touting T-Mobile’s average FWA download speed sits at 239 Mbps and latency has decreased to about 34 milliseconds. T-Mobile has now converted every fixed wireless customer to a standalone 5G core network (specified by 3GPP). “From a technology perspective, this so-called cell phone quality internet has not only made a lot of progress but has so much more room to run in terms of the innovation,” Samson added.
He admitted T-Mobile’s lack of expertise in fiber optic networks: “Our approach is real simple. We don’t build wireline networks, you’ve got to know what you’re not good at,” he said. Hence T-Mobile’s decision to acquire both Lumos and Metronet. Samson said T-Mobile expects to close 2025 with “well north of 3 million homes passed” and “hopefully about 900,000 to a million customers.”
Selected Quotes:
Dr. Dong Hao, market technology development manager, Optical Communications at Corning, told a breakfast session about Meta’s 1 million GPU data center campus in Louisiana. “It’s so gigantic that it’s going to consume 8 million miles of optical fiber in that data center, alone,” he said. “How do you manufacture that? We are dealing with the capacity crunch. It’s a high-priority issue.”
In the age of AI….Robin Olds, senior business development manager, Broadband Program Office, Americas Service Provider, from Cisco, said that service providers are getting more comfortable with AI in the network, given rising costs. “Trusting the networks to make changes on the fly – that is a really hard thing for humans to do, but providers are starting to look at that to save time and money.”
“It’s about getting smarter networks, not just faster networks,” said Jeff Brown, senior director, Segment Marketing, Calix, said during a panel on access technologies.
Mike Lubin, senior advisor and VP at ViaSat thinks LEO satellite transport will emerge as FWA backhaul “in the interim” until fiber or another optical communications technology comes along. Some combination of satellite and FWA is “going to be the paradigm” for connecting about 2.6 billion unconnected folks globally.
…………………………………………………………………………………………………………………………………………………………………………………………………………………….
Point Topic: Global Broadband Subscribers in Q2 2025: 5G FWA, DSL, satellite and FTTP
U.S. BEAD overhaul to benefit Starlink/SpaceX at the expense of fiber broadband providers
Broadband Forum new work areas to enable broadband services & apps
UK’s CityFibre launches 5.5Gbit/s wholesale broadband service- 3 times faster than BT Openreach
Google Fiber and Nokia demo network slicing for home broadband in GFiber Labs
Point Topic: Global Broadband Subscribers in Q2 2025: 5G FWA, DSL, satellite and FTTP
Overview:
Global broadband subscribers surpassed 1.53 billion in Q2 2025, marking a 1.1% growth. Broadband subscriptions[1] declined in 24 countries[2], compared to 22 in Q1 2025. In some of these markets consumers are migrating to mobile broadband, others are experiencing economic headwinds or are already highly saturated. Some are still in the midst of conflict. Globally, the growth in Q2 2025 has increased slightly, compared to the same quarter of 2024.
Notes:
[1] Whenever Point Topic refers to ‘broadband’ in this report, they mean fixed broadband. Also, ‘subscriptions’ and ‘connections’ are used interchangeably.
[2] It is possible there will be restatements in the coming quarter/s and single period data should be viewed in that light. Decline in some markets can be due to changes in methodology used by national regulatory authorities.
Key Points:
-
In terms of growth, India remained at the top of the largest 20 fixed broadband markets with a 6.7% quarterly growth rate.
-
The share of FTTH/B in the total fixed broadband subscriptions increased further and stood at 72.68%. Broadband connections based on other technologies saw their market shares shrink again, with an exception of satellite and fixed wireless access (FWA).
-
Year-on-year, FTTH/B connections grew by 7.2%. Satellite and FWA saw an even higher annual growth (41.6% and 31% respectively).
-
Legacy copper subscriptions declined by 12.1% y-o-y, while FTTx lines (mainly VDSL) went down by 6%, with Spain becoming one of the first countries in the world and the first major European economy to shut down its copper network completely.
-
5G FWA take-up accelerated, especially in India and the US, as a result of aggressive investments by Reliance, Bharti Airtel, T-Mobile, Verizon and AT&T.

In Q2 2025, the global fixed broadband subscriber figure grew by 1.1%, exceeding 1.53 billion. In line with seasonal trends, the growth rate was slower than in the previous quarter but it was slightly higher than in the respective quarter of 2024 (Figure 1. above and Table 1. below).
Table 1. Global broadband subscribers and quarterly growth rates. Source – Point Topic

South and East Asia continues to claim the largest share of net adds in global fixed broadband subscribers, though it dropped slightly quarter-on-quarter from 63.5% to 62.3%. This was largely due to the slower quarterly growth in China, the largest broadband market of the region[3], which is inevitable due to the increasing market saturation (Table 2. below).
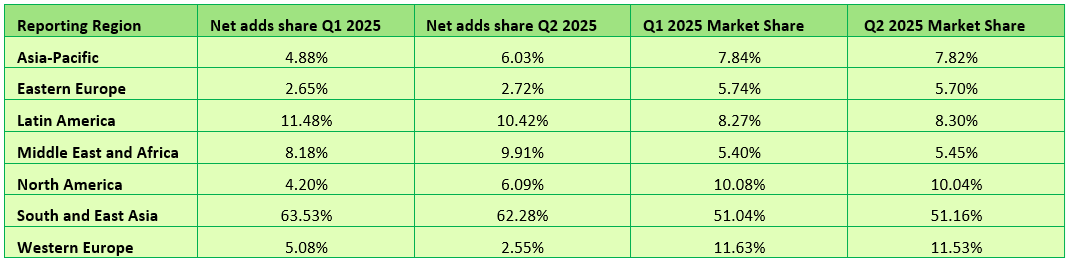
Other regions saw their net adds shares expand, with an exception of Latin America and Western Europe. In Western Europe, whose net adds share halved, most of the Scandinavian countries, the UK and some others saw a decline in fixed broadband subscribers, as the extent of migration to gigabit capable technologies was not sufficient to offset the decline in copper based subscriptions.
For the largest twenty broadband markets, once again all except the UK saw fixed broadband subscriber growth in Q2 2025 (Figure 5). The UK saw a -0.05% decline (compared to -0.3% in the previous quarter), as the FTTP growth was not sufficient to offset the decline in DSL, FTTx and cable broadband connections. For several quarters now India is at the top of this cohort, with a 6.7% growth, continuing to show huge growth potential due to the low fixed broadband penetration (16% of households) and the fast growing economy. Along with Canada, India also saw the largest increase in quarterly growth, compared to Q1 2025.

Globally, healthy quarterly FTTH/B growth rates were spread around the world, with the less advanced economies and more youthful fibre markets generally exhibiting higher growth. In the last 12 months to the end of Q2 2025, the number of DSL lines saw another decline (-12.1%), while FTTH/B connections grew by 7.2%. The decline in FTTx was -6%, while cable (HFC) broadband subscribers dropped by -0.9%.
The decline in copper and FTTx (mainly VDSL) is not surprising. When it comes to cable/HFC, it is not immune to competition from other technologies either. The US is a good example, being the largest cable market globally. There the decline has continued as major players such as Comcast, Charter, Cox, Altice and others are losing customers. Competition from telcos who are rapidly expanding their fibre footprints (AT&T, Verizon, Frontier, Lumen, Consolidated Communications) and offering symmetric bandwidth, superior upload speeds and lower latency is partly to blame. At the same time, cable broadband prices have risen steadily due to promotional offer expirations, ‘network fees’, and equipment costs. Finally, 5G FWA home broadband from T-Mobile, Verizon and AT&T has exploded, with their customer numbers jumping year-on-year by 31%, 34% and 194% respectively.
Globally, wireless broadband (FWA, 5G FWA and LTE fixed) connections also continued to grow – they went up by 31% year-on-year, largely impacted by an explosive growth of 5G FWA in India (332% year-on-year) as well as the US (39%). In India, Reliance and Bharti Airtel are marching ahead with 5G FWA rollouts, capitalising on the huge potential of the enormous broadband hungry market.
Point Topic expects this trend to continue due to the fact that FWA networks are easier to scale after the initial investment, FWA broadband services being generally cheaper for consumers than the alternatives, easy to self-install, and being ‘good enough’ for streaming, remote work, and average household use, as well as the demand for connectivity in remote and underserved areas. Having said that, this applies primarily to the more advanced FWA, especially 5G based. They are also seeing a decline in subscriptions based on older FWA variants in some markets.
Point Topic: FTTP broadband subs to reach 1.12bn by 2030 in 29 largest markets
U.S. broadband subscriber growth slowed in 1Q-2024 after net adds in 2023
Point Topic Comprehensive Report: Global Fixed Broadband Connections at 1.377B as of Q1-2023
Point Topic: Global Broadband Tariff Benchmark Report- 2Q-2022
Point Topic: Global fixed broadband connections up 1.7% in 1Q-2022, FTTH at 58% market share
Cable broadband subscriber growth slows while FTTx and FWA gain ground
U.S. Home Internet prices DECLINE amidst fierce competition between wireless carriers and cablecos
Home internet prices in the U.S. are being driven down by fierce competition between mobile carriers offering Fixed Wireless Access (FWA) and cable internet companies offering legacy Hybrid Fiber Coax connections. The increased competition has driven down the cost of home internet service, a welcome break for consumers when prices are rising for many other essential products. The price of home internet service fell 3.1% in May from a year earlier, while the overall consumer-price index rose 2.4%, according to the Labor Department.
The WSJ reports that major home-internet service providers including Verizon VZ, Comcast/Xfinity and T-Mobile launched a flurry of price-lock guarantees, promising steady rates for as long as five years. CableCos Charter, which is acquiring Cox, unveiled a three-year deal last year.
Cable companies have struggled to retain broadband internet subscribers since mobile carriers began offering more affordable 5G fixed-wireless access (FWA) internet service in 2018. FWA, which relies on over the air transmission to cell towers instead of HFC access, brought competition into markets where cable companies had long enjoyed being the only game in town. Now both types of providers are growing more aggressive to attract—and keep—customers.
“The cable companies went from gaining subscribers and raising rates every year to declining subscribers and giving people price locks,” said John Hodulik, a UBS analyst. “They’re seeing churn rise in their broadband subscriber base. And they’re trying to nip that in the bud.” Fixed wireless can sometimes cost half as much as a cable-provided internet plan. Though network congestion and other connectivity issues can be an issue for some users, the lower price point has been luring cable customers away.
T-Mobile, Verizon and AT&T added a combined 3.7 million FWA customers in 2024. In sharp contrast, Comcast’s Xfinity and Charter’s Spectrum lost more than 900,000 home internet subscribers. That’s depicted in this graph:
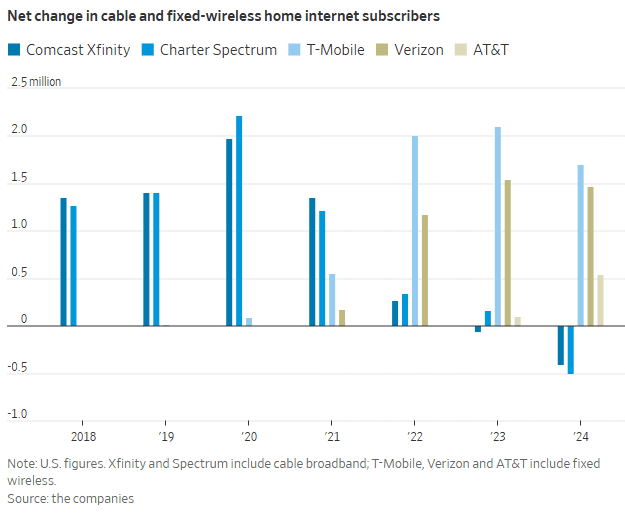
“Our pricing wasn’t breaking through in the marketplace,” said Steve Croney, chief operating officer for Comcast’s connectivity and platforms business. He said the company’s five-year price lock, introduced in April, competes well against the telecom companies’ offerings.
Frank Boulben, chief revenue officer at Verizon’s consumer group, said his company has been trying to address the “pain points” customers have with cable companies, such as price hikes. That’s why the telco is emphasizing FWA vs its FiOS fiber to the home based service. Boulben said his company would focus on selling fiber service to customers as it becomes available to them.
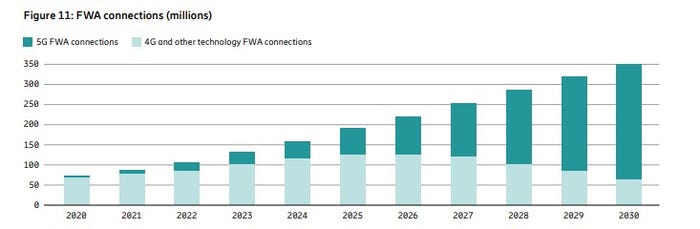
Is FWA the ONLY real killer application for 5G? Even though it was NOT one of the envisioned use cases? Ericsson’s recently released Mobility Report says FWA will account for more than 35% of all new fixed broadband connections, with an expected increase to 350 million by the end of 2030. The report states that more than half of all network service providers (wireless telcos) who offer FWA now do so with “speed-based monetization benefits enhanced by 5G.”
About 80% of the global network operators sampled by Ericsson currently offer FWA, with the most rapid area of growth among CSPs (communications service providers) offering 5G-enabled speed-based tariff plans. These opportunities are about the ability to offer a range of subscriber packages with different downlink and uplink data options with 5G FWA. As with fiber deals, “increasing monetization opportunities for CSPs compared to earlier generations of FWA.” 51% of operators with FWA offerings now include these speed-based options, which is up from 40% on the same period in June 2024 and represents a 27.5% increase. The June 2024 number had grown 50% on the June 2023 equivalent.
Source: Ericsson Mobility Report
…………………………………………………………………………………………………………………………………………………………………..
“We are at an inflection point, where 5G and the ecosystem are set to unleash a wave of innovation,” said Erik Ekudden, Ericsson Senior Vice President and Chief Technology Officer. “The recent advancements in 5G standalone (SA) networks, coupled with the progress in 5G-enabled devices, have led to an ecosystem poised to unlock transformative opportunities for connected creativity. Service providers have recognized this potential of 5G and are beginning to monetize it through innovative service offerings that extend beyond merely selling data plans. To fully realize the potential of 5G, it is essential to continue deploying 5G SA and to further build out mid-band sites. 5G SA capabilities serve as a catalyst for driving new business growth opportunities.”
Fixed-wireless doesn’t work everywhere. Besides congestion weak signals can make coverage spotty. If your cell phone doesn’t pick up 5G coverage smoothly, fixed-wireless from the same company probably won’t work either.
Verizon, AT&T and T-Mobile are winning converts to FWA at a faster pace than many anticipated, said Jonathan Chaplin, a managing partner at equity research firm New Street Research. Charter agreed to buy Cox last month for $21.9 billion in equity and assume $12 billion of its outstanding debt, in part to acquire scale to better compete with fixed wireless access. However, fixed-wireless growth can’t last indefinitely. The wireless networks on which they run will eventually hit capacity, limiting how many subscribers they can add. Chaplin estimates the networks can support around 19 million total fixed-wireless subscribers—which he predicts they will reach in about five years, accounting for planned network expansions that the companies have announced. When that limit is reached, cable companies may regain the upper hand and keep growing their fiber customer base, Chaplin said.
The big three wireless carriers (AT&T, Verizon and T-Mobile) have all been investing in fiber-based wired networks via build-outs and acquisitions. AT&T is bringing new customers in via FWA, with the long-term goal to convert them to fiber-based service, said Erin Scarborough, who runs that company’s broadband and connectivity initiatives.
References:
https://www.telecoms.com/5g-6g/ericsson-says-fwa-is-boosting-telco-monetization-opportunities
https://www.ericsson.com/en/reports-and-papers/mobility-report
https://www.consumeraffairs.com/news/cable-vs-wireless-war-is-driving-prices-down-062525.html
Dell’Oro: 4G and 5G FWA revenue grew 7% in 2024; MRFR: FWA worth $182.27B by 2032
Latest Ericsson Mobility Report talks up 5G SA networks and FWA
T-Mobile posts impressive wireless growth stats in 2Q-2024; fiber optic network acquisition binge to complement its FWA business
5G Advanced offers opportunities for new revenue streams; 3GPP specs for 5G FWA?
FWA a bright spot in otherwise gloomy Internet access market
Comcast faces competitive intensity; loses 120K broadband subs in 2Q-2024
Comcast today reported adjusted earnings of $1.21 a share for the quarter, beating Wall Street’s call for $1.12, according to FactSet. Revenue of $29.7 billion was slightly below consensus estimates of $30 billion. However, the company reported a loss of 120,000 total domestic broadband customers and 419,000 domestic video subscribers in the 2nd quarter.
“The competitive intensity that we’ve seen for the past several quarters, and which is particularly felt in the market for price-conscious consumers, remains essentially unchanged,” Comcast President Mike Cavanagh said on today’s earnings call.
“One of the most important metrics we monitor is the magnitude of data traffic flowing across our network. And again, we saw a double-digit year-over-year growth this quarter, with broadband-only households consuming over 700 gigabytes of data each month. And our customers continue to take faster speeds, with around 70% of our residential subscribers receiving speeds of 500 megabits per second or higher and one-third getting a gigabit or more. These positive consumer trends play to our strengths and will only accelerate with the shift of live sports to streaming, which together with entertainment on streaming accounts for nearly 70% of our network traffic today.My final thought on broadband is the importance of bundling with mobile, with 90% of Xfinity Mobile smartphone traffic traveling over our WiFi network. These two products work seamlessly together to benefit our customers from both the products’ experience and financial value standpoint.”
Seaport Research analyst David Joyce:
“Due to continued Broadband subscriber losses (where growth is driven by pricing), an elevated competitive environment for the time being, and the mixed Media topline and profitability trajectories, we remain Neutral,” Joyce wrote. Sentiment will improve when there are signs of stabilization in broadband market share, he added.
Comcast is moving ahead with HFC network upgrades, including “mid-splits” that dedicate more capacity to the upstream. Watson said mid-splits have been completed in about 42% of Comcast’s HFC footprint, a figure he expects to reach 50% by the end of the year. Comcast’s mid-splits are occurring alongside a plan to deploy DOCSIS 4.0 upgrades that are initially delivering symmetrical speeds of up to 2 Gbit/s. Comcast has D4.0-based services available in three markets – Philadelphia, Atlanta and Colorado Springs – with Seattle up next.
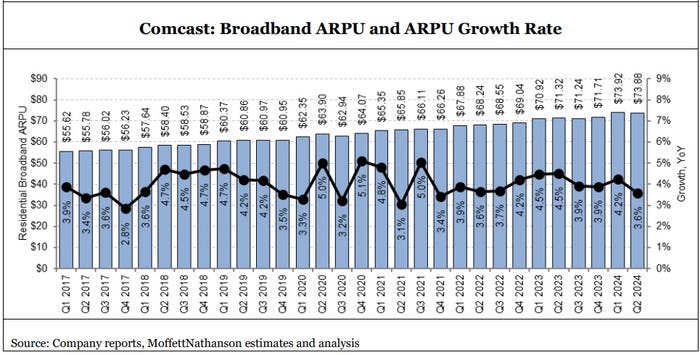
Broadband average revenue per unit (ARPU), which was up 3.6% in the quarter, remains a bright spot as customers continue to gravitate to higher speed tiers. Comcast CEO Brian Roberts: “Broadband ARPU increased by 3.6% and we delivered 6% revenue growth in our connectivity businesses, while expanding our Adjusted EBITDA margin across Connectivity & Platforms to a record-high 41.9%.”
“Faster homes passed growth shouldn’t be expected to turn broadband subscribership back into a growth engine, but it is a critical factor in keeping broadband subscriber results stable,” MoffettNathanson analyst Craig Moffett explained in a research note (payment required) issued today.
Comcast also expects to participate in the $42.45 billion Broadband Equity Access and Deployment (BEAD) program.
Comcast’s pay-TV business continued its downward spiral. The company lost 419,000 video subs in Q2, an improvement from a year-ago loss of 543,000. Analysts were expecting Comcast to shed about 502,000 video subs in Q2.
The Peacock streaming service, which broadcasts live sporting events like the upcoming summer Olympics, reported paid subscribers soared 38% from a year ago to 33 million, while revenue rose 28% in the 2nd quarter to $1 billion.
2nd Quarter 2024 Highlights:
• Adjusted EPS Increased 7.0% to $1.21; Generated Free Cash Flow of $1.3 Billion, Including a Tax
Payment Related to the Previously Announced Hulu Transaction and Other Tax Related Matters
• Return of Capital to Shareholders Totaled $3.4 Billion Through a Combination of $1.2 Billion in
Dividend Payments and $2.2 Billion in Share Repurchases
• Connectivity & Platforms Adjusted EBITDA Increased 1.6% to $8.5 Billion and Adjusted EBITDA
Margin Increased 90 Basis Points to 41.9%, Its Highest on Record
• Continued the Successful Execution of Our Domestic Network Expansion and Upgrade Strategy;
Expanded Deployment of Mid-Split Technology to 42% of Our Footprint; And Added 302,000 New
Homes and Businesses Passed in the Second Quarter
• Domestic Broadband Average Rate Per Customer Increased 3.6%, Driving Domestic Broadband
Revenue Growth of 3.0% to $6.6 Billion.
• Domestic Wireless Customer Lines Increased 20% Compared to the Prior Year Period to 7.2 Million,
Including Net Additions of 322,000 in the Second Quarter.
• Business Services Connectivity Adjusted EBITDA Increased 4.4% to $1.4 Billion and Adjusted
EBITDA Margin Was 57.0%.
• Media Adjusted EBITDA Increased 9.0% to $1.4 Billion, Driven by Improved Performance at Peacock
• Peacock Paid Subscribers Increased 38.0% Compared to the Prior Year Period to 33 Million;
Peacock Revenue Increased 28% to $1.0 Billion; Best Year-Over-Year Improvement in Adjusted
EBITDA for Any Quarter Since Launch in 2020.
…………………………………………………………………………………………………………………………………
References:
https://www.cmcsa.com/static-files/68abe434-80f7-437e-8e7a-fa457e43e63b
https://seekingalpha.com/article/4705822-comcast-corporation-cmcsa-q2-2024-earnings-call-transcript
Point Topic: FTTP broadband subs to reach 1.12bn by 2030 in 29 largest markets
Point Topic forecasts 1.39 billion fixed broadband connections by the end of the decade in the 29 largest broadband markets in the world. Fiber to the Premises (FTTP) is already dominating most of the markets and it will be the preferred option for most consumers, where it is available.
Between 2023 and 2030 Point Topic projects a 15% growth in total fixed broadband subscribers in the top 29 markets. The growth will come mainly from FTTP – although the increase in the total fiber lines will be lower than that in Fixed Wireless Access lines – 25% and 61% respectively, the sheer number of already existing and new FTTP connections will drive the total growth.

Figure 1. Fixed broadband lines by technology (Top 29 markets)
………………………………………………………………………………………………………..
Split by technology we estimate that by 2030 there will be 1.12 billion FTTP, 149 million cable, 79 million FTTX, 16 million FWA[1] and only 28 million DSL lines in these markets.
 Figure 2. Change in fixed broadband lines, 2023-2030 (Top 29 markets)
Cable is a term used as a proxy for those legacy MSOs/cablecos (e.g. Charter, VMO2, Comcast, etc.) that still have significant networks based on coaxial cable, mainly DOCSIS 3.0 and 3.1. We forecast some decline (-6%) in cable broadband lines by the end of the decade as these networks are being replaced with full fibre. The new generation DOCSIS4, which is in development, will match the capabilities of FTTH with XGPON, so markets with established cable networks will see a slight growth or stable take-up figures for ‘cable’ broadband lines.
FTTX (where fibre is present in the local loop with copper, mainly fiber to the cabinet) will decline over the next seven years (-19%). Some modest growth from new subscribers will remain in a few markets where legacy infrastructure is still widespread. Also, it will remain a cheaper option even where other technologies are available as it still offers enough bandwidth for some users.
DSL will see the largest decline at -44%. However, while being a slower and less reliable solution, it can provide enough bandwidth at a low price to some single or older households that are reluctant to upgrade. Besides, some of them will not have a choice of other technologies, especially in certain regions and markets.
………………………………………………………………………………………………………………

Figure 3. Fixed broadband penetration, 2023 and 2030 (top 29 markets)
…………………………………………………………………………………………………………………………
Point Topic only included FWA in its data in significant markets and where it was able to source reliable figures, such at the U.S., Canada, and Italy. Therefore, the total number of FWA subscribers could end up higher if FWA takes off in other markets.
In the U.S., T-Mobile US and Verizon are the FWA leaders with 8.6 million connections between them as of March 2024. T-Mobile recently added a new FWA service offer to its portfolio aimed at customers who might need a back-up for unreliable fiber or cable connections.
……………………………………………………………………………………………………………………..
China will be among the 16 markets with 90%-plus broadband penetration in seven years time. The potential for signing up new customers in those markets will shrink, leaving broadband providers with the task of converting existing customers to higher bandwidths and more advanced technologies for growth.
At the other end of the scale, there is still lots of room for broadband growth. India will have the lowest percentage of premises with a fixed broadband connection by 2030 at 33%, up from just 11% last year.
“There is significant growth to come in the ‘youthful’ markets with low fixed broadband penetration, with plenty of consumers in India, Indonesia and other fast-growing economies hungry for the advantages offered by fixed broadband and full fibre in particular,” Point Topic said.
……………………………………………………………………………………………………………………..
References:
https://www.point-topic.com/post/fttp-broadband-subscriber-forecasts-q4-2023
https://www.telecoms.com/fibre/fibre-to-drive-15-broadband-growth-by-2030
U.S. broadband subscriber growth slowed in 1Q-2024 after net adds in 2023
Dell’Oro: Broadband access equipment sales to increase in 2025 led by XGS-PON deployments
Altice USA transition to fiber access; MoffettNathanson analysis of low population growth on cablecos broadband growth
Dell’Oro: Optical Transport, Mobile Core Network & Cable CPE shipments all declined in 1Q-2024
Apparently, there’s no place to hide in any telecom or datacom market? We all know the RAN market has been in a severe decline, but recent Dell’Oro Group reports indicate that Optical Transport, Mobile Core Network and Cable CPE shipments have also declined sharply in the 1st Quarter of 2024.
Here are a few selected quotes from Dell’Oro analysts:
“The North American broadband market is in the midst of a fundamental shift in the competitive landscape, which is having a significant impact on broadband equipment purchases,” said Jeff Heynen, Vice President with Dell’Oro Group. “In particular, cable operators are trying to navigate mounting, but predictable, broadband subscriber losses with the need to invest in their networks to keep pace with further encroachment by fiber and fixed wireless providers,” explained Heynen.
Omdia, owned by the ADVA, expects cable access equipment spending to grow later in 2024 and peak in 2026 at just over $1 billion, then drop off to $700 million in 2029.

………………………………………………………………………………………………………
“Customer’s excess inventory of DWDM systems continued to be at the center stage of the Optical Transport market decline in the first quarter of 2024,” said Jimmy Yu, Vice President at Dell’Oro Group. “However, we think the steeper-than-expected drop in optical transport revenue in 1Q 2024 may have been driven by communication service providers becoming increasingly cautious about the macroeconomic conditions, causing them to delay projects into future quarters,” added Yu.
…………………………………………………………………………………………………..
“Inflation has impacted the ability of some Mobile Network Operators (MNOs) to raise capital, and it has also impacted subscribers when it comes to upgrading their phones to 5G. Many MNOs have lowered their CAPEX plans and announced that they have fewer than expected 5G subscribers on their networks; which limits MNOs’ growth plans. As a result, we are lowering our expectations for 2024 from a positive growth rate to a negative one,” by Research Director Dave Bolan.
- As of 1Q 2024, 51 MNOs have commercially deployed 5G SA (Stand Alone) eMBB networks with two additional MNOS launching in 1Q 2024.
References:
Optical Transport Equipment Market Forecast to Decline in 2024, According to Dell’Oro Group
Optical Transport Equipment Market Forecast to Decline in 2024, According to Dell’Oro Group
U.S. broadband subscriber growth slowed in 1Q-2024 after net adds in 2023
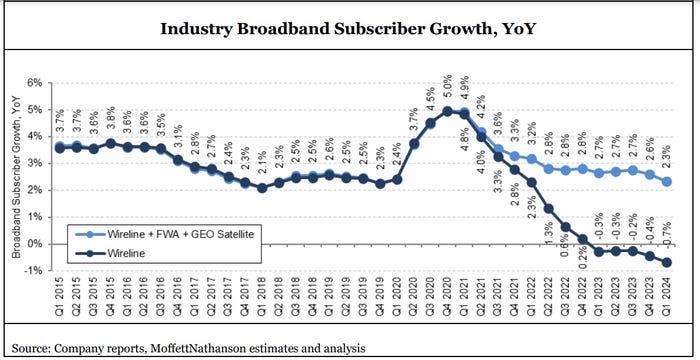
The pace of U.S. broadband subscriber growth slowed considerably in the first quarter of 2024 as fiber, fixed wireless access (FWA) and cable broadband service providers collectively turned in results that were worse than what they posted in the year-ago period.
Total industry net additions, including or excluding FWA and geosynchronous (GEO) satellite broadband providers, decelerated noticeably in Q1 2024. The total market’s growth rate decreased to just 2.3% year-over-year, the slowest since the COVID-19 pandemic, analysts at MoffettNathanson estimated in its latest broadband industry trends report (paid subscription required). When FWA and GEO satellite categories were excluded, the growth rate was much worse: -0.7%.
The overall number of U.S. broadband market subscribers decelerated by 299,000 net adds versus the year-ago quarter. “That was the most abrupt since Q2 2022,” said MoffettNathanson analyst Craig Moffett. “The bottom line is that penetration of home broadband stalled, and perhaps even declined in the quarter, particularly if one adjusts for the growth in homes passed in rural areas under RDOF [Rural Digital Opportunity Fund] subsidies and unsubsidized edgeouts,” Moffett wrote.
Here’s a breakdown of U.S. broadband subscribers by access type:
- Fixed Wireless Access (FWA) providers added 879,000 subs in Q1 2024, down from a gain of 925,000 in the year-ago period.
- Fiber net adds also slowed – from 487,000 in Q1 2024 versus a gain of 517,000 in the year-ago quarter.
- DSL losses of 560,000 in Q1 were similar to a year-ago loss of 571,000.
- MSO/cable network operators shed 169,000 broadband subs in Q1, much worse than a year-ago gain of about 71,000 subs.
“The culprit for cable’s weaker broadband net additions was a slower market growth rate,” though lower new household formation and cessation of ACP enrollments in the quarter also played a role, Moffett noted.
……………………………………………………………………………………………………………..
According to Statista, the total number of broadband subscribers in the U.S. stood at 114.7 million at the end of 2023, This was an increase of over four million subscribers compared to the previous year.
Source: Statista
…………………………………………………………………………………………………………………………
In March 2024, Leitman Research found that the largest cable and wireline phone providers and fixed wireless services in the U.S. – representing about 96% of the market – acquired about 3,520,000 net additional broadband Internet subscribers in 2023, similar to a pro forma gain of 3,530,000 subscribers in 2022.
Leitman Research findings for 2023:
- The top cable companies lost about 65,000 subscribers in 2023 – compared to about 530,000 net adds in 2022
- The top wireline phone companies lost about 80,000 total broadband subscribers in 2023 – compared to about 180,000 net losses in 2022
- Wireline Telcos had about 1.97 million net adds via fiber in 2023, offset by about 2.05 million non-fiber net losses
- Fixed wireless/5G home Internet services from T-Mobile and Verizon added about 3,665,000 subscribers in 2023 – compared to about 3,185,000 net adds in 2022
- Fixed wireless services accounted for 104% of the total net broadband additions in 2023, compared to 90% of the net adds in 2022, and 20% of the net adds in 2021
“Top broadband providers added about 3.5 million subscribers in 2023, similar to the number of broadband adds in 2022,” said Bruce Leichtman, president and principal analyst for Leichtman Research Group, Inc. “Over the past four years, top providers added about 15.9 million broadband subscribers, compared to about 10.2 million net broadband adds in the prior four (pre-pandemic) years.”
………………………………………………………………………………………………………..
References:
https://www.lightreading.com/broadband/us-broadband-subscriber-pace-slows-across-the-board
https://www.statista.com/statistics/217938/number-of-us-broadband-internet-subscribers/
Dell’Oro: Broadband access equipment sales to increase in 2025 led by XGS-PON deployments
Fiber and Fixed Wireless Access are the fastest growing fixed broadband technologies in the OECD
Verizon’s 2023 broadband net additions led by FWA at 375K
Charter Communications: surprise drop in broadband subs, homes passed increased, HFC network upgrade delayed to 2026
Altice USA transition to fiber access; MoffettNathanson analysis of low population growth on cablecos broadband growth
Dell’Oro: Broadband access equipment sales to increase in 2025 led by XGS-PON deployments
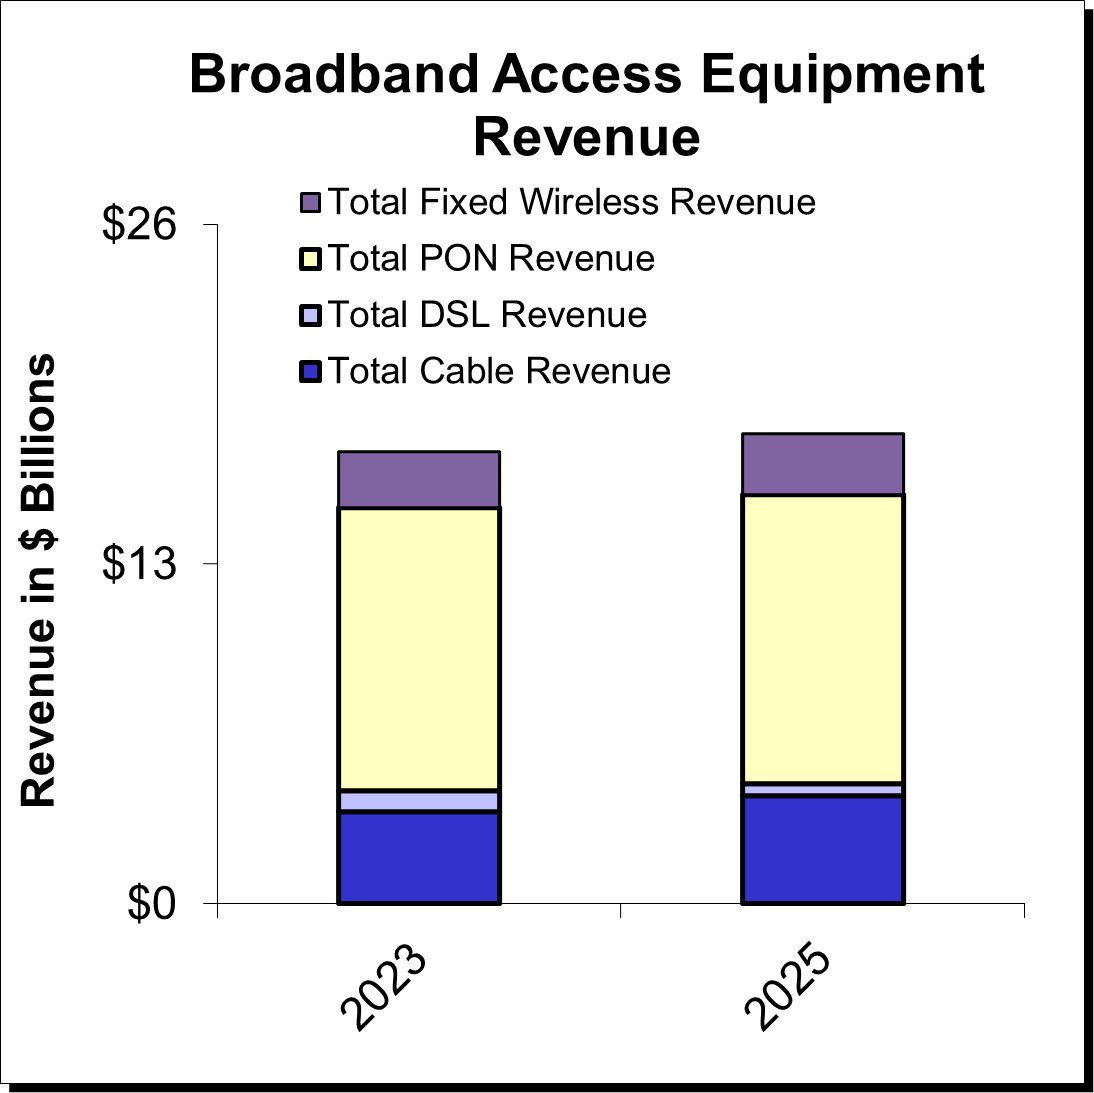
Dell’Oro Group expects broadband access equipment sales to decline by 1% in 2024 versus 2023, with the first half of 2024 seeing continued weakness followed by a surge in spending in the second half of the year. The first half of 2024 will continue to see some of the inventory corrections that marked a tough 2023 that saw a spending decline of 8% to 10%, according to Dell’Oro VP Jeff Heynen.
“Although the inventory corrections seen in 2023 will continue through the first half of 2024, the second half of the year is expected to be the turning point towards renewed growth,” said Jeff Heynen, Vice President at Dell’Oro Group. “Service providers still have the same goals of increasing their fiber footprint, increasing the bandwidth they can offer their customers, and improving the reliability of their broadband services through the distribution of intelligence closer to subscribers,” added Heynen.
Additional highlights from the Broadband Access & Home Networking 5-Year January 2024 Forecast Report:
- PON equipment revenue is expected to grow from $10.8 B in 2023 to $11.8 B in 2028, driven largely by XGS-PON deployments in North America, EMEA, and CALA and early 50 Gbps deployments in China.
- Revenue for Cable Distributed Access Equipment (Virtual CCAP, Remote PHY Devices, Remote MAC/PHY Devices, and Remote OLTs) is expected to reach $1.3 B by 2028, as operators continue their DOCSIS 4.0 and early fiber deployments.
- Revenue for Fixed Wireless CPE is expected to reach $2.5 B by 2028, led by shipments of 5G sub-6GHz and a growing number of 5G Millimeter Wave units.
- Revenue for Wi-Fi 7 residential routers and broadband CPE with WLAN will reach $9.3B by 2028, as the technology is rapidly adopted by consumers and service providers alike.
Source: Dell’Oro Group
About the Report:
The Dell’Oro Group Broadband Access & Home Networking 5-Year Forecast Report provides a complete overview of the Broadband Access market with tables covering manufacturers’ revenue, average selling prices, and port/unit shipments for PON, Cable, Fixed Wireless, and DSL equipment. Covered equipment includes Converged Cable Access Platforms (CCAP), Distributed Access Architectures (DAA), DSL Access Multiplexers (DSLAMs), PON Optical Line Terminals (OLTs), Customer Premises Equipment ([CPE] for Cable, DSL, PON, Fixed Wireless), along with Residential WLAN Equipment, including Wi-Fi 6E and Wi-Fi 7 Gateways and Routers. For more information about the report, please contact [email protected].
References:
Calix and Corning Weigh In: When Will Broadband Wireline Spending Increase?
Dell’Oro: Broadband network equipment spending to drop again in 2024 to ~$16.5 B
Dell’Oro: Broadband Equipment Spending to exceed $120B from 2022 to 2027
Dell’Oro: XGS, 25G, and Early 50G PON Rollouts to Fuel Broadband Spending
Alaska Communications uses XGS-PON, FWA, DSL in ~5K homes including Fairbanks and North Pole
AT&T to deploy FTTP network based on XGS-PON in Amarillo, TX
Telefonica España to activate XGS-PON network in 2022; DELTA Fiber to follow in Netherlands
Leichtman Research Group: U.S. added 840,000 broadband subs in 2Q-2023
Leichtman Research Group, Inc. (LRG) found that the largest cable and wireline phone providers and fixed wireless services in the U.S. – representing about 96% of the market – acquired about 840,000 net additional broadband Internet subscribers in 2Q 2023, compared to a pro forma gain of about 700,000 subscribers in 2Q 2022.
These top broadband providers now account for over 112.9 million subscribers, with top cable companies having about 76.2 million broadband subscribers, top wireline phone companies having about 30.7 million subscribers, and top fixed wireless services having about 5.9 million subscribers.
Findings for the quarter include:
- Overall, broadband additions in 2Q 2023 were 120% of those in 2Q 2022
- The top cable companies added about 10,000 subscribers in 2Q 2023 – compared to a loss of about 60,000 in 2Q 2022
- The top wireline phone companies lost about 60,000 total broadband subscribers in 2Q 2023 – similar to about 60,000 net losses in 2Q 2022
- Wireline Telcos had about 450,000 net adds via fiber in 2Q 2023, and about 510,000 non-fiber net losses
- Fixed wireless/5G home Internet services from T-Mobile and Verizon added about 890,000 subscribers in 2Q 2023 – compared to 815,000 net adds in 2Q 2022
“Top broadband providers added about 840,000 subscribers in 2Q 2023, led by another strong quarter from fixed wireless,” said Bruce Leichtman, president and principal analyst for Leichtman Research Group, Inc. “Fixed wireless services have acquired over 800,000 net adds in each of the past five quarters, accounting for about 4.45 million net adds in that period.”
| Broadband Providers | Subscribers at end of 2Q 2023 | Net Adds in 2Q 2023 |
| Cable Companies | ||
| Comcast | 32,305,000 | (19,000) |
| Charter | 30,586,000 | 77,000 |
| Altice | 4,576,100 | (36,600) |
| Cable One | 1,057,900 | (5,100) |
| Breezeline* | 680,785 | (6,734) |
| Other major private companies** | 7,035,000 | 0 |
| Total Top Cable | 76,240,785 | 9,566 |
| Wireline Phone Companies | ||
| AT&T | 15,304,000 | (41,000) |
| Verizon | 7,562,000 | 34,000 |
| Lumen | 2,909,000 | (72,000) |
| Frontier | 2,865,000 | 2,000 |
| Windstream^ | 1,175,000 | 0 |
| TDS | 523,600 | 8,200 |
| Consolidated | 376,829 | 6,967 |
| Total Top Wireline Phone | 30,715,429 | (61,833) |
| Fixed Wireless Services | ||
| T-Mobile | 3,678,000 | 509,000 |
| Verizon* | 2,260,000 | 384,000 |
| Total Top Fixed Wireless | 5,938,000 | 893,000 |
| Total Top Broadband | 112,894,214 | 840,733 |
Leichtman Research Group, Inc. (LRG) specializes in research and analysis on broadband, media and entertainment industries. LRG combines ongoing consumer surveys with industry tracking and analysis, to provide companies with a richer understanding of current market conditions, and the potential impact and adoption of new products and services. For more information about LRG, please call (603) 397-5400 or visit www.LeichtmanResearch.com.
Leichtman Research Group: Fixed Wireless Services Accounted for 90% of the Broadband Net Adds in 2022!
AT&T, Verizon and Comcast all lost fixed broadband subscribers in 2Q-2023
ABI Research joins the chorus: 5G FWA is a competitive alternative to wired broadband access
Leichtman Research Group: U.S. broadband growth returns to pre-pandemic levels in Q3-2021
BroadbandNow Research: Best & Worst States for Broadband Access
A recent study by BroadbandNow Research has assessed the best and worst states in the U.S. for broadband internet access in 2023. The study evaluated each state and the District of Columbia based on various factors such as access to wired or fixed wireless broadband, access to low-priced broadband, median download speed, and median upload speed.
Key Findings:
- Availability of low-priced broadband has increased across the U.S. There is now only 1 state with less than 20% of the population having access to a broadband plan for $60 per month or less (down from 25 states last year). Having said that, in only one state, Wyoming, more than half of residents have access to such a plan.
- Latency (round trip time) is a measure of responsiveness–the time between when you click something and when you get a response–and it’s critical for a smooth internet experience, especially for real-time interactions such as gaming or video calls. There is a huge geographic disparity between states that do well in this metric, like New York or Washington with median round trip times less than 7.5 milliseconds, and states that do poorly, like Hawai’i and Massachusetts with median round trip times greater than 61 milliseconds.
- Delaware is the best state for broadband internet, with 46.2% of its population having access to low-priced broadband and a median download speed of 96.1 Mbps. On the other hand, Alaska ranked at the bottom of the list, with only 20% of its population having access to affordable broadband and a median download speed of 58.5 Mbps.
- We support changing the definition of broadband speeds from 25Mbps down and 3Mbps up to 100Mbps down and 25Mbps up, but we’re a long way away from widespread access to those speeds. Nationally, only 39% of Americans are getting 100Mbps down, and only 25% are getting 25Mbps up.
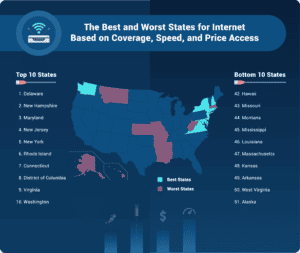
10 Best States for Broadband
10 Worst States for Broadband
According to the study, there is only one state, Nevada, with less than 20% of its population having access to a broadband plan for $60 per month or less. This is a significant drop from the 25 states that had such limited access last year.
In the Tri-State area, Illinois secured the 14th spot with 95.7% of its residents having access to wired or fixed wireless broadband. Additionally, 31.4% of the population had access to low-priced broadband. Illinois also boasted a median download speed of 85.3 Mbps, surpassing the national median.
Indiana ranked 23rd overall, with an impressive download speed of 85.7 Mbps. 31.4% of its population also had access to low-priced broadband. However, the state fell short in terms of overall broadband access, with only 92.8% of residents having access to wired or fixed wireless broadband.
Kentucky landed at the 36th spot, with a mere 25% of its population having access to affordable broadband. In an effort to improve access, Governor Andy Beshear, Senator Mitch McConnell, and other lawmakers secured over $1 billion in funding for broadband access in June, marking the largest public investment in high-speed internet in the state’s history.
References:
GAO: U.S. Broadband Benchmark Speeds Too Slow; FCC Should Analyze Small Business Speed Needs
FCC proposes 100 Mbps download as U.S. minimum broadband speed
