

Craig Moffett
U.S. broadband subscriber growth slowed in 1Q-2024 after net adds in 2023
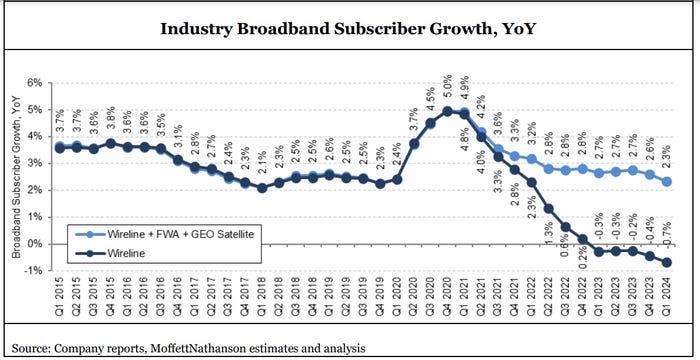
The pace of U.S. broadband subscriber growth slowed considerably in the first quarter of 2024 as fiber, fixed wireless access (FWA) and cable broadband service providers collectively turned in results that were worse than what they posted in the year-ago period.
Total industry net additions, including or excluding FWA and geosynchronous (GEO) satellite broadband providers, decelerated noticeably in Q1 2024. The total market’s growth rate decreased to just 2.3% year-over-year, the slowest since the COVID-19 pandemic, analysts at MoffettNathanson estimated in its latest broadband industry trends report (paid subscription required). When FWA and GEO satellite categories were excluded, the growth rate was much worse: -0.7%.
The overall number of U.S. broadband market subscribers decelerated by 299,000 net adds versus the year-ago quarter. “That was the most abrupt since Q2 2022,” said MoffettNathanson analyst Craig Moffett. “The bottom line is that penetration of home broadband stalled, and perhaps even declined in the quarter, particularly if one adjusts for the growth in homes passed in rural areas under RDOF [Rural Digital Opportunity Fund] subsidies and unsubsidized edgeouts,” Moffett wrote.
Here’s a breakdown of U.S. broadband subscribers by access type:
- Fixed Wireless Access (FWA) providers added 879,000 subs in Q1 2024, down from a gain of 925,000 in the year-ago period.
- Fiber net adds also slowed – from 487,000 in Q1 2024 versus a gain of 517,000 in the year-ago quarter.
- DSL losses of 560,000 in Q1 were similar to a year-ago loss of 571,000.
- MSO/cable network operators shed 169,000 broadband subs in Q1, much worse than a year-ago gain of about 71,000 subs.
“The culprit for cable’s weaker broadband net additions was a slower market growth rate,” though lower new household formation and cessation of ACP enrollments in the quarter also played a role, Moffett noted.
……………………………………………………………………………………………………………..
According to Statista, the total number of broadband subscribers in the U.S. stood at 114.7 million at the end of 2023, This was an increase of over four million subscribers compared to the previous year.
Source: Statista
…………………………………………………………………………………………………………………………
In March 2024, Leitman Research found that the largest cable and wireline phone providers and fixed wireless services in the U.S. – representing about 96% of the market – acquired about 3,520,000 net additional broadband Internet subscribers in 2023, similar to a pro forma gain of 3,530,000 subscribers in 2022.
Leitman Research findings for 2023:
- The top cable companies lost about 65,000 subscribers in 2023 – compared to about 530,000 net adds in 2022
- The top wireline phone companies lost about 80,000 total broadband subscribers in 2023 – compared to about 180,000 net losses in 2022
- Wireline Telcos had about 1.97 million net adds via fiber in 2023, offset by about 2.05 million non-fiber net losses
- Fixed wireless/5G home Internet services from T-Mobile and Verizon added about 3,665,000 subscribers in 2023 – compared to about 3,185,000 net adds in 2022
- Fixed wireless services accounted for 104% of the total net broadband additions in 2023, compared to 90% of the net adds in 2022, and 20% of the net adds in 2021
“Top broadband providers added about 3.5 million subscribers in 2023, similar to the number of broadband adds in 2022,” said Bruce Leichtman, president and principal analyst for Leichtman Research Group, Inc. “Over the past four years, top providers added about 15.9 million broadband subscribers, compared to about 10.2 million net broadband adds in the prior four (pre-pandemic) years.”
………………………………………………………………………………………………………..
References:
https://www.lightreading.com/broadband/us-broadband-subscriber-pace-slows-across-the-board
https://www.statista.com/statistics/217938/number-of-us-broadband-internet-subscribers/
Dell’Oro: Broadband access equipment sales to increase in 2025 led by XGS-PON deployments
Fiber and Fixed Wireless Access are the fastest growing fixed broadband technologies in the OECD
Verizon’s 2023 broadband net additions led by FWA at 375K
Charter Communications: surprise drop in broadband subs, homes passed increased, HFC network upgrade delayed to 2026
Altice USA transition to fiber access; MoffettNathanson analysis of low population growth on cablecos broadband growth
MoffettNathanson: 87.4% of available U.S. homes have broadband; Leichtman Research: 90% of U.S. homes have internet
When the FCC announced the November 18th release date for their long-awaited broadband mapping update, reflecting location-specific broadband availability as of June 2022, analysts at MoffettNathanson thought it would contain information on how many of U.S. homes have access to broadband and how many are too rural and are therefore unserved. However, that FCC release didn’t offer the numbers they needed, and the market research fim didn’t
have the necessary information to calculate it themselves.
In the underlying FCC datasets, which are provided for public download, each location served by a given technology or provider is a separate entry. One location is equivalent to one street address. But many street addresses in the U.S. correspond to multiple living units, and the number of units per location is not publicly available (the location fabric used by the FCC was contracted to a third party, CostQuest Associates, and that fabric is provided only to the FCC, broadband providers, state/local government entities, and select other interested parties). With approximately 31% of residences in multifamily homes, according to a 2019 survey by the Census Bureau, the number of units per location was, as of the November 18th release, a crucial missing piece for any meaningful coverage analysis we could do on our own.
Principal Analyst Craig Moffett wrote:
The FCC’s new maps of broadband availability can tell us coverage for residential locations or business locations, but not the combined total. The companies we cover sometimes break out residential and commercial, but not always. [As an aside, about half of small businesses in the U.S. are actually operated out of peoples’ homes, but hopefully this, at least, doesn’t introduce further distortion, since we are presumably still seeing just one subscription for one location]. So we’ll do our best to make sure we’re matching numerator and denominator by specifying whether we’re looking at all locations or residential locations only.
The FCC’s coverage data also doesn’t distinguish between occupied and vacant units. For our calculation of penetration, we’d want to exclude most vacant units, since vacant units don’t need broadband. Excluding all vacant units likely understates the denominator, though; for example, some second homes (which are treated as vacant) may have year-round broadband subscriptions. The best we can do is assume the coverage of total units is the same as the coverage of occupied units, and that vacant units with broadband subscriptions are negligible.
The FCC does report service coverage for satellite and fixed wireless. But some of those FWA subscribers are in areas where there’s no access to wired broadband, while others are in areas where wired broadband is available. Naturally, the companies won’t tell us how many of each there are. So we’ll just have to leave them all out. We’ll focus just on the availability of wired broadband.
Editor’s Note: The FCC broadband map for my address show a Licensed Fixed Wireless operator serves my condo. It’s California Internet with symmetrical 1G upstream/1G downstream. Also, there are two Satellite providers – Hughes Network Systems, LLC 25M/3M and Space X 350M/40M. Wired internet is available from AT&T and Comcast.
We’d really want to know how many DSL subscribers are in each of those different cohorts. But the
companies we cover don’t report how many of their DSL subscribers are in areas where there is
also a cable or fiber operator, and how many are in areas where DSL is the only option. The first
group is at risk. The second group is not. So, we’ll just have to include all DSL.
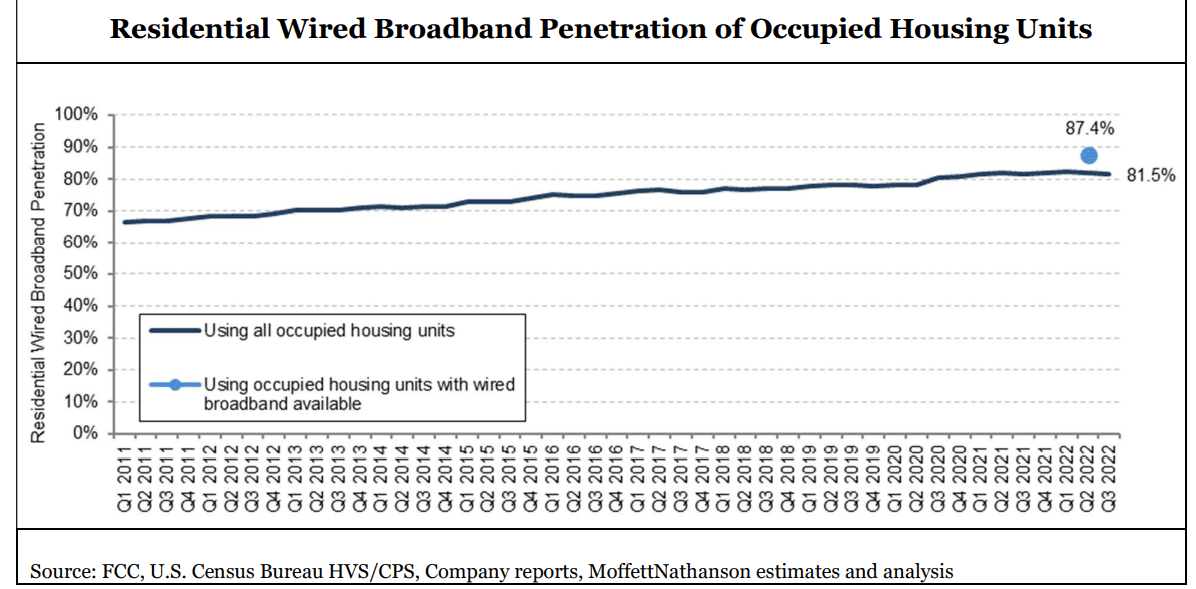
According to the FCC’s current estimates, wired broadband (defined as anything over 200 kbps downstream and 200 kbps upstream) was available to 93.7% of residential units in America as of June 30, 2022. Again, we don’t know the percentage of occupied housing units with wired broadband available, but let’s assume it’s the same. And we don’t know the number of residential units in the location fabric, so we’ll use the Census Bureau’s estimate of 128.1M occupied housing units in the U.S. Given these assumptions, we estimate wired broadband was available to around 120.0M occupied housing units as of June 30, 2022. With, by our count, an estimated 104.9M residential wired broadband subscriptions in America in Q2 2022 – again, including DSL, and sometimes including commercial as well as residential subscribers – that translates into penetration of 87.4% of broadband-available homes. We estimate that 81.5% of all households subscribe to wired broadband.
Craig’s Conclusions:
The goal for the FCC is to create maps that are not frozen in time but instead become living and breathing reflections of a dynamic marketplace. The new maps are subject to a public challenge process, enabling interested parties, including operators, local governments, and even individual would-be subscribers, to dispute reported availability. Challenges will eventually be part of a routine updating process. Indeed, the maps released in November were the product of what had already been a months-long initial challenge process. The maps are, again, a critical input to distribution of $42.5 billion of funds earmarked for rural broadband by the JOBS/Infrastructure Act. The National Telecommunications and Information Administration (NTIA) is required by law to use the FCC’s new map to distribute those funds in what is referred to as the Broadband Equity, Access, and Deployment (BEAD) Program, something they have committed to do by June 2023. They are likely to begin that process almost immediately, based on the number of unserved locations in each state, although NTIA chief Alan Davidson has said they will wait for the FCC to release the second version of its coverage map, later this year, before they actually begin to disburse those funds.
The network operators themselves, including the cable operators in particular, will in our view be major participants in the BEAD process, bidding aggressively to bring broadband to unserved census blocks on the periphery of their current franchise areas.
…………………………………………………………………………………………………………………………………………………………………………….
Meanwhile, Leichtman Research Group indicates that 90 per cent of U.S. households get an Internet service at home, compared to 84 per cent in 2017, and 74 per cent in 2007. Broadband accounts for 99 per cent of households with an Internet service at home, and 89 per cent of all households get a broadband Internet service – an increase from 82 per cent in 2017, and 53 per cent in 2007.
These findings are based on a survey of 1,910 households from throughout the United States and are part of a new LRG study, Broadband Internet in the U.S. 2022. This is LRG’s twentieth annual study on this topic.
Other related findings include:
- Individuals ages 65+ account for 34% of those that do not get an Internet service at home
- 56% of broadband subscribers are very satisfied (8-10 on a 1-10 scale) with their Internet service at home, while 6% are not satisfied (1-3).
- 44% of broadband subscribers do not know the download speed of their service – compared to 60% in 2017
- 61% reporting Internet speeds of >100 Mbps are very satisfied with their service, compared to 41% with speeds <50 Mbps, and 57% that do not know their speed
- 40% of broadband households get a bundle of services from a single provider – compared to 64% in 2017, and 78% in 2012
- 59% of adults with an Internet service at home watch video online daily – compared to 59% in 2020, 43% in 2017, and 17% in 2012
“The percentage of households getting an Internet service at home, including high-speed broadband, is higher than in any previous year,” said Bruce Leichtman, president and principal analyst for Leichtman Research Group, Inc. “Computer usage and knowledge remain the foundation for Internet services in the home. Among those that do not get an Internet service at home, 58% also do not use a computer at home..”
References:
https://broadbandmap.fcc.gov/home
https://www.leichtmanresearch.com/90-of-u-s-households-get-an-internet-service-at-home/
MoffettNathanson: Robust broadband and FWA growth, but are we witnessing a fiber bubble?
According to a new comprehensive, market research report from MoffettNathanson (written by our colleague Craig Moffett), Q4 2021 broadband growth, at +3.3%, “remains relatively robust,” and above pre-pandemic levels of about +2.8%.
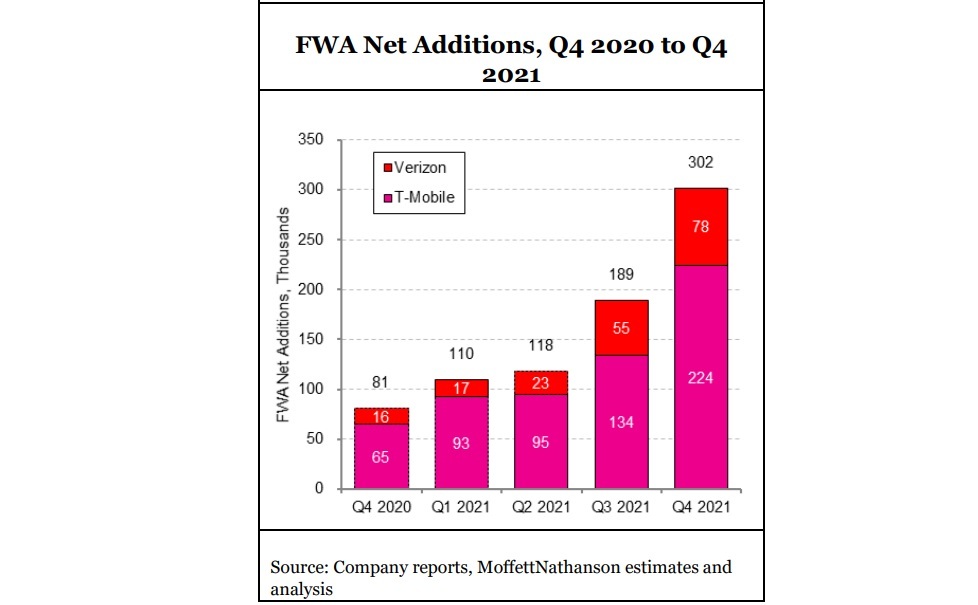
Meanwhile, the U.S. fixed wireless access (FWA market) captured ~ 38% share of broadband industry net adds in the fourth quarter of 2021. Approximately half of Verizon’s FWA customers are coming from commercial accounts, T-Mobile has indicated that about half its FWA customers are coming from former cable Internet subscribers. FWA’s strong Q4 showing left cable’s flow share at just 66%, about the same as cable’s share of installed US broadband households. “In other words, Cable likely neither gained nor lost share during the quarter, and instead merely treaded water,” Moffett noted. FWA “has gone from low-level background noise to suddenly a major force, with Verizon and T-Mobile alone capturing more than 300K FWA subscribers in the fourth quarter,” Craig noted. However, he isn’t sure that wireless network operators will allocate enough total bandwidth capacity for FWA to fully scale.
In 2020, a year that witnessed a surge in broadband subs as millions worked and schooled from home, the growth rate spiked to 5%. Here’s a snapshot of the broadband subscriber metrics per sector for Q4 2021:
Table 1:
| Sector | Q4 2021 Gain/Loss | Q4 2020 Gain/Loss | Year-on-Year Growth % | Total |
| Cable | +464,000 | +899,000 | +3.8% | 79.43 million |
| Telco | -26,000 | +21,000 | -0.4% | 33.51 million |
| FWA* | +302,000 | +81,000 | +463.9% | 869,000 |
| Satellite | -35,000 | -35,000 | -6.6% | 1.66 million |
| Total Wireline | +437,000 | +920,000 | +2.8% | 112.95 million |
| Total Broadband | +704,000 | +966,000 | +3.3% | 115.48 million |
| * Verizon and T-Mobile only (Source: MoffettNathanson) |
||||
U.S. broadband ended 2021 with a penetration of 84% among all occupied households. According to US Census Bureau data, new household formation, a vital growth driver for broadband, added just 104,000 to the occupied housing stock in Q4 2021, versus +427,000 in the year-ago period. Moffett said the “inescapable conclusion” is that growth rates will continue to slow, and that over time virtually all growth will have to stem from new household formation.
Factoring in competition and other elements impacting the broadband market, MoffettNathanson also adjusted its subscriber forecasts for several cable operators and telcos out to 2026. Here’s how those adjustments, which do not include any potential incremental growth from participation in government subsidy programs, look like for 2022:
- Comcast: Adding 948,000 subs, versus prior forecast of +1.25 million
- Charter: Adding 958,000 subs, versus prior forecast of +1.22 million
- Cable One: Adding 39,000, versus prior forecast of +48,000
- Verizon: Adding 241,000, versus prior forecast of +302,000
- AT&T: Adding 136,000, versus prior forecast of +60,000
Are we witnessing a fiber bubble?
“The market’s embrace of long-dated fiber projects rests on four critical assumptions. First, that the cost-per-home to deploy fiber will remain low. Second, that fiber’s eventual penetration rates will be high. Third, that these penetration gains can be achieved even at relatively high ARPUs. And fourth, that the capital to fund these projects remains cheap and plentiful.
None of these assumptions are clear cut. For example, there is an obvious risk that all the jostling for fiber deployment labor and equipment will push labor and construction costs higher. More pointedly, we think there is a sorely underappreciated risk that the pool of attractive deployment geographies – sufficiently dense communities, preferably with aerial infrastructure – will be exhausted long before promised buildouts have been completed.
Revenue assumptions, too, demand scrutiny. Cable operators are increasingly relying on bundled discounts of broadband-plus-wireless to protect their market share. What if the strategy works, even a little bit? And curiously, the market’s infatuation with fiber overbuilds comes at a time when cable investors are growing increasingly cautious about the impact of fixed wireless. Won’t fixed wireless dent the prospects of new overbuilds just as much (or more) as those of the incumbents.”
Moffet estimates that about 30% of the U.S. population has been overbuilt by fiber over the past 20 years, and that the number is poised to rise as high as 60% over the next five years. But the big question is whether there’s enough labor and equipment to support this magnitude of expansion. “Our skepticism about the prospects for all of the fiber plans currently on the drawing board is not born of doubt that there is enough labor to build it all so much as it is that the cost of building will be driven higher by excess demand,” Moffett explained. “There are already widespread reports of labor shortages and attendant higher labor costs,” he added.
“The outlook for broadband growth for all the companies in our coverage, particularly the cable operators, is more uncertain than at any time in memory. IMarket share trends are also more uncertain that they have been in the past. Cable continues to take share from the telcos, but fixed wireless, as a new entrant, is now taking share from all players. Share shifts between the TelCos and cable operators are suppressed by low move rates, likely due in part to supply chain disruptions in the housing market. This is likely dampening cable growth rates. In at least some markets, returns will likely be well below the cost of capital,” Moffett forecasts.
References:
U.S. Broadband: Are We Witnessing a Fiber Bubble? MoffetNathanson research note (clients and accredited journalists)
Assessment of COVID-19 impact on telecom industry; C-Band Spectrum Update
COVID-19 Impact on Telcos:
Source: Analysys Mason
![]()
The telecommunications industry has suffered limited damage as a result of the COVID-19 pandemic. Revenue figures for most network operators have fallen slightly, but few have encountered anything that is particularly severe or long-lasting. As a result, few telcos have made significant changes to their strategy.
However, some aspects of the telecoms sector have been significantly affected by the pandemic. The most obvious is business services; revenue in this segment declined sharply for most operators in 2020 and prospects for 2021 are uncertain. Operators may have to rethink important parts of their strategies related to these aspects.
The telecoms industry has been affected by the pandemic in many different ways, and have been grouped these into three main categories depicted in the figure below:
Summary of the impact of the COVID-19 pandemic on the telecoms industry

Assumptions of a stable economy and a continuation of existing service and technology trends often underpin an operator’s strategic plan. For some of the services offered by operators, business services in particular, these assumptions look outdated and may need a rethink.
………………………………………………………………………………………………………………………………………………………………………………………..
C-Band Auction Update:
Source: MoffettNathanson Research
Heading into the FCC’s C-Band auction, Wall Street analysts saw Verizon as the leading bidder for 5G wireless radio spectrum. Bidding for licensed spectrum in the telecom industry’s most expensive auction ever reached more than $75 billion on Monday amid speculation over how much each of the big wireless telcos and cable companies have paid.
In a note to clients, analyst/colleague Craig Moffett of MoffettNathanson is assuming that Verizon will end up being the largest buyer at the ongoing auction of mid-band spectrum targeted for new 5G deployments. As a result, Verizon’s balance sheet will be more heavily burdened and more of their future cash flows will be diverted to debt service so their future profits will be lower.
AT&T, on the other hand, will “be disadvantaged for a generation” if they don’t get a significant chunk of the mid-band spectrum being auctioned. Craig believes that AT&T was probably “one of the two big bidders that more or less backed away after round 24 or round 38.”
An important issue is “whether “winners” in this auction acquired reasonably uniform contiguous blocks, or whether they instead (worst case scenario) ended up with a patchwork of licenses and a hefty bill to burden the balance sheet. If so, will their footprints be largely erased by subsequent topping bids from others.”
With respect to using the purchased mid-band spectrum for accelerated 5G deployments, Craig wrote: “At best, the huge sums paid here for spectrum risk displacing the capital investment needed to put the acquired spectrum to use. At worst, they risk financially destabilizing one or more players.”
In conclusion, Craig asks if the large amounts of money being spent for an asset (licensed mid-band spectrum) that is best thought of as simply maintaining the status quo will be worth the price paid? “Again, the most important question is this: is anyone going to change their revenue forecast just because the industry had to spend twice as much as expected to buy spectrum for 5G.”
………………………………………………………………………………………………………………………………………………………………………………………
References:
Mid-band Spectrum for 5G: FCC C-Band Auction at $70B Shattering Records
