

Uncategorized
IHS Markit: 2G, 3G and LTE hardware revenues -8% YoY; 5G ramping up
By Stéphane Téral, executive director, mobile infrastructure and carrier economics, IHS Markit
Highlights
- Total combined 2G, 3G, 4G and 5G infrastructure hardware revenues are forecast to bottom out at $49.7 billion in 2018, declining 8 percent over the previous year.
- Global 5G hardware revenue is expected to reach $19 billion in 2022, starting from a very low base of early adopters in the United States in the second half of 2018, followed by 5G rollouts in South Korea and massive 5G trials set for China in 2019.
IHS Markit analysis
After more than two decades of existence, the global mobile infrastructure hardware market – including all types of radio access network (RAN), switching and core equipment – has reached maturity. It now fluctuates between $31 billion and $48 billion annually, depending on macroeconomic cycles and shifts in technology generations. The 2G and 3G markets are both continuing to decline, as 4G reached maturity after its rollout peak in 2015. Today, 5G is on the imminent horizon, with the first rollouts occurring in the second half of 2018.
Fueled by LTE upgrades and the start of 5G rollouts in the third quarter of 2018, hardware revenue was stronger than it was the rest of the year. Continuing LTE activity in the US again propelled sequential double-digit growth in the North American market. There was also moderate activity in Europe and South Korea and other countries in Asia. In China, which has the world’s largest LTE footprint of 4 million E-UTRAN Node Bs (eNodeBs), the market dipped significantly again at the end of the first half of the year.
It’s still an LTE world, as we know it
LTE continues its penetration around the world, becoming even more ubiquitous globally. Although preparing existing LTE footprints for 5G upgrades is bringing much-needed fuel to the mobile infrastructure market, LTE deployment volume is far from its peak level as the number of LTE-upgradable mobile networks continues to diminish significantly. 5G is not expected to create a major investment spike any time soon, and mobile network operators are still struggling to deliver a compelling business case for 5G, even as LTE is delivering more 5G-like elements and services as it develops.
5G plans around the world
In order to leverage the LTE network, most service providers are starting their 5G rollouts with 5G non-standalone (NSA) New Radio (NR) technology, as follows:
- United States: AT&T’s and Verizon’s initial rollouts of 5G NSA NR 28 gigahertz (GHz) and 39 GHz for enhanced mobile broadband (eMBB) and fixed wireless access (FWA) use cases, respectively, have started as planned in the second half of 2018. Verizon launched its 5G FWA service in October, using its own 5G Technical Forum (5GTF) standard. Sprint is deploying 5G in its 2.6 GHz by implementing massive multiple-input multiple-output (MIMO) for eMBB services, while T-Mobile is targeting coverage with the 600 megahertz (MHz) spectrum band.
- South Korea: SK Telecom, LG U+ and KT recently turned on their 5G networks, beginning the launch of commercial 5G services in the country. The country’s three telecommunications companies [1] have already deployed a few thousand 5G NR units — LG U+ alone already has 4,000 in Seoul — and are gearing up for 5G eMBB commercial launch at 3.5 GHz and 28 GHz with NSA NR in the first quarter of 2019.
- China: The country is gearing up for its massive 5G trial in 2019 and has already started minor trials this year. China Unicom pledged to roll out more than 300 5G NRs. Trials will be conducted in six cities, to test 5G connectivity, coverage and mobility. China will increase 5G NR volumes very quickly, having so far shown little interest in 5G NSA NR.
- Japan: Moderate 5G rollouts are planned for 2019, to test the technology during the Rugby World Cup. The country will also showcase potential 5G services — 4.5 GHz and 28 GHz — during the 2020 Tokyo Olympics, followed by a commercial launch in 2021. A nationwide 5G launch is not expected until 2023.
- United Kingdom: EE, the leading mobile network in the UK and part of BT Group, is rolling out 5G, to switch on 5G sites in 16 cities in 2019.
Note 1. At yesterdays excellent SCWS Americas conference, Ki Seok Yang, Manager, Access Network Lab introduced SK Telecom’s in-building service in LTE: improving network quality and capacity in 5G which included an in building 5G repeater. After his talk he told me that SK Telecom and the two other South Korea wireless network operators have been coordinating and collaborating their 5G network specs and IMT 2020 RIT contributions. That will ensure there is a comov 5G spec implemented on all of Korea’s 5G networks, which is very much UNLIKE the U.S. where each carrier will have their own version of 5G, based on 3GPP NR non standalone (LTE Core network), Suc carrier collaboration might be inferred from the IEEE Techblog post titled South Korean Mobile Operators to Launch 5G Simultaneously on Korea 5G Day.
Mr. Yang sai that South Korea’s Telecommunications Technology Association (TTA) facilities that coordination and collaboration covers telecommunications, information technology, radio communications and broadcasting. The Association establishes industry standards and has been instrumental in creating the current Korean Information and Communication Standards. TTA also collaborates with international and national standards organizations, such as ITU and other organizations.
Mobile Infrastructure Market Tracker – Regional
The “Mobile Infrastructure Market Tracker” from IHS Markit provides quarterly data and analysis for the 2G, 3G, 4G and 5G mobile infrastructure market – including market size, vendor market share, forecasts and market trends.
Dell’Oro: 5G Mobile Backhaul + WDM equipment market grew 15% in 3Q-2018
- 5G MOBILE BACKHAUL ISN’T ALL FIBER:
Point-to-point microwave has a place in the future
Mobile radio technology is moving from 4G to 5G, but it cannot move in isolation. Operators learned this valuable lesson with the move to 4G. In particular, the transport layer, often referred to as mobile backhaul, became a network choke point at cell sites with upgraded 4G mobile radios and legacy backhaul systems. To avoid these past mistakes, operators are placing as much emphasis on the transport layer as they do on 5G mobile radios.
5G will need more backhaul capacity
One area of concern for operators planning their transport layer is determining whether the mobile backhaul network must shift away from wireless systems, such as point-to-point (PTP) microwave, to fiber-based systems, such as packet transport network (PTN) systems.
The main issue, of course, is not the cost of the equipment; it is the cost of either installing fiber, maintaining fiber (ex. fixing fiber breaks), or leasing fiber. One of the benefits of a wireless backhaul system is the freedom from incurring the high cost of owning a large fixed asset—a fiber plant.
The second issue is operators have already invested a large amount of resources (time and money) on the 4G backhaul network using a mix of fiber and wireless systems. We estimate that by the end of 2017, the percentage of macro cells using wireless backhaul systems was approximately 45%, so one can imagine the cost if all those cell sites have to be retrofitted with fiber links. The good news for the operators and major microwave vendors—Ceragon, Ericsson, Huawei, 5G mobile backhaul isn’t all fiber NEC, and Nokia—is that we do not think this will be the case. In fact, we think that 5G will bring back a growing demand for PTP microwave. In our latest study of mobile backhaul and microwave (July 2018), we assessed that operators have installed fiber and microwave backhaul capacities ranging from 50 Mbps to 500 Mbps in their 4G networks. Therefore, with a 500 Mbps backhaul link, a mobile phone user will likely experience a peak download speed ranging from 65 Mbps to 130 Mbps in a non-congested area, based on factors such as the distance from the antenna, number of antenna sectors, and spectrum. With a 50 Mbps backhaul link, the user peak download speeds should be about 1/10th of those values.
Is this capacity enough for 5G? Perhaps initially but it is unlikely for the long term. That being said, we also predict that only a few sites will be installed to operate at the maximum 5G advertised user download rate of 20 Gbps.
We think that in most cases, a 5G mobile radio network will double or triple the user download speed from what users have experienced with 4G. Research we have seen states that the average 4G user experiences only about 20 Mbps of download speed with the more developed countries such as Singapore and South Korea averaging closer to 50 Mbps. Therefore, if an operator aspires to triple this download speed, a cell site with six sectors would likely require no more than about 1 Gbps of backhaul capacity, which can be accomplished with PTP microwave. The latest microwave systems operating in E-band (70/80 GHz) have 10 Gbps of link capacity over a single carrier and 20 Gbps over dual carriers. Hence, the use of wireless backhaul systems becomes a point of congestion only when the backhaul link capacity requirement exceeds 20 Gbps, which can provide a user download speed exceeding 2.5 Gbps. Simply stated, PTP microwave will meet the capacity demands of most 5G macro cell sites for many years to come, and operators that want to stay with wireless backhaul over fiber can continue to do so with 5G.
https://www.telecomasia.net/system/files/story/file_attachments/5GInsights_1118_digital.pdf
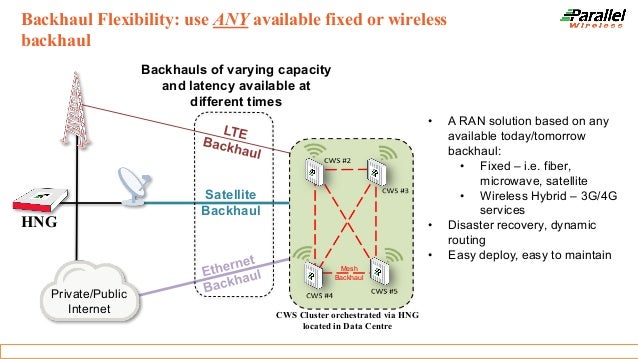
Editor’s Note: We were told today at the SCWS Americas conference in Santa Clara, CA.. that 5G backhaul could be 5G itself, microwave or (more likely) fiber. It all depends on densification of the network, e.g. number of small/macro cells within a given geographical area.

…………………………………………………………………………………………………..
- The optical transport WDM equipment market grew 15% year-over-year in the third quarter, according to a report by Dell’Oro Group.
The majority of the optical transport WDM equipment growth occurred in the Asia Pacific region, according to the report. In the third quarter, coherent wavelength shipments increased 30%.
Service providers are replacing legacy gear to accommodate the growth of higher speed fixed broadband and data center interconnection, which has, for the most part, driven up WDM equipment shipments.
Shipments of 100 Gbps wavelengths increased by nearly 15% year-over-year while shipments of 200 Gbps and higher wavelengths more than doubled over the same time frame. Over the past few years, service providers have been migrating from 100 Gbps to 200 and 400 Gbps.
The top third-quarter manufacturers of WDM systems on a revenue basis were Huawei, Ciena, ZTE, and Nokia.
“The Optical market outperformed in the third quarter,” said Jimmy Yu, Vice President at Dell’Oro Group. “All of the growth was driven by rising demand for coherent wavelengths in metro and long haul WDM systems. Shipment of 100 Gbps wavelengths continued to rise, but it was a newer, higher speed wavelengths operating at 200 Gbps that truly moved the market revenue higher,” added Yu.
Additional highlights from the 3Q 2018 Optical Transport Quarterly Report:
- Majority of optical transport WDM equipment revenue growth occurred in the Asia Pacific region.
- Lead manufacturers of WDM systems on a revenue basis were Huawei, Ciena, ZTE, and Nokia.
- Shipment of 100 Gbps wavelengths grew nearly 15 percent year-over-year.
- Shipment of 200+ Gbps wavelengths (speeds higher than 100 Gbps) more than doubled year-over-year.
The Dell’Oro Group Optical Transport Quarterly Report offers complete, in-depth coverage of the market with tables covering manufacturers’ revenue, average selling prices, unit shipments (by speed including 40 Gbps, 100 Gbps, 200 Gbps, and 400 Gbps). The report tracks DWDM long haul terrestrial, WDM metro, multiservice multiplexers (SONET/SDH), optical switch, optical packet platforms, and data center interconnect (metro and long haul).
To purchase this report, please contact us at [email protected]
Optical Transport WDM Equipment Market Grew 15 Percent in 3Q 2018, According to Dell’Oro Group
ETTelecom survey: Challenges to 5G adoption in India
Availability of an inadequate ecosystem — spectrum and handsets – along with the financial burden on Indian telecom operators will prove to be the major challenges to adoption of 5G technology in the country, an ETTelecom 5G survey findings revealed.
A large portion of respondents believes that India will be ready to launch the technology commercially before 2022. However, 50% of the respondents who work at a telecom equipment vendor firms such as Nokia, Ericsson believe that 5G will be deployed during 2020.
About 80% executives from the industry further hold the view that 5G could account for more than 10% of operator revenues by 2023.
A large proportion of the respondents believe that an inadequate ecosystem in terms of spectrum and handsets (69%) and the financial burden on MNOs (68%) are the major challenges to 5G adoption in India. Moreover, 89% of the respondents working at C-level roles believe the financial burden on telcos be a major challenge.
Some respondents mentioned that lack of fiber for backhaul, and passive infrastructure such as towers and optical fiber cable will be some major challenges for telcos in India.
ETTelecom published a report on 5G evolution and roadmap in India in collaboration with Analysys Mason which showed that smart cities (70%) and high-speed broadband at home (69%) are the most relevant use cases of 5G in India.
Respondents working at telecom equipment vendors believed high-speed broadband at home to be the most relevant use case with 85% responding positively. Smart cities are the most relevant use case according to respondents currently working at telcos such as Airtel, Vodafone, Idea, Reliance Jio etc. with 78% mentioning it as a relevant use case.
The respondents also believe that smart manufacturing, smart home and cloud, AR/VR are also relevant to the Indian market.
Media and Entertainment driven by higher throughput on mobile broadband is believed to be the industry that will benefit the most from 5G and drive adoption with a large majority of the respondents (83%) believing so. Healthcare (64%) and automotive (60%) are other industries which the respondents feel will benefit from 5G and drive its adoption.
When it comes to industry’s expectations on the key spectrum bands for 5G, there is a mixed sentiment with no clear spectrum band getting more than 50% positive response. However, 67% of the respondents working at C-level positions expect the sub-1GHz band to be the preferred for 5G deployment.
68% of the respondents feel that fibre backhaul is the most important technology, which could be crucial towards deployment of 5G. Ultra-dense network of small cells (50%) and massive MIMO (48%) are other technologies that respondents believe could be crucial.
Also, 82% of the respondents working with Indian telcos believe fibre backhaul to be a crucial technology and 85% of those working at telecom equipment vendors believe the same.
53% of the respondents suggested that legacy technologies such as 2G and 3G could still co-exist with 4G and 5G by 2025, while 40% believe they will be replaced. However, 67% of the C-level respondents believe legacy technologies will be replaced and, on the other hand several users also point out that while 3G will be replaced, 2G will continue to co-exist.
A clear majority with 73% responses suggested that the initial rollout of 5G would be limited to urban pockets. Additionally, 59% of the respondents believe that 5G could cannibalize fixed broadband in India if it can offer high-speed broadband.
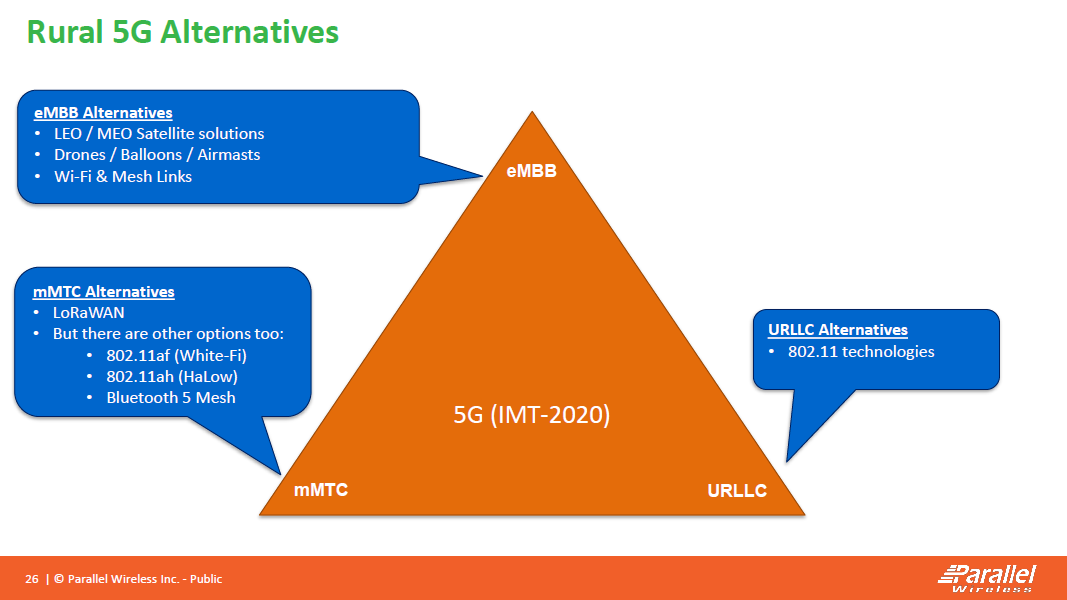
What about rural 5G which is needed in India?
For more insights, download ETTelecom-Analysys Mason’s 5G readiness in India report.
5G Network and Smartphone Update: AT&T Verizon and Qualcomm
AT&T is sticking to its “end of the year” 5G commercial deployment schedule, but no smartphones or tablets will be available at that time. AT&T plans to have 5G available in parts of 12 markets up by the end of the year. AT&T Communications CEO John Donovan. said AT&T’s 5G is expected to move into 19 cities (so far) in 2019. AT&T has told Light Reading that it has 5G sites live in Dallas and Waco, Texas now. But the operator has not yet launched its commercial 5G service.
The only confirmed 5G device announced for AT&T’s mobile 5G network is the Netgear Nighthawk 5G Mobile Hotspot, which AT&T calls a “puck.”
:no_upscale()/cdn.vox-cdn.com/uploads/chorus_asset/file/13592246/Nighthawk_5G_Hotspot_crop.jpg)
:no_upscale()/cdn.vox-cdn.com/uploads/chorus_asset/file/11914977/IMG_20180802_150637.jpg)
…………………………………………………………………………………………………………………………………………………………………………
“We believe the early 5G opportunities are going to be in enterprise,” Donovan said. He noted that AT&T’s work with Samsung Corp. on“robotic manufacturing” and augmented reality with Magic Leap Inc. will be future 5G enterprise offerings. 5G smartphones will be available in 2019, according to Donovan.
According to The Verge, Verizon will technically have a phone when it launches its mobile 5G offering in early 2019. If you buy the existing, Verizon-exclusive Moto Z3 which is advertised as “5G ready.” Verizon says its first 5G device will be a magnetic, modular 5G Moto Mod attachment you can snap onto that phone to add speedy 5G NR (3GPP Release 15) connectivity.
AT&T and Verizon both say they’re exclusively rolling out millimeter wave (mmWave) radios, which inherently provide far more bandwidth and capacity than today’s networks. But at 39GHz and 28GHz, those millimeter wave signals also don’t travel as far or penetrate buildings as easily as conventional cellular. That means you’ll probably drop down to LTE speeds when you transition indoors, and in order to cover the same area as today’s LTE cell towers, carriers will need to provide many more smaller cell sites. AT&T says it’s focusing on outdoor cells first, but is also looking at indoor ones for public venues like stadiums and concert halls.
……………………………………………………………………………………………………………………………………………………………………………
Qualcomm president Cristiano Amon expects the first real wave of 5G smartphones to arrive in Q2 2019 at the earliest. ”We are working, so as early as the second quarter of 2019, you’ll have smartphones being launched across the United States, across Europe, across South Korea, Australia. Some early in the quarter, some later in the quarter… they’re all going to be Android flagship devices,” says Amon. “You go to CES [in January], you’ll start to see a lot of phone announcements; you go to MWC [in February], you’ll see a lot of actual phone launches.”
Author’s Note: Don’t expect a 5G smartphone from Apple till 2020 at the earliest. The company is closely tracking the REAL 5G standard- ITU-R IMT 2020 which won’t be completed till year end 2020. Companion IMT 2020 standards from ITU-T won’t be finalized till 2021 or later.
………………………………………………………………………………………………………………………………………………………………………………………………
“We need to build a crescendo,” says Amon. “You’re not going to change your phone unless the battery life is higher, the form factor is attractive, and you need companies that can actually deliver the performance,” he added.
“Today you stream music everywhere. You don’t download music anymore; even if you have low coverage, you have enough quality to stream music. 5G will do that for video,” Amon says, before moving on to fancier, further-out predictions like unlimited storage and on-demand processing power from the cloud that can, he imagines, virtually cram the power of a Magic Leap-like augmented reality headset into a normal pair of glasses.”
The Verge says that Qualcomm will announce a new Snapdragon processor at its third annual Snapdragon Technology Summit next week in Maui. It is targeted at 5G NR smartphones. A “Snapdragon 1000” processor for a new wave of always-connected Windows laptops will also be introduced at the summit.
5G Network and Smartphone Update: AT&T Verizon and Qualcomm
AT&T is sticking to its “end of the year” 5G commercial deployment schedule, but no smartphones or tablets will be available at that time. AT&T plans to have 5G available in parts of 12 markets up by the end of the year. AT&T Communications CEO John Donovan. said AT&T’s 5G is expected to move into 19 cities (so far) in 2019. AT&T has told Light Reading that it has 5G sites live in Dallas and Waco, Texas now. But the operator has not yet launched its commercial 5G service.
The only confirmed 5G device announced for AT&T’s mobile 5G network is the Netgear Nighthawk 5G Mobile Hotspot, which AT&T calls a “puck.”
…………………………………………………………………………………………………………………………………………………………………………
“We believe the early 5G opportunities are going to be in enterprise,” Donovan said. He noted that AT&T’s work with Samsung Corp. on“robotic manufacturing” and augmented reality with Magic Leap Inc. will be future 5G enterprise offerings. 5G smartphones will be available in 2019, according to Donovan.
According to The Verge, Verizon will technically have a phone when it launches its mobile 5G offering in early 2019. If you buy the existing, Verizon-exclusive Moto Z3 which is advertised as “5G ready.” Verizon says its first 5G device will be a magnetic, modular 5G Moto Mod attachment you can snap onto that phone to add speedy 5G NR (3GPP Release 15) connectivity.
AT&T and Verizon both say they’re exclusively rolling out millimeter wave (mmWave) radios, which inherently provide far more bandwidth and capacity than today’s networks. But at 39GHz and 28GHz, those millimeter wave signals also don’t travel as far or penetrate buildings as easily as conventional cellular. That means you’ll probably drop down to LTE speeds when you transition indoors, and in order to cover the same area as today’s LTE cell towers, carriers will need to provide many more smaller cell sites. AT&T says it’s focusing on outdoor cells first, but is also looking at indoor ones for public venues like stadiums and concert halls.
……………………………………………………………………………………………………………………………………………………………………………
Qualcomm president Cristiano Amon expects the first real wave of 5G smartphones to arrive in Q2 2019 at the earliest. ”We are working, so as early as the second quarter of 2019, you’ll have smartphones being launched across the United States, across Europe, across South Korea, Australia. Some early in the quarter, some later in the quarter… they’re all going to be Android flagship devices,” says Amon. “You go to CES [in January], you’ll start to see a lot of phone announcements; you go to MWC [in February], you’ll see a lot of actual phone launches.”
Author’s Note: Don’t expect a 5G smartphone from Apple till 2020 at the earliest. The company is closely tracking the REAL 5G standard- ITU-R IMT 2020 which won’t be completed till year end 2020. Companion IMT 2020 standards from ITU-T won’t be finalized till 2021 or later.
………………………………………………………………………………………………………………………………………………………………………………………………
“We need to build a crescendo,” says Amon. “You’re not going to change your phone unless the battery life is higher, the form factor is attractive, and you need companies that can actually deliver the performance,” he added.
“Today you stream music everywhere. You don’t download music anymore; even if you have low coverage, you have enough quality to stream music. 5G will do that for video,” Amon says, before moving on to fancier, further-out predictions like unlimited storage and on-demand processing power from the cloud that can, he imagines, virtually cram the power of a Magic Leap-like augmented reality headset into a normal pair of glasses.”
The Verge says that Qualcomm will announce a new Snapdragon processor at its third annual Snapdragon Technology Summit next week in Maui. It is targeted at 5G NR smartphones. A “Snapdragon 1000” processor for a new wave of always-connected Windows laptops will also be introduced at the summit.
Oracle Confirms Research: China Telecom Misdirected U.S. Internet traffic thru China
China Telecom is the largest fixed line operator in China, state owned, and bidding to become the third telecommunications network operator in the Philippines. Two weeks ago, researchers found that the company has been hacking into internet networks in the United States and hijacking data from countless users, a study has found.
The research, conducted jointly by scholars from the US Naval War College and Tel Aviv University, discovered that the China government, acting through China Telecom, has been engaged in data hacking even though it had entered into a pact with the U.S. in 2015 to stop cyber operations aimed at intellectual property theft.
Oracle’s Internet Intelligence division has just confirmed the findings of the academic paper published two weeks ago that accused China of “hijacking the vital internet backbone of western countries.”
Doug Madory, Director of Oracle’s Internet Analysis division (formerly Dyn), confirmed that China Telecom has, indeed, engaged in internet traffic “misdirection.” “I don’t intend to address the paper’s claims around the motivations of these actions,” said Madori. “However, there is truth to the assertion that China Telecom (whether intentionally or not) has misdirected internet traffic (including out of the United States) in recent years. I know because I expended a great deal of effort to stop it in 2017,” Madori said.

Image Courtesy of Oracle
……………………………………………………………………………………………………………….
Madori then goes on to detail several of China Telecom’s BGP (Border Gateway Protocol) route “misdirections,” most of which have involved hijacking US-to-US traffic and sending it via mainland China before returning it to the U.S.
Verizon APAC errors had a knock-on effect, Madori explained: “Verizon APAC … were announcing [routes] to the internet on behalf of their customers. A couple of AS hops away, China Telecom was mishandling them – announcing them in a manner that would cause internet traffic destined for those IP address ranges to flow back through China Telecom’s network.”
………………………………………………………………………………………………………………………………..
Indeed, the researchers found that China Telecom uses BGPs in order to carry out their data intrusions. Created in the early 1980s, BGP protocols do not feature any security controls, often resulting in misdirected traffic through “bad BGPs”. The majority of these cases are attributed to configuration mistakes.
However, researchers found that China Telecom has been deliberately hijacking BGP routes to send legitimate traffic through malicious servers.
They described the state-owned telco as “one of the most determined BGP hijackers in the international community.”
In order to validate their findings, the researchers built a route tracing system to monitor BGP announcements, allowing them to distinguish between normal, accidental patterns and deliberate ones.
They concluded that China Telecom was responsible for patterns of BGP behavior that “suggest malicious intent, precisely because of their unusual transit characteristics -namely the lengthened routes and the abnormal durations.”
“[China Telecom] has already relatively seamlessly hijacked the domestic US and cross-US traffic and redirected it to China over days, weeks, and months,” the researchers said.
“The prevalence of and demonstrated ease with which one can simply redirect and copy data by controlling key transit nodes buried in a nation’s infrastructure requires an urgent policy response,” they warned.
………………………………………………………………………………………………………………………………………….
The routing snafu involving domestic US Internet traffic coincided with a larger misdirection that started in late 2015 and lasted for about two and a half years, Oracle’s Madory said in a blog post published Monday. The misdirection was the result of AS4134, the autonomous system belonging to China Telecom, incorrectly handling the routing announcements of AS703, Verizon’s Asia-Pacific AS. The mishandled routing announcements caused several international carriers—including Telia’s AS1299, Tata’s AS6453, GTT’s AS3257, and Vodafone’s AS1273—to send data destined for Verizon Asia-Pacific through China Telecom, rather than using the normal multinational telecoms.
………………………………………………………………………………………………………………………………………….
Ahead of the third telco player’s selection Wednesday (November 7), Senators Grace Poe and Francis Escudero already voiced concerns about the possible threats to national security and data privacy in case China Telecom becomes the winner of the bidding.
………………………………………………………………………………………………………………………………………….
References:
https://internetintel.oracle.com/blog-single.html?id=China+Telecom%27s+Internet+Traffic+Misdirection
https://www.zdnet.com/article/oracle-confirms-china-telecom-internet-traffic-misdirections/
AT&T exec: SD-WAN is “killer app” after MEF says they will define SD-WAN service
AT&T’s Josh Goodell at MEF 18 conference in LA: “SD-WAN is the killer app — we’re deploying 28,000 end points, it has really exploded.” Really? We’re from Missouri= show me
Meanwhile, the MEF has definesd an SD-WAN service and its various attributes. With strong support from service provider and technology provider members, MEF currently is on track to ratify and publicly release its MEF 3.0 SD-WAN Service Attributes and Service Definition standard in 1Q 2019. SD-WAN service standardization will enable a wide range of ecosystem stakeholders to use the same terminology when buying, selling, assessing, deploying, and delivering SD-WAN services. The SD-WAN service definition is a foundational step for accelerating sales, market adoption, and certification of MEF 3.0 SD-WAN services orchestrated across a global ecosystem of automated networks.
SD-WAN Service Standardization
SD-WAN service standardization is being conducted within the context of the MEF 3.0 Global Services Framework. It is part of a transformational initiative to standardize a complete family of dynamic Carrier Ethernet (CE), IP, Optical Transport, SD-WAN, security, and other virtualized services that will be orchestrated over programmable networks using LSO (Lifecycle Service Orchestration) APIs.
MEF’s SD-WAN service definition specification describes requirements for an application-aware, over-the-top WAN connectivity service that uses policies to determine how application flows are forwarded over multiple underlay networks irrespective of the underlying technologies.
“MEF’s groundbreaking work in standardizing an SD-WAN service addresses one of the biggest obstacles impacting SD-WAN service market growth,” said Nan Chen, President, MEF. “In a recent joint MEF and Vertical Systems Group survey of service providers worldwide, nearly 80% of respondents identified the lack of an industry-standard service definition as a significant challenge for service providers to offer or migrate to SD-WAN services. MEF’s SD-WAN service standardization will undoubtedly accelerate sales of SD-WAN products and services like MEF accomplished with Carrier Ethernet service standardization.”
Just as the industry has benefited from MEF standardization of CE services – which now exceed an estimated $50 billion in annual revenues globally – there are numerous potential benefits associated with a common SD-WAN service definition. These include, among other things:
- Reducing market confusion about service components, core capabilities, and related concepts, thus saving valuable time given the scarce availability of skilled personnel.
- Enabling service providers and technology providers to focus on providing a core set of common capabilities and then building on that core resulting in differentiated offerings.
- Facilitating inclusion of SD-WAN services in standardized LSO architectures, thereby advancing efforts to orchestrate MEF 3.0 SD-WAN services across multiple providers.
- Paving the way for creation and implementation of SD-WAN services certification, which will give users confidence that a service meets a fundamental set of requirements.
SD-WAN Implementation
MEF member companies are involved in multiple SD-WAN implementation-related initiatives that can be leveraged to provide feedback on standardization requirements and create software-oriented artifacts that can be used to accelerate efforts to orchestrate standardized SD-WAN services. These initiatives include the MEF 3.0 Multi-Vendor SD-WAN Implementation project, the MEF18 LSO Hackathon, and several SD-WAN Proof of Concept (PoC) demonstrations at MEF18.
The MEF18 LSO Hackathon is focused on developing and validating data models for SD-WAN services. This presents a unique opportunity for those involved in technical aspects of SD-WAN services and products to learn in a hands-on way about the latest SD-WAN service and LSO standardization work at MEF as well as the related API and YANG work at ONF and IETF.
Three MEF18 PoC demonstrations directly related to LSO-enabled orchestration of SD-WAN services include:
- Zero Touch Services with Secure SD-WAN
- Towards a Multi-Vendor Orchestrated SD-WAN – LSO-enabled Solution with Open Source Orchestrator and Container-based uCPEs
- Instantiation and Delivery of SD-WAN over a Virtualized and Orchestrated Wholesale Carrier Ethernet Access Service.
MEF 3.0 SD-WAN Service Certification
MEF currently plans to introduce a pilot version of certification for MEF 3.0 SD-WAN services in the first half of 2019. This certification will test a set of service attributes and their behaviors defined in the upcoming SD-WAN standard and described in detail in the MEF 3.0 SD-WAN Service Certification Blueprint.
…………………………………………………………………………………………..
References:
…………………………………………………………………………………
Cisco Virtual Networking Index report: Enterprise SD-WAN growth will increase five-fold by 2022:
Should Web Giants Partner with Telcos to bring Broadband to 3rd World?
Facebook along with Indian telecom giant Bharti Airtel Ltd.’s Ugandan unit and Mauritius-based Bandwidth & Cloud Services Group, has deployed nearly 500 miles of fiber-optic cable across the isolated northwest of Uganda. The project, begun in early 2017 and completed at the end of last year, has expanded the region’s network capacity, providing faster internet access to an area with some three million people, many of whom live in towns still haunted by memories of the three-decade insurgency led by Joseph Kony’s Lord’s Resistance Army.
The Ugandan cable is the largest terrestrial network Facebook has helped construct in Africa and part of what the company describes as a broader push to connect the approximately 3.8 billion people who are still without internet around the world.
The move comes as Facebook’s user growth slows in developed markets like the U.S. and Europe. The social media giant’s presence on the continent remains small compared with other regions, but the Menlo Park, Calif.–based company said its strategy to get more people onto a faster and more robust internet will plug more of sub-Saharan Africa into the global economy.
Indeed, the summer of 2018 brought different fortunes to attempts by Facebook and Google to offer broadband services using high-flying drones and balloons (atmospheric satellites) to the unserved in remote rural areas.
GlobalData, a data and analytics company, feels that webscale giants need to partner with telcos globally to address the affordability challenge of reaching out to the unconnected in rural markets with atmospheric satellites.
Atmospheric satellites fit in the space between true satellites commonly used for communications and ground-based networks. Their theoretical advantage over satellites is much lower cost. Launching a balloon or a drone and equipping it with a radio base station represents a much cheaper way of covering large swaths of land. Considering one-third of the world population remains unconnected, the lower costs associated with balloon- or drone-based coverage is compelling.
However in June 2018, following several setbacks over a period of four years, Facebook abandoned developing its own high-flying solar-powered drones (Aquila project) for delivering Internet. However, the California-based social media giant said that it will focus on working with partners like Airbus on high altitude platform station (HAPS) system, which is capable of beaming down high-speed Internet to the unserved in 3rd world countries.
On the other hand Alphabet, the parent company of Google, turned its Loon balloon project into an independent company and announced its first commercial project with partly-state owned Telkom Kenya in July 2018. The partners plan to launch balloon-based 4G/LTE services commercially to parts of central Kenya, starting from 2019.

Alphabet’s Project Loon uses helium balloons to bring internet access to remote locations
…………………………………………………………………………………………………………………………………………….
Google used Project Loon in Puerto Rico last year after two hurricanes destroyed much of the telecom infrastructure on the island. Project Loon’s pilot deployment with Telkom Kenya may provide the clearest test of whether atmospheric satellites can really work. This puts pressure on Loon to demonstrate it has a viable technology.
Emir Halilovic, Telecom Technology and Software Analyst at GlobalData, said:
“Things get more complicated when the practical challenges of covering the unconnected masses with drone- or balloon-based mobile signals are considered. For starters, the potential customers for services provided from atmospheric satellites are not concentrated in one part of the world; rather, they are spread across remote, rural, or tribal areas, in many different countries and continents.”
Truly addressing this group would require the participation of multiple operators in dozens of countries. Moreover, most of the unconnected usually do not live outside areas where they can get mobile service; they just cannot afford a mobile plan. Drones and balloons do little to address the ’affordability’ challenge.
Halilovic concludes:
“Still, there are reasons to continue to pursue atmospheric satellites to provide coverage to the underserved rural communities, which could use internet connection to improve access to medical services in isolated locations, for example. Another use case for atmospheric satellites is quick restoration of communication services in natural disasters. Telcos should therefore continue to test atmospheric satellites to support development of such services.”
Critics say Facebook’s ventures into less-developed markets could undermine net neutrality by channeling traffic to its own platform and away from competitors. An earlier effort by Facebook to expand internet access in the developing world faltered in 2016, when India’s telecommunications regulator effectively banned the company from offering free access to a low-data version of Facebook and selected websites and apps. Governments across Africa—including in Uganda—are rolling back internet freedoms and cracking down on social media.
Facebook, which declined to comment on the cost of the Ugandan cable, says its Africa strategy is a long-term effort. Analysts say the lack of connectivity on the continent is a central impediment to increasing economic growth: Removing barriers to commerce and trade should create more opportunities for consumers to spend.
“It’s not a philanthropic venture. It’s a strategic investment with a long-term goal,” said Ebele Okobi, Facebook’s director of Africa public policy. “We see this as an enabler of our business, not as a way to gain advantages.”
Dexter Thillien, a London-based analyst with Fitch Solutions, said Facebook, conscious of the risks, is still testing the waters in Africa. “It’s where they can make the least money, at least right now,” he said.
The word “Africa” appears just once in Facebook’s 2017 annual report, to inform readers that the continent is included, along with the Middle East and Latin America, under its “Rest of World” designation.
Since the fiber rollout, Airtel Uganda has installed 33 new telecom towers in northern Uganda, while 71 towers have been upgraded to 3G and another 43 towers now beam 4G, which improves users’ ability to download and stream quickly, the company said. Previously, most places in the region had 2G or no service at all—a far cry from developed economies, which are racing to roll out 5G networks. More than half of Africa’s mobile broadband connections remain 2G (which AT&T has discontinued in the U.S.).
“That cable is fast for internet. That means communications will be much easier,” said Patricia Akello, project manager for Youth Alive, a Gulu-based provider of youth HIV counseling and testing. “Internet has become a necessity: Allowing young people access will educate them. They’ll be better able to prevent HIV…and they can be educators to others in the community.”
Meanwhile, telcos like AT&T are testing drones to act as temporary cell sites after a disaster, Inside Towers reported. BAE Systems’ PHASA-35 could bring internet access to the most remote corners of the world, Martin Topping, delivery director at BAE Systems said: “Essentially any payload that can fit within the capacity can be put inside it. That could be 5G and 6G communications, border surveillance, agriculture and forestry, famine relief – it’s infinite. The vehicle is the carrier – the transit van. Spying is quite a niche usage.”
References:
https://www.wsj.com/articles/facebook-pushes-into-africa-1539000000
Huawei launches “5G Power Solution” for global wireless telcos
Huawei has launched what it says is the industry’s first full-range 5G power solutions for wireless network operators which will address an expected 100% increase in 5G energy consumption when compared to 4G power dissipation.
The 5G Power series of products are designed to deliver an end-to-end, scalable energy solution for both newly built and upgradeable cell sites.
It has been designed utilizing technology including peak shaving, linked voltage boosting and energy slicing to provide a ‘one site one cabinet’ design.
Huawei said its research suggests that more than 70% of cell sites will face challenges such as insufficient power, battery and distribution capacity, and more than 30% of sites need grid modernization to match the power demands of 5G. Its solution has been designed to help network operators reduce capex and opex while improving energy reliability to meet the high reliability and low latency requirements of future mobile applications.
Huawei launched 5G Power series solutions to ensure that energy evolution is simpler, more reliable and more efficient in the 5G network process. Huawei believes that site synergy, network synergy, business synergy will be the direction for telecom energy in the future.
From its press release (reference below):
With the design concept of ‘one site, one cabinet’ and ‘one band, one blade power,’ Huawei’s new Power Solution adopts innovative technology of peak shaving, linked voltage boosting and energy slicing, and fully considers the capacity expansion of cooling and battery backup. Facing the capacity expansion requirement in the future, Huawei Power Solution enables carriers to avoid energy modernization and get 5G network overlaid quickly.
“Based on our deep understanding of pain points carriers are facing in the progress of network evolving, Huawei 5G Power Solution achieve end-to-end synergy from wireless network to telecom energy, which will further enable carriers to build networks quickly, reduce site energy consumption, and maximize their investment value,” Huawei president of telecom energy Tao Hongming said.
“As a telecom energy supplier who is able to provide end-to-end ICT solutions, Huawei is willing to work with carriers and industry partners on continuous innovation and exploration, and jointly solve the energy challenges in 5G era,” Tao added.
https://www.huawei.com/en/press-events/news/2018/10/huawei-first-5g-power-solution
3 Network Equipment Vendors Spin Off Video Units
Decisions by Cisco, Ericsson and Nokia to spin off video technology units represent an attempt to better compete with nimble startups, analysts say.
It’s indicative of transition in a competitive, confusing sector that provides myriad services to the consumer video market – from encryption to caching to streaming to storage.
“There are so many companies out there chasing too few dollars,” said London-based media and technology analyst Paolo Pescatore, noting “hundreds” of them at the latest NAB (National Association of Broadcasters) meeting occupying the entire upper South Hall. Many are small. To stand out, they advertise, but don’t always deliver on the hottest trends, from Artificial Intelligence to Blockchain.
“Now, everyone does Blockchain. But are they genuinely doing it? Are they genuinely doing Big Data? For many [customers], trying to work with them is tough,” he said. “There needs to be a reality check across the board.”
There is, and it started at the top for three big players whose corporate parents have not seen adequate returns. Executives at the new standalone companies—Synamedia (spun up from Cisco’s Service Provider Video Solutions business), Mediakind (the new Ericsson media solutions) and Velocix (the result of Nokia selling off its IP Video business)—insist that operating independently is key to performing better.
“As a private, independent company, Synamedia will live and breathe video and that single focus will benefit us and our customers,” said Yves Padrines, incoming CEO of Synamedia.
Cisco agreed to sell its Service Provider Video Software Solutions unit to U.K. private equity firm Permira in May for a reported $1 billion in a deal expected to close by early next year. Rebranded as Synamedia, it includes Cisco’s Infinite Video Platform, cloud digital video recording, video processing, video security, video middleware and other services. Many of the businesses were originally part of NDS, a video and security specialist Cisco acquired in 2012 for $5 billion.
Cisco will retain some video technology for networking like WebEx, which facilitates video and web conferencing, webinars, and screen sharing.
Padrines has three priorities: integrating broadband and broadcast so pay-TV operators can embrace IP and OTT; helping customers secure revenue through piracy prevention, rapid detection and response; and using data on viewer behavior and content to help clients generate fresh revenue through targeted advertising.
He said Synamedia’s “thousands” of employees worldwide will prioritize R&D and developing local solutions for local markets. London is the headquarters with staff in the U.S., Canada, the U.K., Belgium, Israel, India and China.
Cisco’s move followed Ericsson’s decision last January to sell a majority stake in its Media Solutions division to private equity firm One Equity Partners. The unit also got a snappier name, MediaKind, in July and a coming-out party at IBC last month. The deal hasn’t closed yet either as MediaKind carefully decouples from its parent company, market by market, said Arun Bhikshesvaran, chief marketing officer.
He said MediaKind staffers were in 120 of the 140 countries where Ericsson has “legal entities,” which the spinoff couldn’t replicate. In a complex process, the group narrowed the number of its legal entities to about 30 worldwide, with staffers reporting in from other areas.
“We had to figure out how to work in an agile manner, like a startup, but not [being] a startup,” Bhikshesvaran said. “What we consciously decided to do is to do this right from the beginning instead of creating an entity and fixing it later.” MediaKind will launch with 1,700 employees.
Bhikshesvaran said the relationship with Ericsson—which is retaining a hefty 49% interest in the business—will preserve the companies’ “combined heritage of video and mobility.”
Nokia is keeping an unspecified but smaller minority stake in Velocix. Cisco is selling Synamedia outright.
MediaKind, based in Plano, Texas, will be melding its businesses and focusing on R&D to address shifts in the media sector. Over the years, it has invested heavily in a collection of media properties, including Apex, Azuki Systems, Envivio, Fabrix, HyCGroup, Microsoft Mediaroom and Tandberg Television, but has acknowledged it did a poor job integrating them.
Bhikshesvaran described the current transition in the industry in part as moving to standalone software that can run on different kinds of commercial hardware, and helping clients migrate to the Cloud. MediaKind recently unveiled MediaKind Universe and announced a handful of global contracts with CogecoConnexion, Digicel, TotalPlay and TangerineGlobal.
Nokia’s IP video business, Velocix, the smallest of the three with about 300 employees, was sold in September to Volaris in a deal that will close by year end. It was the first media acquisition by the Toronto-based software company.
Nokia remains a Global Channel Partner for Velocix, which is focused on video and IP delivery and on storage technology. Velocix chief, Paul Larbey, said a core mission is to continue its work to make streaming video as smooth as broadcast.
He’s upbeat about shifts in the media industry, which he said have boosted business over the past six months. The group has added 12 new customers and increased traffic.
“Operators are starting to invest in new services—moving from analysis into the implementation phase,” he said. “There’s a nice head of steam in the development of product devices and services.”
As a standalone entity, Velocix can better hone its operations and sales. “Video is very specialized. It has a very technically oriented sales cycle. So being part of a big company” is not ideal, he said.
Larbey called Volaris “a nice, stable home,” noting that private equity firms like the ones that acquired Velocix’ larger rivals generally seek an exit in 3 to 5 years through an IPO or sale. Volaris is looking to expand and will be a buyer of assets, he predicted. The industry is still in flux, said Pescatore, but it could be worse.
“You would be worried if they [parent companies] had written them off and closed these businesses. But private investors have come in and believe they can make a success where the giants have failed,” he said.
https://www.fiercevideo.com/video/big-spinoffs-by-cisco-ericsson-and-nokia-redraw-media-tech-sector
