

AT&T exec: SD-WAN is “killer app” after MEF says they will define SD-WAN service
AT&T’s Josh Goodell at MEF 18 conference in LA: “SD-WAN is the killer app — we’re deploying 28,000 end points, it has really exploded.” Really? We’re from Missouri= show me
Meanwhile, the MEF has definesd an SD-WAN service and its various attributes. With strong support from service provider and technology provider members, MEF currently is on track to ratify and publicly release its MEF 3.0 SD-WAN Service Attributes and Service Definition standard in 1Q 2019. SD-WAN service standardization will enable a wide range of ecosystem stakeholders to use the same terminology when buying, selling, assessing, deploying, and delivering SD-WAN services. The SD-WAN service definition is a foundational step for accelerating sales, market adoption, and certification of MEF 3.0 SD-WAN services orchestrated across a global ecosystem of automated networks.
SD-WAN Service Standardization
SD-WAN service standardization is being conducted within the context of the MEF 3.0 Global Services Framework. It is part of a transformational initiative to standardize a complete family of dynamic Carrier Ethernet (CE), IP, Optical Transport, SD-WAN, security, and other virtualized services that will be orchestrated over programmable networks using LSO (Lifecycle Service Orchestration) APIs.
MEF’s SD-WAN service definition specification describes requirements for an application-aware, over-the-top WAN connectivity service that uses policies to determine how application flows are forwarded over multiple underlay networks irrespective of the underlying technologies.
“MEF’s groundbreaking work in standardizing an SD-WAN service addresses one of the biggest obstacles impacting SD-WAN service market growth,” said Nan Chen, President, MEF. “In a recent joint MEF and Vertical Systems Group survey of service providers worldwide, nearly 80% of respondents identified the lack of an industry-standard service definition as a significant challenge for service providers to offer or migrate to SD-WAN services. MEF’s SD-WAN service standardization will undoubtedly accelerate sales of SD-WAN products and services like MEF accomplished with Carrier Ethernet service standardization.”
Just as the industry has benefited from MEF standardization of CE services – which now exceed an estimated $50 billion in annual revenues globally – there are numerous potential benefits associated with a common SD-WAN service definition. These include, among other things:
- Reducing market confusion about service components, core capabilities, and related concepts, thus saving valuable time given the scarce availability of skilled personnel.
- Enabling service providers and technology providers to focus on providing a core set of common capabilities and then building on that core resulting in differentiated offerings.
- Facilitating inclusion of SD-WAN services in standardized LSO architectures, thereby advancing efforts to orchestrate MEF 3.0 SD-WAN services across multiple providers.
- Paving the way for creation and implementation of SD-WAN services certification, which will give users confidence that a service meets a fundamental set of requirements.
SD-WAN Implementation
MEF member companies are involved in multiple SD-WAN implementation-related initiatives that can be leveraged to provide feedback on standardization requirements and create software-oriented artifacts that can be used to accelerate efforts to orchestrate standardized SD-WAN services. These initiatives include the MEF 3.0 Multi-Vendor SD-WAN Implementation project, the MEF18 LSO Hackathon, and several SD-WAN Proof of Concept (PoC) demonstrations at MEF18.
The MEF18 LSO Hackathon is focused on developing and validating data models for SD-WAN services. This presents a unique opportunity for those involved in technical aspects of SD-WAN services and products to learn in a hands-on way about the latest SD-WAN service and LSO standardization work at MEF as well as the related API and YANG work at ONF and IETF.
Three MEF18 PoC demonstrations directly related to LSO-enabled orchestration of SD-WAN services include:
- Zero Touch Services with Secure SD-WAN
- Towards a Multi-Vendor Orchestrated SD-WAN – LSO-enabled Solution with Open Source Orchestrator and Container-based uCPEs
- Instantiation and Delivery of SD-WAN over a Virtualized and Orchestrated Wholesale Carrier Ethernet Access Service.
MEF 3.0 SD-WAN Service Certification
MEF currently plans to introduce a pilot version of certification for MEF 3.0 SD-WAN services in the first half of 2019. This certification will test a set of service attributes and their behaviors defined in the upcoming SD-WAN standard and described in detail in the MEF 3.0 SD-WAN Service Certification Blueprint.
…………………………………………………………………………………………..
References:
…………………………………………………………………………………
Cisco Virtual Networking Index report: Enterprise SD-WAN growth will increase five-fold by 2022:
5G interoperability tests using Alef Mobitech’s mobile edge platform
Several major tech companies and an unnamed global mobile carrier have declared their tests of 5G interoperability a success. Alef Mobitech‘s mobile edge platform for the technology can be “reliably deployed into national mobile networks as a seamless, transparent overlay on their existing 4G infrastructure,” Alef says. HP, Cisco, Nokia, Huawei, Dell and Ericsson conducted the tests with Alef and a “tier-one global mobile carrier” that remains anonymous.
Editor’s Note:
Alef Mobitech, launched in 2013, is a Mobile Edge Computing (MEC) products and services provider. Alef is transforming the Mobile Internet through its MEC platform. The company has offices in New Jersey. India and Brazil.
Alef Mobitech provides value-added services at the edge of the mobile network. Mobile edge computing allows us to physically locate products and services closer to users. Alef makes your network faster and more responsive. New and existing networks benefit from our edge architecture. We provide market differentiation and new revenue opportunities to mobile carriers and developers.

Key Alef characteristics:
- Offers a first-of-its-kind MEC Platform that allows applications and network services to work in tandem.
- Utilizes optimized mobility at the Radio Edge to provide a richer, more responsive and relevant delivery of multi-media applications.
- Simplifies distribution and delivery across multiple markets.
- Through key partnerships, these applications will benefit from a speedier and richer mobile internet experience.
- Reduces complexity and enhances speed to market via a Managed Service offering. Creates a more immersive, interactive, and intelligent Mobile Internet.
…………………………………………………………………………………………………………………………………………………………………….
The tests, which used Alef’s edge computing platform, were completed across New Jersey, Sao Paulo, and Mumbai. According to Alef, the tests show its platform can be “reliably deployed into national mobile networks as a seamless, transparent overlay on their existing 4G infrastructure”.
“The interoperability testing included standard billing interfaces — both pre-paid and post-paid, for voice and data services — and a comprehensive revenue assurance test regimen,” Alef said.
“Alef also demonstrated comprehensive interconnects with existing operations, administration, maintenance, and provisioning systems … throughout all of this testing, zero changes to the existing infrastructure were required.”
The announcement followed Samsung, Ericsson, and Nokia last week syncing their 5G equipment in partnership with SK Telecom in Korea, interoperating Samsung’s 5G Non-standalone (NSA) switchboard with Ericsson and Nokia’s 5G base stations.
In July, Huawei, Intel, and China Mobile also worked on 5G interoperability and development testing (IODT), which they said would help accelerate the commercialisation of 5G networking equipment globally.
Intel and Huawei had in February used Mobile World Congress (MWC) 2018 to conduct the world’s first 5G NR over-the-air interoperability public demonstration after Huawei had announced partnering with Intel on interoperability trials based on 3GPP standards back in September 2017.
At the end of December, Ericsson kicked off 5G interoperability trials with Australian mobile carrier Telstra; United States carriers T-Mobile, Verizon, Sprint, and AT&T; Japanese carrier NTT DoCoMo; Korean carrier SK Telecom; and European carriers Vodafone and Orange, as well as smartphone chip giant Qualcomm.
https://www.zdnet.com/article/5g-mobile-edge-tests-completed-by-global-tech-giants/
Calix touts GigaSpire as smart home solution for ISPs
To do so, broadband Internet providers will need to go to battle with a wide variety of companies who are now aiming to capture growing smart home revenue as their own, including blue chip technology companies like Google and Amazon. Those two are joined by a growing number of device manufacturers from well known brands like Netgear and Linksys to emerging smart home ecosystem enablers like Ring and Iris.
Patching all of these platforms together can be challenging and frustrating to end customers, and service providers often get the brunt of this frustration in the form of tech support inquiries, whether it’s the provider’s fault or not. Many providers have ventured into managed Wi-Fi services to help curtail this issue, while hoping to generate additional revenue in the process. GigaSpire takes this strategy much further, according to Calix.
In an analyst briefing, Calix EVP of Field Operations Michael Weening says GigaSpire far surpasses any Wi-Fi gateway platform that end customers can buy from any retail or online environment.

GigaSpire Platform (Source: Calix)
………………………………………………………………………………………………………………………………………………………………………………………………………..
GigaSpire runs Calix’s EXOS operating system, which was introduced last year and extends their AXOS access operating system platform into the customer premises. Other GigaSpire features include:
- Wi-Fi 6 (802.11ax) capable, with up to 12 Wi-Fi streams
- Intelligent bandwidth optimization using MU-MIMO technology
- Universal and managed IoT supporting Zigbee, ZWave, combo BlueTooth Low-Energy and BlueTooth Classic
- Amazon Alexa is integrated into the GigaSpire MAX
- Instrumentation and analytics providing telemetry, performance and behavioral analytics that CSPs can leverage through the Calix Cloud
Calix also intends to build an ecosystem of smart home applications that will ride the GigaSpire platform, allowing service providers to offer and perhaps monetize smart home IoT applications. Examples provided include smart home device management, home security and network security.
Two Calix customers are acting as launch customers for GigaSpire, including Nebraska-based Allo Communications and Dubai-based du.
“Calix has been a great partner as we’ve built up our home Wi-Fi enabling the best connectivity but also the best customer service through ongoing network management,” said Brad Moline, president and CEO of ALLO Communications in press release. “This new smart home solution is anticipated to build on that connectivity advantage and really put it to use by delivering customized and differentiated service bundles to our subscribers.”
Smart Home-as-a-Service Goals
Calix’s goal with GigaSpire is to create an end-to-end smart home platform that service providers can take to the residential market and offer smart home-as-a-service. Whether that’s through better integration of existing smart home applications customer’s already have, or by introducing new ones through a smart home app ecosystem enabled through Calix designated partners. Calix will extend the GigaSpire platform to the SMB segment with a business focused smart IoT platform in 2019.
References:
WSJ Interview with John Donovan: Inside AT&T’s Plan for 5G Technology
Wireless telcos are counting on 5G’s capabilities to broaden their customer base beyond phones to new machines like driverless cars and factory robots. AT&T executives are so enticed by the promise of mixed-reality goggles, which superimpose images in users’ field of vision, that they invested in visor maker Magic Leap to help develop a market for the devices (see below for details).
AT&T is in a race to launch 5G services faster than its rivals, though each is taking a different path to get there. Verizon Communications tried to get the jump on its competition with its own pre-5G (fixed wireless broadband) standard. AT&T directed its research toward internationally recognized specifications (i.e. 3GPP which is not a standards organization)—hoping that doing so will make its service more adaptable as the technology matures.
The chief executive of AT&T’s communications division, John Donovan, spoke with The Wall Street Journal about AT&T’s plans for 5G, among other things. Here are edited excerpts of the conversation.
WSJ: There’s been a lot of talk about 5G technology. When it comes, what will it look like?
MR. DONOVAN: You’ll start to see handsets rolling out as early as the first quarter of 2019, but much more probably and in more volume when you start to look at the back half of ’19. Things will be compatible with not only 5G but also all of the prior generations. With nonstandards technology, [that kind of backward compatibility] is not typically the case. That’s why we didn’t waste too much time on the nonstandard version like some of our competitors.
WSJ: It sounds like there’s a bit of a chicken-and-egg problem. If you don’t know what consumers are going to want 5G service for, how do you know where to build the network first?
MR. DONOVAN: We think that the 5G network is going to be most impactful for most consumers and businesses based on specific use cases. One would be retail. With this 5G network, you’re going to be able to get centimeter-level accuracy on location. These potential use cases include recognizing consumers entering the store, alerting the concierge or manager to provide a personalized experience [and showing] product features on adjacent digital signage or scanning and displaying product features within the store app on the consumer’s mobile device. Those are the kinds of things we think are going to drive this, as opposed to saying, “Hey, I’ve got a phone and it’s faster, look at mine, it’s got this 5G tag up in the corner.”

Research and Deployment:
Milestones in the evolution and rollout of 5G technology

……………………………………………………………………………………….
We’ve made two announcements so far. One is in robotic manufacturing in Austin, Texas, with Samsung. And we have an exclusive for the Magic Leap mixed-reality goggles.
The speed of 5G means the next generation of goggles will be smaller, lighter and cheaper. When we did the announcement with Magic Leap, one of the things we announced is that DirecTV Now will be one of the apps available on the goggles. So, you put the goggles on and you can project four televisions onto the wall.
It’s mind-blowing to think about creating an 80-inch television from a set of goggles.
WSJ: When 5G comes to my cellphone, am I going to pay more for a plan?
MR. DONOVAN: That’s to be determined. I think that’s something that collectively the industry’s going to try to innovate around. When we went from megabits and text-message plans to unlimited in the 4G network, there wasn’t a lot of incremental revenue. But 4G dropped our costs dramatically, so it improved our margins.
With 5G, you can never call these things until you get into the marketplace. Most would say now that it’s going to carry a premium because it’s so superior in some of the things it can do. But that premium may be that you have three new devices in your home that have small connection fees, and not necessarily that you have an iPhone in your hand and the plan it’s on costs more.
WSJ: Looking back on past generations of wireless, as networks mature, it gets harder to tell the networks apart, at least in the consumer’s mind. How do you try to distinguish yourself from the other guys?
MR. DONOVAN: Generally, we’ve hit a point with networks that there’s “good enough.” The analogy I use is oxygen. You’ll notice if it’s not there. But if it is there, in its highest state it’s invisible. How do you make it visible? Your people. I love the idea when it’s about the people in the stores, the call centers, your sales rep. We’re more likely to win in a world differentiated around people than marginally differentiated by machines.
WSJ: Should the number of stores be growing? Do you think we need more places to buy phones?
MR. DONOVAN: Yes, but I don’t want to build a store that you have to go to. I want to go to where you already are. So, if you look at our retail growth this year, it’ll be in kiosks, pop-up stores and trucks. If you’re in a brand new [apartment] and you want to deal with fiber and a family plan and television, wouldn’t it be great if you had a pop-up store that’s in the lobby right near the leasing office, you can get all of that stuff done, and a year later the store is gone because the building’s leased up?
The future of retail is that you need to be where the people already are. The idea that you’re going to run a television commercial, have them get off the couch and go call an 800 number, or get off the couch and go to a store, is no longer the case.
If you take the wireless business, even up to three to five years ago, you could run a promotion on television and generate volume by people going to your store. Today, the customer’s perception is that’s an industry offer. They would never say, “That’s a T-Mobile offer, I’m going to go to the store and get it done.” They go from there to Google and they start searching. Or the other thing is they go entirely in social. So their friends say, “You know what, you need to switch to AT&T and here’s why.”
Those two things didn’t even exist five years ago from a standpoint of how we marketed.
…………………………………………………………………………………………
Mr. FitzGerald is a Wall Street Journal reporter in Washington. Email[email protected].
Appeared in the October 30, 2018, WSJ print edition as ‘What’s Behind AT&T’s Plan for 5G Technology.’
……………………………………………………………………………….
India Mobile Congress 2018: Telecom Equipment Vendors to Invest over Rs 4,000 crore in India; Samsung in Spotlight

IEEE President Jim Jefferies speaking at India Mobile Congress (IMC) 2018
……………………………………………………………………………………………………………………………………………………………………………………………………………………………….
Telecom Equipment Vendors Investment in India:
Telecom equipment makers including Cisco, Samsung, Ericsson, Nokia, Intel and Sterlite Tech (from India) will be investing more than Rs 4,000 [1] crore in India, announced Telecom Minister Manoj Sinha Saturday at the third day of the India Mobile Congress (IMC) 2018. That investment commitment is in line with India Prime Minister Narendra Modi‘s goal to achieve a capital gain of $100 billion (about Rs 7 lakh crore) by 2022. The amount invested will increase further, said Sinha, adding that the investment commitment shown by the equipment manufacturers is a part of government’s ambitious policy target to achieve Rs 7 lakh crore worth of investment by 2022. Sinha said discussions and announcements at IMC show that India is ready for the emerging 5G services. The 5G technology (based on the forthcoming IMT 2020 standard) would facilitate massive machine-to-machine (M2M) communication and has many other applications.
Note 1. 4000 crores (= 400000 lakhs) is equal to 40000 million (40 billion). 40,000,000,000 INR is equal to 544,400,000 USD @ 73.48 Indian rupees to 1 US dollar.
…………………………………………………………………………………………………………………………………………………………………………………………………………………………………………………………………….
These are the first set of investments flowing in after the announcement of National Digital Communications Policy. In August this year, the India Cabinet has approved the National Digital Communications Policy 2018 that aims to attract $100 billion of investment and creation of 4 million jobs in next four years, in addition to an aggressive focus on next-generation of technologies. However, the investments will be made over a period of next one-two years, according Telecom Secretary Aruna Sundararajan.
Among all these telecom equipment makers, Sterlite Tech is the only homegrown (Indian) company that locally produces end-to-end optic fiber gear, a critical digital infrastructure required to increase 4G-LTE footprint and enabler of upcoming “5G” technology roll-outs.
Meanwhile, Korea’s Samsung, Sweden’s Ericsson, Finland’s Nokia and the US-based Cisco have already partnered with India service operators and the telecom department to conduct field trials and demonstrate India-specific 5G use cases.
Industry experts discussed challenges in the digital communications during the three-day India Mobile Congress 2018 event, which saw participation from 20 countries and 300 companies, Sinha said. Sinha added that discussions and announcements at the event show India is ready for the emerging 5G services. The 5G technology could facilitate massive machine-to-machine communications and has multiple usages.
………………………………………………………………………………………………………………………………………………………………………………………………………………………………………….
The India Mobile Congress 2018 was organized jointly by the India DoT and industry group Cellular Operators Association of India (COAI) which represents telcos such as Bharti Airtel, Reliance Jio and Vodafone Idea as well as gear makers such as Huawei, Ericsson, Nokia, Cisco and Samsung.
Sundararajan said IMC has generated more enthusiasm around 5G and the government has already committed to be at par with the world in launching this next generation services. “We have already demonstrated government intent that India does not miss the 5G bus. We have already started to take initial set of action to make an enabling environment. We expect actual allocations of spectrum (for 5G services) to begin in the second half of next year,” Sundararajan added.
……………………………………………………………………………………………………………………………………………………………………………………………………………………………………………
Samsung in IMC 2018 Spotlight:
At IMC 2018, Samsung announced its plan for India’s first large-scale 5G trial, scheduled to take place in the first quarter of 2019 in collaboration with the Department of Telecommunications (DoT).
In his keynote speech at the event, Youngky Kim, President and Head of Networks Business at Samsung Electronics, said, “Samsung will pave the way for 5G to unlock the full potential of India together with industry leaders. We are witnessing a rise in adoption of new technologies, inspired by ‘Digital India’ and spurred by the transition to 4G.’
“Our partnership with Reliance Jio has empowered millions, making their everyday lives better. Our roadmap for 5G showcases our strong commitment to India. We will continue to be a partner in Government of India’s Digital India mission,” said HC Hong, President and CEO, Samsung Electronics SouthWest Asia. Leading Disruptive Changes Using 4G in Digital India Since 2012, Samsung has been a key partner of the Indian telecommunications industry. During President Kim’s keynote speech at the IMC, he said that Samsung has successfully built the world’s largest greenfield and the most advanced 4G LTE networks nationwide by partnering with Reliance Jio.
At IMC 2018, Samsung showcased how its 5G solutions can enable a variety of 5G-powered business models and scenarios, including: 5G home broadband services, Smart Cities and Smart Agriculture.
Samsung’s 5G Skyship (see photo below), which was developed in partnership with Korea Telecom, was flying over the exhibition center to demonstrate first response use cases. Samsung says it has been a pioneer in developing 5G solutions using its technology and experience. With its successful development of the first commercial ASIC-based 5G modems and mmWave RFICs, the company has been manufacturing compact-sized 5G radio and router devices and CPEs.
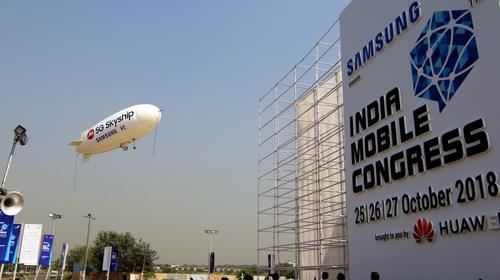 Photo provided by KT shows an unmanned airship using “high-end 5G” technology at the India Mobile Congress (IMC) 2018 in New Delhi
……………………………………………………………………………………………………………………………………………………………………………………………………………………………………………………………………….
Samsung says its years of commitment to R&D investments since 2000 have come to fruition, as the company has been selected by the world’s leading operators such Verizon, AT&T, Sprint and SK Telecom for both 4G and 5G solutions and services. At the root of this achievement are Samsung’s end-to-end solutions spanning network equipment, devices, chip sets and the world’s-first regulatory approval of 5G equipment by the U.S. Federal Communications Commission (FCC). Samsung will continue its legacy of 4G LTE to enable digital transformation and provide a seamless path to 5G.
Fujitsu, Ericsson form 5G partnership focused on Japanese market
Fujitsu has entered a strategic partnership with Ericsson aimed at delivering joint end-to-end 5G solutions, initially for the Japanese market. The two companies plan to combine their radio access and core network portfolios to deliver 5G mobile network services and solutions across Japan before expanding to other markets worldwide. The companies will also collaborate on R&D activities related to 5G. This agreement comes shortly after NEC and Samsung announced their own 5G partnership aimed at developing end-to-end 5G system solutions.
Fujitsu has been collaborating on open standards activities driven by major operators and aims to achieve interoperability for its radio access products. According to Fujitsu EVP of network business Tango Matsumoto, this partnership will support that aim.
“Through this partnership with Ericsson, we will provide flexible 5G network systems that are open and standard compliant, and will leverage our expertise in wireless technologies and network integration to a wide range of customers in and outside of Japan,” he said. “From (enhanced) mobile broadband, expected to be the first widespread use case of 5G, to the IoT and beyond, this partnership holds out the promise of exciting new business opportunities,” he added.
Ericsson EVP of networks Fredrik Jejdling added that the partnership will support the company’s efforts to carve out a share of the Japanese 5G market.
“Our global expertise in 5G combined with our understanding of the local market puts us in an excellent position to support the introduction of 5G in Japan,” he said. “By working closely with operators and partners, we are creating solutions that will bring successful use cases and applications to the market. With Fujitsu we get an excellent partner to accelerate this development.”
Fujitsu’s previous work on 5G saw it last year kick off a field trial of its 5G ultra high-density distributed antenna technology and tests of simultaneous high-speed transmission of high-res video using the antenna system, in partnership with Japanese carrier NTT DoCoMo.
Ericsson has the second-biggest share of global base-station sales — approaching 30%, according to IHS Markit. Ericsson’s equipment is already being used in parts of the U.S. that are rolling out 5G service.
Fujitsu, which does most of its business in Japan, holds less than a 1% global base station market share. Fujitsu and Fujitsu Laboratories, which have been working on 5G trials with NTT DoCoMo since 2014, have also collaborated with NTT DoCoMo on evaluating communications speed for distributed antennas deployed at multiple outdoor locations.
Reference:
https://www.ericsson.com/en/press-releases/2018/10/fujitsu-and-ericsson-team-up-on-5g-partnership
3GPP Workshop: IMT 2020 Submission to ITU-R WP5D and Timelines for 5G Standards Completion
3GPP RAN for IMT 2020, by Balazs Bertenyi, Chairman of 3GPP RAN (Nokia):
The Workshop on 3GPP submission towards IMT-2020 was held in Brussels, Belgium, October 24-25, 2018, hosted by the European Commission. The meeting was intended to inform the Independent Evaluation Groups and the industry in general about the 5G mobile communication system and corresponding evaluations that 3GPP has and will submit as a candidate for IMT-2020 to ITU-R. The workshop also had a live streaming service kindly provided by the host and announced shortly before the meeting via the 3GPP web page (see reference below) and the RAN reflector.
Introduction:
3GPP has been working extremely hard to bring 5G NR standards to the industry in an accelerated manner. Non-standalone 5G NR (New Radio) was completed in December 2017, and the corresponding ASN.1 has been stabilized in June/2018.
Standalone 5G NR was completed in June 2018, and the corresponding ASN.1 scheduled to be frozen in September/2018.
Some of the architecture options to facilitate migration from LTE to 5G NR will be completed in December 2018 and will still be within 3GPP Release 15.
3GPP has also approved the work program for Release 16 containing a host of new and enhanced functionalities for 5G NR. The target completion for Release 16 is December/2019.
3GPP submission to IMT2020 (ITU-R WP5D) will contain both Release 15 and (mostly) Release 16 functionality.
…………………………………………………………………………………………………………………………………………..
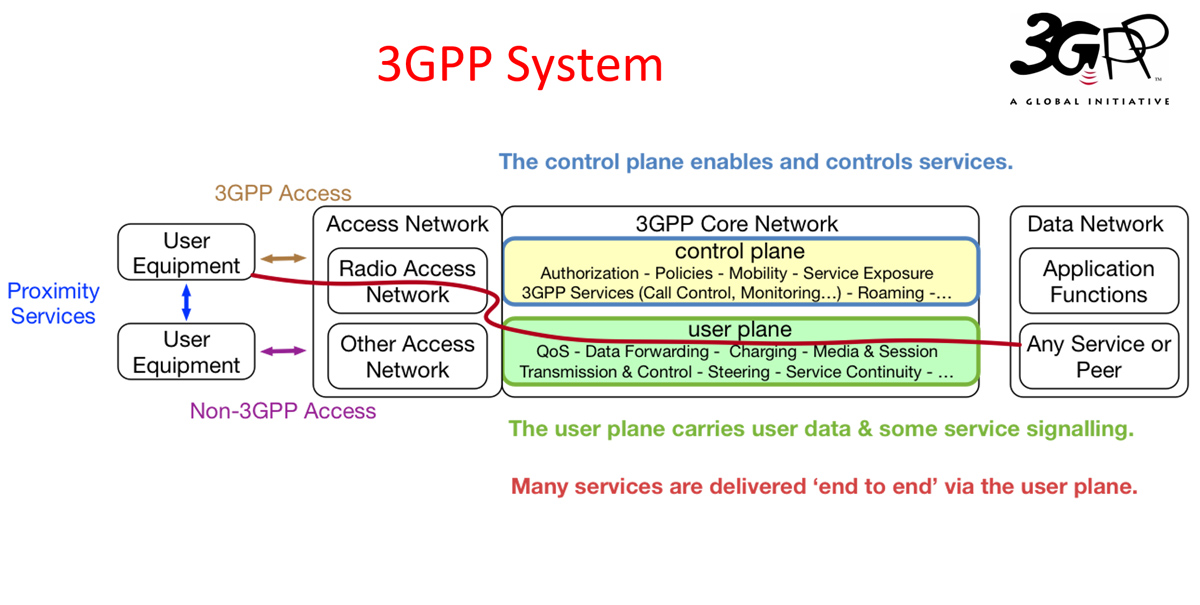
Software- and Service-centric Transformation:
One CoreNetwork fits all => Open & Flexible Enabler
Telecom Operators => Multiple Stakeholders
Phones => Things
Procedures => Services
Static Topology => On-demand Resources
Dedicated Hardware => Orchestrated Resources
Network Function => Virtualization
Single Network => Slice
5G Core Technologies (subset):
Orchestration and Virtualization (NFV) – de-couple logical function from hardware
Slicing – logical end-2-end networks tailed to customer needs
Edge Computing (MEC) – resources where they are needed (URLLC)
Exposure (API) – 3rd party access to 5G services
Service Based Architecture (SBA) – stateless, open, flexible
Harmonized Protocols & Access Agnostic – generic solutions
………………………………………………………………………………………………………………………………………………..
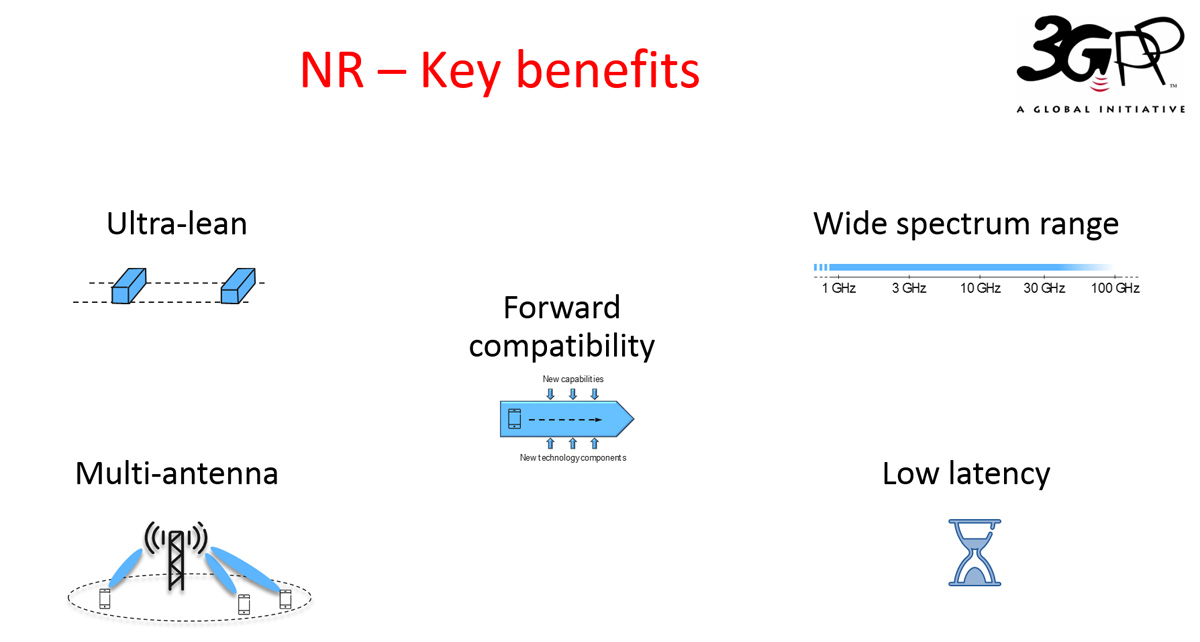
Physical Layer:
· NR addresses a broad range of use cases with a flexible physical layer structure
· Key enablers include
o Ultra-lean design
o Operability in a wide spectrum range
o Low latency
o Forward compatible design
o Advanced multi-antenna techniques
…………………………………………………………………………………………………………………………………………………..
………………………………………………………………………………………………………………………………………………………………………………………………………………..
Comparison of NR-MIMO vs LTE MIMO
|
|
LTE Rel-8 |
LTE-A Pro Rel-15 |
NR Rel-15 |
|
Purpose |
Spectral efficiency enhancement |
Spectral efficiency enhancement |
– Coverage enhancement – Spectral efficiency enhancement |
|
Multi-beam operation |
No specification support |
No specification support |
– Beam measurement, reporting – Beam indication – Beam failure recovery |
|
Uplink transmission |
– Up to 4 layers per UE – Up to 8 layers for MU-MIMO (cyclic shifts for ZC-sequence) |
– Up to 4 layers per UE – Up to 8 layers for MU-MIMO |
– Up to 4 layers per UE – Up to 12 layers for MU-MIMO (orthogonal ports) |
|
Downlink transmission |
Up to 4 layers per UE |
– Up to 8 layers per UE – Up to 4 layers for MU-MIMO (orthogonal ports) |
– Up to 8 layers per UE – Up to 12 layers for MU-MIMO (orthogonal ports) |
|
Reference signal |
– Fixed pattern, overhead – Up to 4 TX antenna ports (CRS) |
– Fixed pattern, overhead – Up to 32 TX antenna ports (CSI-RS) |
– Configurable pattern, overhead – Up to 32 TX antenna ports (CSI-RS) – Support for above 6GHz |
3GPP ……………………
””””””””””””””””””””””””””””””””””””””””””””””””””””””””””””””””””””””””””””””””””””””””””””””””””””””””
IMT-2020 – Final submission
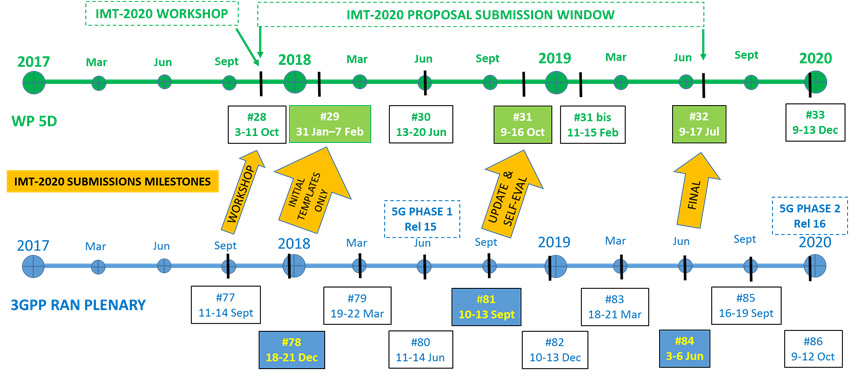
- Calibration for self evaluation
- Prepare and finalize initial description template information that is to be submitted to ITU-R WP 5D#29.
Step 2: From early 2018 to Sep 2018, targeting “update & self eval” submission in Sep 2018
- Performance evaluation against eMBB, mMTC and URLLC requirements and test environments for NR and LTE features.
- Update description template and prepare compliance template according to self evaluation results.
- Provide description template, compliance template, and self evaluation results based on Rel-15 in Sep 2018.
Step 3: From Sep 2018 to June 2019, targeting “Final” submission in June 2019
- Performance evaluation update by taking into account Rel-16 updates in addition to Rel-15
- Update description template and compliance template to take into account Rel-16 updates in addition to Rel-15
- Provide description template, compliance template, and self evaluation results based on Rel-15 and Rel-16 in June 2019.
”””””””””””””””””””””””””””””””””””””””””””””””””””””””””””””””””””””””””””””””””””””””””””””””””””””””””””””””””””””””””””””””””””””
Let’s compare that with the ITU-R WP5D Timeline Technology Aspects WG (RIT, SRIT): Note IMT 2020 items in the workplan!
|
July 2019 |
[Geneva] WP 5D #32 |
• Finalize draft new Report ITU-R M.[IMT.MS/MSS.2GHz] • Further update/Finalize draft new Report/Recommendation ITU-R • Finalize draft new Report/Recommendation ITU-R M.[IMT.3300 MHz RLS] • Finalize Doc. IMT-2020/YYY Input Submissions Summary • Finalize revision of Recommendation M.2012 • Finalize Addendum 5 to Circular Letter IMT‑2020 • Workshop on evaluation of IMT-2020 terrestrial radio interfaces |
|
December 2019 |
[Geneva] WP 5D #33 (max 5 day meeting) |
• Focus meeting on evaluation – review of external activities in Independent Evaluation groups through interim evaluation reports |
|
February 2020 |
[TBD] WP 5D #34 |
• Finalize Doc. IMT-2020/ZZZ Evaluation Reports Summary • Finalize Doc. IMT-2020/VVV Process and use of GCS • Finalize Addendum 6 to Circular Letter IMT‑2020 • Finalize draft new Report M.[IMT.AAS] • Finalize draft new Report ITU-R M.[HAPS-IMT] |
|
June 2020 |
[TBD] WP 5D #35 |
• Finalize draft new Report ITU-R M.[IMT-2020.OUTCOME] • Finalize Addendum 7 to Circular Letter IMT‑2020 |
|
October 2020 |
[TBD] WP 5D #36 |
• Finalize draft new Recommendation ITU-R M.[IMT‑2020.SPECS] • Finalize Addendum 8 to Circular Letter IMT‑2020 |
………………………………………………………………………………………………………………………………………………….
Now let’s examine the ITU-R WP5D Oct 2018 meeting input contributions related to IMT 2020:
[Note the tremendous support of companies backing 3GPP]
|
[1050] Preliminary description template and self-evaluation of 3GPP 5G candidate for inclusion in IMT-2020 – multiple companies co-authored this contribution! |
TECHNOLOGY ASPECTS |
|
Updated submission of candidate IMT-2020 Radio Interface Technology |
TECHNOLOGY ASPECTS |
||
|
Consideration on IMT-2020 evaluation process |
TECHNOLOGY ASPECTS |
|
Proposed preliminary draft new Report ITU-R M.[IMT_EXPERIENCES] |
GENERAL ASPECTS |
|
Proposals on workplan and document template for process and the use of Global Core Specification (GCS), references and related certifications in conjunction with Recommendation ITU‑R M.[IMT-2020.SPECS] |
TECHNOLOGY ASPECTS |
|
Proposals on working document towards IMT-2020/VVV and its workplan |
TECHNOLOGY ASPECTS |
||
|
Second submission of a candidate technology of IMT-2020 |
TECHNOLOGY ASPECTS |
|
Proposal on continuity of development of working document towards a preliminary draft new Report ITU-R M.[IMT.EXPERIENCES] – National [approaches, best practices and/or] experience of some countries in which certain frequency band(s) are allocated to mobile services and identified for IMT systems related to technical, operational and regulatory/procedural aspects |
GENERAL ASPECTS |
…………………………………………………………………………………………………………………………………………………………………..
Below is a chart of the organizations that have indicated they will submit candidate IMT 2020 RITs to ITU-R WP5D. The list includes: 3GPP, China, Korea, ETSI/DECT Forum, and the India Standards organization (TSDSI). ALL BUT THE ETSI/DECT Forum will be based on 3GPP New Radio (NR) for the core RIT PHY layer.

References:
http://www.3gpp.org/news-events/3gpp-news/1976-imt_2020
http://www.3gpp.org/news-events/3gpp-news/1987-imt2020_workshop
http://www.3gpp.org/news-events/3gpp-news/1994-copatibility
Busting a Myth: 3GPP Roadmap to true 5G (IMT 2020) vs AT&T “standards-based 5G” in Austin, TX
Samsung Partners with NEC and Qualcomm for 5G, Licenses Nokia Patents
Samsung has announced a new 5G partnership agreement with NEC aimed at exploring new business opportunities in the global telecom market. The two electronics/ network equipment companies will combine their 5G technologies and capabilities to provide mobile operators with 5G solutions that are localized for each region, and include customized services and flexible architectures to meet operators’ varying needs.
Note that there are only five mainstream cellular base station makers- Ericsson, Nokia, Huawei, ZTE, and Samsung. NEC wants to break in to that elite group.
“5G development based on standardization (IMT 2020???) will help to accelerate business transformation throughout global markets,” NEC EVP and president of networks services Atsuo Kawamura said.
“As 5G commercialization is just around the corner, we are confident that the partnership with Samsung will continue to solidify our stance as a 5G leader.”
“5G will unlock the potentials, create new values and push the limits of today’s technology,” added Samsung president and head of networks Youngky Kim.
“We are excited to announce our joint efforts with NEC to boost 5G end-to-end solution portfolio for the best user experience.”
According to NEC executive vice president Atsuo Kawamura, the partnership with Samsung will ensure the companies remain out in front of 5G end-to-end technology globally. Kawamura said NEC will also provide NTT DoCoMo with “remote diagnosis and advanced security that combine 5G with the latest ICT”.
Following the standardisation of 5G NR specs in December last year, both NEC Corporation and Samsung had announced the beginning of the full-scale development of 5G NR including large-scale trials and commercial deployment, along with Huawei, Ericsson, Intel, Nokia, AT&T, BT, China Mobile, China Telecom, China Unicom, Deutsche Telekom, NTT DoCoMo, Fujitsu, KT Corporation, LG Electronics, LG Uplus, MediaTek, Orange, Qualcomm, SK Telecom, Sony Mobile Communications, Sprint, TIM, Telefonica, Telia Company, T-Mobile USA, Verizon, Vodafone, and ZTE.
…………………………………………………………………………………………………
Samsung has already been selected as a vendor for Verizon’s launch of a residential 5G service across parts of Sacramento, Los Angeles, Houston, and Indianapolis, supplying its 5G home and outdoor router, 5G Radio access unit and digital unit, and virtualised radio solutions, as well as supplying 5G-ready solutions for both Sprint and AT&T.
It will also be one of the vendors for SK Telecom’s 5G rollout in South Korea.
NEC, meanwhile, inked a 5G equipment supply deal with Japanese mobile carrier NTT DoCoMo in May, with the Japanese telecommunications carrier planning to launch its new mobile network in 2020, after the two undertook verification experiments on 5G wireless technologies earlier this year.
Under the deal, NEC will provide control units for 5G base stations as well as using software upgrades to ensure NTT DoCoMo’s existing base stations and telco equipment are compatible with 5G.
“Currently, high-density base station equipment that NEC began providing in February 2015 is already compatible with the advanced Centralised Radio Access Network (C-RAN) architecture advocated by DoCoMo, and is now being utilised as a base station control unit,” NEC said.
“Moreover, following a software upgrade, an advance in communications from LTE to LTE-Advanced has been achieved.”
……………………………………………………………………………………………………..
The NEC partnership follows Samsung announcement earlier this week that it would be partnering with Qualcomm on 5G small cell development to “open the door for massive 5G network speed, capacity, coverage, and ultra-low latency.”
Samsung said it would use Qualcomm’s FSM100xx 10nm small cell product announced in May, which works across both the sub-6GHz and millimetre-wave (mmWave) spectrum bands. The products are expected to begin sampling in 2020.
…………………………………………………………………………………………….
Separately, Samsung has announced it has extended its agreement to license various Nokia patents for a multi-year period. The existing licensing agreement expires at the end of 2018.
“Samsung is a leader in the smartphone industry and has been a Nokia licensee for many years,” Nokia chief legal officer and Nokia Technologies president Maria Varsellona said.
“We are pleased to have reached agreement to extend our license. This agreement demonstrates the strength of our patent portfolio and our leadership in R&D and licensing for cellular standards including 5G.”
References:
https://news.samsung.com/us/nec-samsung-announce-5g-partnership-agreement/
https://www.zdnet.com/article/samsung-and-nec-announce-5g-partnership/
AT&T Communications CEO John Donovan on 3Q2018 Earnings Call
Broadband: Fiber deployment will drive broadband growth:
AT&T Communications is driving broadband growth in our fiber footprint. We now cover more than 10 million customer locations today and plan to add 4 million more locations in the next year. We already have substantially more than 3 million broadband customers in our fiber footprint. And the longer we have fiber in the market, the higher our penetration.
In fact, we expect our fiber broadband base to increase by more than 1 million subscribers this year. This shift to fiber is beginning to drive IP broadband ARPU growth. The strategic pivot we’re making with video, combined with our execution with fiber gives us the confidence that we will stabilize Entertainment Group EBITDA next year.
[Implication is that increased fiber to the building will stabilize AT&Ts linear video business (U-Verse and DirecTV) which has been losing subscribers to cord cutters. However, FTTB is only applicable to U-Verse- not satellite TV (DirecTV)].
Finally, we’re keeping a laser focus on costs in all of our businesses and maintaining our margins in Business Wireline.
FirstNet:
Our FirstNet team continues to execute extremely well. So far, we launched a nationwide FirstNet dedicated and physically separate network core with FirstNet traffic moving on it. We have priority and pre-emption in place, allowing continuous service during times of heavy traffic.
FirstNet devices are ready and available. These devices support all AT&T commercial LTE bands as well as the FirstNet Band 14 and meet the band priority selection technical requirements. And we’re six months ahead of schedule with our network deployment already covering about one-third of the expected FirstNet area.
We’re seeing in real time how we are performing in times of emergency with Hurricane Michael being the latest example. We began preparing for this storm before it arrived and our work continues even to today.
Because of these efforts, we were able to keep our customers, including first responders, connected during and after the storm in many areas. In fact, our network operated at 90%, and usually better, of normal performance in the areas affected by Hurricane Michael. And through our tight coordination with public safety, we rolled out network assets to impacted areas to keep first responders connected.
We also worked with local authorities to identify public safety agencies that were without service from their wireless provider and delivered hundreds of FirstNet-enabled devices to help these first responders carry out their important mission of keeping the public safe.
One first responder went as far to say, when everything else was down, FirstNet was working. That’s high praise, and we’re humbled that we can play a part in helping a community recover from such a devastating storm. That’s what FirstNet is all about.
We continue to push our deployment. We’re climbing towers and adding 700 megahertz, AWS, and WCS spectrum all at once. We’re also adding new radio capability, which will enable us to upgrade the tower to 5G, without another tower climb.
The first responder community is a great sales opportunity for us. It’s an area where we’ve been under-penetrated in the past. But with our dedicated network core and outstanding performance when it matters most to the first responders, we’re making headway.
We now have more than 250,000 subscribers on FirstNet with more than 3,600 agencies represented. With a sales team dedicated to building this base, we believe there’s a lot of opportunity waiting for us.
5G and LTE-LAA:
AT&T is on track to be the first wireless carrier to introduce mobile 5G services in the United States in the next few weeks. This will be standards-based 5G (what standard is that John???????????????????). We plan to introduce 5G in parts of 12 cities by the end of the year. And we’ve announced additional 5G cities for next year, as we drive toward nationwide coverage of our 5G network.
Editor’s Note/Sanity Check:
The first wave of AT&T “5G” markets will include Dallas, Atlanta, Waco, Charlotte, Raleigh and Oklahoma City. Mr. Donovan noted that this rollout is part of a ‘drive toward nationwide coverage of our 5G network’; a nationwide 5G coverage target date has not been disclosed. He also noted that the 5G service will leverage the telco’s substantial fiber-optic network (see Comment box below), saying ‘fiber (backhaul) is the backbone of 5G’ [Of course, we agree]. AT&T will pass 18 million customer locations with its fiber network this year, with 22 million locations targeted in 2019. However, neither AT&T’s or any “5G” network announced for this year or next will NOT be “standards based,” as there is only ONE!!!!! standard for 5G – IMT 2020 which won’t be completed till year end 2020.
……………………………………………………………………………………………….
Second, our 5G foundation is in place (see below). We’ve completed 5G trials in several cities in the last three years. Fiber is the backbone of 5G, and we have one of the nation’s largest fiber networks. Including businesses, we pass about 18 million customer locations today and are expanding that to more than 22 million locations by next year.
5G Foundation:
Fiber passing ~22M units
• 14M Consumer by mid ‘19
• 8M Business
400+ 5G Evolution Cities in 2018
LTE-LAA in 24 Cities by End of Year
5G Introduction:
Completed 5G trials in multiple cities since 2016
Introducing mobile 5G in parts of 12 cities in 2018
-> 7 additional cities by early 2019
Starting on path to nationwide mobile 5G
Reliability:
The Best Network according to the nation’s largest test2
Nearly 50% increase in spectrum deployed by end of 2019 vs 2016
Strong performance during recent storms
…………………………………………………………………………………………………………………………………………………………
We plan for our 5G Evolution to be in more than 400 markets by the end of this year with nationwide coverage by mid-2019. Customers are seeing a dramatic lift in speeds with theoretical peak speeds reaching 400 megabits per second.
We also plan to launch LTE Licensed Assisted Access, or LTE-LAA, in parts of 24 cities by the end of the year. These are the building blocks towards the transition to 5G and can deliver speeds substantially faster than traditional LTE.
SDN, Virtualization, Spectrum, etc:
We’re also the leader in software defined networking (SDN) and are on track with our virtualization goals. This virtualization is bringing baseband units to the edge of the cloud or core and is going to be key for ultra-low latency that’s in 5G.
Thanks in part to our FirstNet build, our wireless spectrum is being put into service at a rapid rate. We’re on track to increase the amount of spectrum deployed by nearly 50%.
This is having a dramatic positive impact on our network, and others are noticing. We’ve been named the nation’s best network by a September GWS OneScore study, which is the largest and most comprehensive network study of its kind. Our network already is a recognized leader, and we’re taking steps to make it even better.
Video Business:
Moving to the video business. We continue to navigate industry pressure. We have plans to bring EBITDA stability back to our Entertainment Group. Allow me to elaborate on that.
First, we’re refining our four video products, tailoring them to customer needs. Our mobility-focused WatchTV is gaining traction. DIRECTV NOW is being updated to increase its simplicity and further differentiate the service. And our premium DIRECTV and U-verse services focus on the traditional linear TV viewers.
We’ve also begun beta testing our proprietary thin client streaming service (unnamed but said to be built around HBO) and plan to roll out trials in the first half of next year. This will be a more measured roll out. And like our introduction of WatchTV, we expect this service to be EBITDA positive. And over time, it should lower our acquisition cost of our premium video service. And both of these use the common platform we introduced with DIRECTV NOW.
If you look at linear TV, it’s really going to be about broadband and how do we use broadband to lead ourselves into premium TV. And then get an OTT package that’s well-suited to the people that are going to be the heavily engaged users.
If you look at the industry’s rate of decline on linear video, you find that we’re doing dramatically better than the industry where we have fiber footprint. We’re doing dramatically better than the industry in churn and acquisition where we have 25 meg and greater. Where our stress is is in the linear, in areas where we’re priced with just the linear video. And we’re going to have to take actions to continue to improve how we’re doing there.
Our fiber footprint build has given us a lot of inventory to sell into. With the fiber inventory that we’ve got coming online back half of this year, first part of next year, we have a lot of footprint to sell into. And within the quarter, not only do we have broadband ARPU growth, each month of the quarter got stronger. So we feel very good about where the broadband footprint is, in particular the fiber area. And that will help us with the video business, especially the linear video business.
But with the fiber inventory that we’ve got coming online back half of this year, first part of next year, we have a lot of footprint to sell into. And within the quarter, not only do we have broadband ARPU growth, each month of the quarter got stronger. So we feel very good about where the broadband footprint is, in particular the fiber area. And that will help us with the video business, the linear video business.
AT&T CEO Randall Stephenson aded: “And as we’re nearing completion of our fiber build and making pricing moves on video, we’re laying the foundation for stabilizing our Entertainment Group profitability in 2019. Across the business, I like our momentum and feel confident that we’re on track to deliver on our plans.”
………………………………………………………………………………………………………………………………………….
CFO John Stephens on CAPEX and Free Cash Flow:
We continue to expect our capital spending in the $22 billion range this year but we don’t expect as much vendor financing in the fourth quarter as before. So now we expect to be in the $24 billion range in gross capital investment for the year. We’re feeling really good about our free cash flow position heading into the fourth quarter. We expect $1.3 billion of FirstNet reimbursements in the fourth quarter since we received the FirstNet authorities’ approval for the latest contract milestone achievement.
…………………………………………………………………………………………………………………………………………..
Earnings Call Transcript:
https://seekingalpha.com/article/4213893-t-t-q3-2018-results-earnings-call-transcript?part=single
Slide Presentation:
2Q-2018 AT&T Communications report by John Donovan:
2Q-2018 Status & Direction of AT&T Communications, by CEO John Donovan
AT&T Fiber Now Reaches 2 Million Business Customer Locations
https://about.att.com/story/2018/fiber_for_business.html
ITU-R’s Role in Radio Frequency Spectrum for 5G Networks of the Future
Editor’s Note: This is an edited version of an ITU blog post titled “ITU’s approach to 5G” which can be read here. Many Editor’s Notes have been added for clarification and additional details.
………………………………………………………………………………………………………………………………………………………………….
Introduction:
When ready for deployment, 5G networks are expected to deliver more speed and capacity to support massive machine-to-machine communications and to provide low-latency, high-reliability service for time-critical applications. With such ambitious goals, 5G networks face considerable operational challenges such as meeting higher levels of stability, security and reliability.
5G networks aim to demonstrate high performance in different scenarios such as dense urban areas, indoor hotspots and rural areas. A number of countries have started trials for pre-standard 5G and the results are under assessment, with many companies successfully completing specific limited trials.
Like previous mobile broadband generations, 5G networks will use the radio-frequency spectrum. The radio-frequency spectrum is divided into frequency bands, allocated to radio communication services in such a way that each band may be used only by services which can co-exist with each other.
The increased traffic and speed required for 5G will necessitate much more spectrally efficient technologies, as well as a lot of additional spectrum, beyond what is currently used by 3G and 4G. Most of it will come from frequency bands above 24 GHz, which pose considerable challenges in terms of radiowave propagation and are also used by a number of radio communication services, notably for satellite communications, weather forecasting and monitoring of Earth resources and climate change.
To avoid interference between 5G and these services and thus ensure a viable mobile ecosystem for the future—and to reduce prices through the global market’s economies of scale and enable interoperability and roaming–national and international regulations need to be adopted and applied globally in these bands. The additional spectrum to be used by 5G therefore needs to be identified and harmonized at a global level. For the same reason, the radio technologies used in 5G devices need to be supported by globally harmonized standards.
ITU plays a key role in the development and adoption of these global regulations and standards. ITU membership is working to ensure that 5G networks are secure, stable, reliable, interoperable, safe for human health and energy efficient, and that they operate without interference. ITU’s role in managing the globally harmonized radio-frequency spectrum and standards for 5G is a key enabler in the development and implementation of 5G. ITU’s Standardization Sector (ITU-T) is playing a convening role for the technologies and architectures of the wireline elements of 5G systems.
Spectrum is a limited natural resource which may be used to and from any point on the Earth and in Space. Because radio waves propagate irrespective of national borders, the use of a portion of the spectrum in one geographic area may affect the ability to use the same portion in other areas by causing harmful interference. Spectrum therefore needs to be managed at national and international levels.
ITU’s role, through its Radiocommunication Sector (ITU-R), is to ensure the rational, equitable, efficient and economic use of the radio-frequency spectrum by all radiocommunication services, including satellite services, in particular by avoiding and eliminating harmful interference. The global allocation of frequency bands by ITU allows all radiocommunication services to co-exist without interference.
For this purpose, the radio-frequency spectrum is divided into frequency bands which are allocated to radiocommunication services in such a way that each band may be used only by services which can co-exist with each other. These allocations and the procedures ensuring the international recognition and protection from interference of spectrum uses in each country and in Space are contained in the ITU Radio Regulations (RR). The RR is an international treaty ratified and applied by all ITU Member States. It has been in force since 1906 and is updated every four years by the ITU World Radiocommunication Conferences (WRCs) to take into account the evolution of technologies and spectrum uses.
Every satellite, every aircraft, or ship, every television or radio station, every mobile device, every defence, air traffic or maritime radar, uses a certain frequency band as prescribed by the Radio Regulations (RR).
The global allocation of frequency bands by ITU allows all radiocommunication services to co-exist without interference. It gives all stakeholders, including those involved in 5G development, the certainty that these bands will be available for use and protected in all countries in the foreseeable future. In other words, it provides certainty for long-term investments, which is the basis for the sustainable development of the ecosystem.
In addition to reducing interference, the benefits of harmonized spectrum include facilitating economies of scale, helping build markets, enabling global roaming and reducing the cost and complexity of equipment design.
As part of the four-year process of studies and preparations for the ITU World Radiocommunication Conference 2019 (WRC-19), global stakeholders are working towards building consensus to allocate and identify additional spectrum for International Mobile Telecommunications (IMT – the generic term used by ITU to designate 2G, 3G, 4G, 5G and future generations of mobile broadband services) during that conference.
…………………………………………………………………………………………………………………………………………………………………………………………
Editor’s Note: Spectrum Allocation and Channeling Options:
While spectrum allocations are defined in the RR, which has the authority of being an international treaty, the various channeling options and their resulting “bands” are considered mainly by the ITU-R Study Groups, (in this case ITU-R Study Group 5), and the results are issued as ITU Recommendations. Such Recommendations or standards are not compulsory, however, as they are developed with the participation of all sectors of the industry and approved by ITU Member States, they play a key role in determining which channel arrangements are adopted in a given region or country. ITU strives to achieve worldwide harmonization of these channel arrangements, to the universal benefit of industry and users, but in some cases this goal is not able to be fully realized.
The ITU World Radiocommunication Conference 2019 (WRC-19) to be held in Sharm el-Sheikh from 28 October to 22 November 2019 is expected to further allocate and identify spectrum for IMT. See Editor’s Note on IMT 2020 Frequency Bands below.
…………………………………………………………………………………………………………………………………………………………………………………………
Like previous generations, 5G networks will generate electromagnetic fields. Exposure of the public to these fields is subject to international and national regulations. The World Health Organization (WHO) sets the recommended limits. ITU collaborates with WHO to provide guidance and recommendations regarding the monitoring and compliance of radio installations with these limits.
ITU has a rich history in the development of global standards for mobile communications. The framework of standards for international mobile telecommunications (IMT) spans 3G and 4G industry perspectives and will continue to evolve as 5G with IMT-2020.
In early 2012, ITU initiated the development of “IMT for 2020 and beyond”, setting the stage for 5G research activities and establishing the requirements and vision for 5G. Under ITU’s IMT-2020 programme, ITU membership is developing the international standards to achieve well-performing 5G networks.
IMT 2020 Deployments:
The first full-scale commercial deployments for 5G are expected shortly after IMT-2020 specifications are finalized at the end of 2020. Regulators around the world are already auctioning licenses to operate 5G networks in the frequency bands allocated by ITU and identified or expected to be identified for IMT.
……………………………………………………………………………………………………………………………………………………………………………………………………
Editor’s Note on IMT 2020 Frequency Bands:
Frequency arrangements for frequency bands identified before WRC-15 are incorporated in Recommendation ITU-R M.1036-5. Work on frequency arrangements for the frequency bands that were identified by WRC-15 is currently ongoing in ITU-R.
Recommendation ITU-R M.2083 indicates a need of higher frequency bands to support the different usage scenarios with a requirement of several hundred MHz up to at least 1 GHz bandwidth corresponding wider and contiguous spectrum ability. Further, the development of IMT‑2020 is expected to enable new use cases and applications associated with radio traffic growth.
What frequency bands are under study for the implementation of IMT 2020 (5G)?
The following bands, which are already allocated to mobile, will be studied with a view to an IMT-2020 (5G) identification:
• 24.25 – 27.5 GHz • 37 – 40.5 GHz
• 42.5 – 43.5 GHz • 45.5 – 47 GHz
• 47.2 – 50.2 GHz • 50.4 – 52.6 GHz
• 66 – 76 GHz • 81 – 86 GHz
The following bands will also be studied, although they do not currently have global mobile allocations:
• 31.8 – 33.4 GHz
• 40.5 – 42.5 GHz
• 47 – 47.2 GHz
The results of the studies will be submitted for decision to the next ITU World Radio Conference (WRC-19), to be held from 28 October to 22 November 2019 in Sharm el-Sheikh, Egypt.
…………………………………………………………………………………………………………………………………………………………………………
The bandwidth capability of the IMT 2020 RIT/SRIT is defined for the purpose of IMT–2020 evaluation. The requirement for bandwidth is at least 100 MHz. The RIT/SRIT shall support bandwidths up to 1 GHz for operation in higher frequency bands (e.g. above 6 GHz).
………………………………………………………………………………………………………………………………………………………………………….
The Path Forward for ITU:
ITU standards (officially called “recommendations”) are supporting networking innovations such as software-defined networking, network virtualization, information-centric networking and advanced fronthaul and backhaul. These innovations will play a key role in making 5G networks faster, smarter and more cost-effective. These ITU standards are also enabling telecommunication companies to provide innovative services as they adapt to shifting customer needs in an era of great change. These standards for software-driven networking innovation are expected to achieve their full potential in the 5G environment.
This standard-setting process unites governments, regulators, mobile operators, manufacturers, industry organizations, academia and other standardization bodies from around the world, to support the development of 5G applications in the areas of network reliability and stability, cybersecurity, data privacy, the analysis of Big Data, energy efficiency and Artificial Intelligence to enhance the efficiency of 5G networks.
ITU’s adoption of the IMT-2020 standards will provide investors in 5G networks with the assurance that these standards will be applied universally, bringing economies of scale, and thus demonstrating the benefits of global harmonization.
Editor’s Comment:
We certainly hope this will happen, but with so many wireless telcos deploying pre IMT 2020 standard 5G networks this goal will be very difficult to realize.
………………………………………………………………………………………………………………………………………………………….
References:
https://www.itu.int/dms_pub/itu-r/opb/rep/R-REP-M.2410-2017-PDF-E.pdf
https://www.itu.int/en/ITU-R/Documents/ITU-R-FAQ-IMT.pdf
Relevant links
- ITU towards “IMT for 2020 and beyond”
- IMT Vision – Framework and overall objectives of the future development of IMT for 2020 and beyond
- Working Party 5D, IMT-2020 Background
- ITU World Radiocommunication Conferences
- 5G Basics
- Setting the Scene for 5G: Opportunities & Challenges
- ITU News Magazine on 5G
- ITU standardization work on Artificial Intelligence and 5G
- ITU activities on electromagnetic fields
- ITU flyer on electromagnetic fields
- ITU News blog on standards for IMT-2020
- ITU News blog on 5G security
- ITU News blog on the ITU’s work in 5G
- ITU News blog on energy efficiency and 5G
- WHO factsheet on electromagnetic fields and public health
