

JEDEC Forum: AI/ML for IoT; LP-WANs & Mediatek’s SoC Solutions – Part I.
Introduction:
Several new ideas, concepts and forecasts were made at JEDEC’s Mobile & IOT Forum on March 26, 2018 in Santa Clara, CA. In particular:
- Artificial Intelligence/Machine Learning/Deep Learning will have a huge, positive impact on control of IoT devices (2 presentations summarized);
- 3GPP specified NB-IoT is a strong contender among the many Low Power Wide Area Networks (LPWANs) for IoT;
- New and different IT requirements at the network edge are needed to provide the low latency needed for real time control of IoT devices;
- MIPI Alliance specifications for Mobile and IoT were presented and MIPI’s role explained.
In this first of a two part event summary we provide highlights of the first two keynote speeches at the conference. In part II, we’ll look at more aspects of AI, MIPI, and the new IT requirements for the intelligent network edge as suggested by Lenovo.
Discussion of Selected Keynote Presentations:
- Signs of Intelligent Life: AI Simplifies IoT
In his opening keynote presentation, Stephen Lum of Samsung said that some IoT industry vertical device volumes have seen an explosion of demand due to the introduction of Artificial Intelligence into their usage model. The connection and control of those devices is driving tremendous data traffic volumes into the cloud where the AI/ML/DL actually takes place. For example, the Amazon Echo and Google Home connected device control has all voice recognition, language understanding, AI/ML/DL done in cloud resident data center compute servers owned and programmed by Amazon and Google, respectively. Autonomous vehicles will also have AI/ML/DL done in the cloud but likely at the network edge to provide ultra-low latency.
Stephen stated that a simple thesis of deep learning is that the more data used to train neural networks, the smarter the AI becomes. Some of his other cogent data points were the following:
- New AI chips are being designed to efficiently process deep neural networks.
- Solid state memory needs to keep pace with processors to prevent bottlenecks. See bullet points below for UFS.
- Scalability becomes more critical as consumers adopt new services.
- Universal Flash Storage (UFS) is a high performance, scalable interface for storage at the edge of the network.
- UFS combines the key features of eMMC (embedded Multi-Media Controller) and SSDs (Solid State Drives).
- UFS Card brings benefits to a removable storage form factor.
The diverse needs of three IoT industry verticals were said to be as follows:
- Wearables (e.g. smart watches, fitness trackers, etc): Low power, Low density, Specialized form factors.
- Smart Home (AKA Connected Home): Low cost, Low to mid density, Low to high bandwidth –depending on the device to be analyzed and/or controlled, 2-5 years longevity.
- Automotive (more than just autonomous vehicles): High bandwidth, High density, Very high reliability, 7-10 years longevity.
Summary:
- Artificial Intelligence is enabling more innovative real-time services to be delivered to consumers.
- AI in the Cloud simplifies edge devices, encourages their adoption with low cost of entry.
- Autonomous vehicles, cannot be Cloud dependent, will become AI servers on wheels.
- JEDEC has enabled tremendous advances in memory while expediting quick adoption and provides a firm foundation for memory-related ecosystems
……………………………………………………………………………………………………………………..
- Opening a New Era of IoT -Opportunities and Solutions
Note: I related best to this presentation at it was the only one dealing exclusively with the network aspects of IoT.
Harrison Hsieh of Mediatek said at the beginning of his excellent presentation that we should look at the network required for IoT based on whether the devices/ end points were indoors or outdoors.
Let’s first look at an IoT indoor application presented by Mr. Hsieh:
Challenges of Smart Home (e.g. kitchen management, living room control, home heating/cooling/climate control, entertainment device control, security/surveillance, etc.):
- Uncovered Zone: Bad connection, No signal, Dead end
- Different Protocols (and wiring or wireless): Kitchen, Living room, Lighting, Climate control, Surveillance
Whole home IoT coverage requires Adaptive Networking which includes: Easy Setup/Configuration, Network Healing (after failure detection), Fast Roaming, Beam/Frequency Band Steering, Smart QoS, and Solid Security.
According to MediaTek, the IoT home system should be: Easy to Use, Have a unified protocol, be intuitive to install, have a single ecosystem with a user friendly interface (e.g. plug and play).
Harrison said that MediaTek’s Human to Machine interface solutions will focus on Hands-Free Voice Controlled Applications which are intuitive to configure and control diverse devices. We strongly agree!
Next, the outdoor IoT applications face many challenges today, including:
a.] Complicated Technologies:
• Unlicensed Wireless (e.g. LoRa WAN, Sigfox, etc)
• Proprietary Technologies (too many)
• Complex Deployment
b.] Limitation of Signal Coverage:
• Low Penetration Capability (trees, buildings/walls, etc)
• Limited Range with Single Base Station
c.] High Power Consumption:
• Legacy Technologies
• Not Dedicated or purpose built for outdoor IoT design (except for SIgfox and LoRA WAN, maybe LTE Category M/M1?)
Low Power Wide Area Networks (LPWANs) for IoT [1.] need a dedicated solution, which Mediatek believes is 3GPP’s NB-IoT. They think it’s the clear winner when compared to other LTE standards, including LTE Category M/M1 which many carriers are using today for IoT applications.
In particular, LTE NB-IoT R14 [2] was said to offer the following attributes:
- System Bandwidth of 200kHz
- Down Link Peak Rate of 127kbps
- Up Link Peak Rate of 18kbps(ST) / 158kbps(MT)
- Link Budget (power consumption) of 164 dB
- Low Memory Requirement (especially compared to other LTE standards)
- Half Duplex mode
- Battery life measured in years rather than days or weeks
Other advantages of LTE NB-IoT R14 include:
- Location Accuracy (UTDOA/OTDOA)
- Mobility Enhancement (Cell Reselection)
- High Data Rate (Supports FOTA or firmware updates over the air)
………………………………………………………………………………………………………………..
Note 1. Market for LPWANs:
LPWANs will be the world’s fastest-growing connectivity technology through 2025, supporting 4 billion IoT devices by that date, according to market tracker ABI Research.
“We expect to have more than 100 million NB-IoT connections on our network by 2020,” said Xiaotian Chen, general manager of China Unicom’s IoT group, said in a Cisco press statement.
China Mobile reported at MWC 2018 that it has launched NB-IoT networks in 346 cities using chipsets from five companies — Huawei, Mediatek, Qualcomm, RDA, and ZTE. The carrier has approved for use on its network 15 NB-IoT modules using the chips, according to a report from TechInsights analysts at the MWC 2018 event.
China Telecom, gave an update on its aggressive deployments of NB-IoT at a U.S. the MWC Americas event last September.
In the U.S., T-Mobile, Sprint and Verizon plan to deploy NB-IoT with T-Mobile’s offering planned for 2018 with the others to follow.
……………………………………………………………………………………………………………………..
Note 2. 3GPP’s LTE NB-IoT R14 briefly explained:
In 3GPP LTE Release 13, Narrowband Internet of Things (NB-IoT) was specified for providing wide-area connectivity for massive machine-type communications for IoT.
In 3GPP LTE Release 14, NB-IoT was further developed to deliver an enhanced user experience in selected areas through the addition of features such as increased positioning accuracy, increased peak data rates, the introduction of a lower device power class, improved non-anchor carrier operation, multicast, and authorization of coverage enhancements.
According to MediaTek, 3GPP Release 14 imbues essential features for NB-IoT mobile applications such as:
- Location accuracy via just modem (UTDOA/OTDOA)
- Mobility enhancements from seamless cell re-selection
- Push-to-talk voice messaging services
- Higher efficiency by lowering power consumption for wearables
- Supports massive industrial or city-wide deployments with multicast
……………………………………………………………………………………………………………
Summary of Mediatek’s IoT LPWAN Solution:
• Global Oriented NB-IoT Solution:
– Support NB1 (Rel.13) & NB2 (Rel.14) Global Bands (450Mhz – 2.1Ghz)
– Latest NB2 Modem Technology (Position allocation/Higher Data Rate/Cell Reselection)
• Highly Integration with Low Power Design:
– Leading SoC integrated design with Small form factor
– Rich I/Os for various application
– Optimized low power design in One-time battery
• Comprehensive Product Portfolio:
– Combination with MediaTek Connectivity technologies
– Integrated and matured Software offerings
In closing, Harrison predicted that the IT user interface will change from keyboard to voice (it already has for this author on his smart phone and tablet) while NB-IOT market will “take off in 2019-2020” timeframe.
Mediatek’s System on a Chip (SoC) connectivity solutions are targeted at the home, on the move (mobile) and in the cloud.
……………………………………………………………………………………………………….
Part II. of this event summary was published on March 29, 2018 at https://techblog.comsoc.org/2018/03/29/ai-deep-learning-new-it-requirements-for-edge-computing-mipi-alliance-for-mobile-and-iot/
……………………………………………………………………………………………………………………………………………………………………………………………………
References:
https://labs.mediatek.com/en/blog/IoT-tech-comparison-and-vision
MediaTek targets “huge” NB-IoT opportunity – Mobile World Live
https://www.eetimes.com/document.asp?doc_id=1333023
https://www.nickhunn.com/13-companies-announce-nb-iot-chips/
https://www.eetimes.com/document.asp?doc_id=1332311
https://www.link-labs.com/blog/overview-of-narrowband-iot
Many Technologies Must Deliver For IoT To Deliver
Internet of Things or IoT aims to connect interrelated computing, mechanical and digital machines to a common platform. The devices will connect to each other as well as to the humans and will collect information about their environments by sensors. The number of such devices could touch 20 billion by 2020 as per Gartner. As per International Telecommunication Union number of humans using internet is 3.2 billion. In the emerging digital world, connected devices or things would overwhelm the humans.
The impact of IoT would be unprecedented. Home appliances could be remote controlled and warnings of faults would be available on time. In industries, control of various devices in the factories will shift from factory floor to the control rooms. Autonomous cars will predictive maintenance needs would become norm and their safety and fuel efficiency will improve. This will apply to other modes of transport too. Smart meters will synchronize demand supply curves and reduce distribution losses. Smart cities would emerge which would have improved services, less traffic congestion, better conservation of water and energy, and improved quality of life. The chances of predicting onset of certain diseases and successfully managing them after patient catches them will improve. The list is endless.
The key characteristic of IoT is the amount of data. IDC’s Digital Universe study predicts the world’s data will rise from 4.4 Zettabytes (10^21 bytes) in 2013 to 44 by 2020, 10% of this will be from the IoT. By 2025, it would touch 180 Zettabytes. In some cases, the data generated by individual device would be enormous e.g. self driving car from Google generates 2 Petabytes (10^15 bytes) of data in a year. Besides, the proportion of data that can be analyzed will also increase from 22% in 2013 to 35% in 2020, driven by IoT.
Cloud
Cloud is often considered as an innovation to business models as it allows companies to outsource their storage and computing needs, while they focus on their core competencies. However, with IoT it is technology enabler. If all IoT devices need to store and process their own data this will make IT a significant part of such devices, forcing change in assembly line processes as well significantly increasing their maintenance costs. One way to reduce these entry barriers for adoption of IoT is to use cloud for storing and computing needs. The cloud infrastructure will allow for analysis besides efficient storage. However current capacities of cloud providers will be challenged. As per the website www.statista.com, the capacity of data centres offering public cloud was 465 Exabytes(10^18 bytes) in 2017. The scale up needed to accommodate IoT is massive. Currently, hard disks and magnetic tapes capable of storing data in Terabytes (10^12 bytes) are available. However, as data will increase exponentially, cloud providers will need to work on other storage technologies e.g DNA, HVD etc
5G telecom network
This data will generate network traffic. IoT cannot deliver its promise on existing networks and it needs a a network with much higher speed, low latency and consistent performance. Rollout of 5G network is critical for widespread adoption of IoT. The proposed speed is 20 Gbits/sec as compared to 100 Mbits/sec for 4G networks. This would be accompanied by limits on user experienced speeds i.e per-user download speed of 100Mbps and upload speed of 50Mbps rather than just the theoretical maximum, lower latency at 4 ms, support for higher device densities at 1 million connected devices per square kilometer etc. These parameters are specially targeted for IoT. Conversely, IoT is an important use case of 5G networks to justify the investments. Some applications of IoT e.g. driverless vehicles not only need to transfer huge amount of data but also with minimal latency as delays could be dangerous, for a car needs to make real time decisions to avoid accidents. The latency of 4G was at least an order of magnitude worse and hence incapable of supporting driverless cars.
Fog computing
This latency issue will also warrant change in cloud paradigm. One way to analyze IoT data is near the devices that produce it and act on that data, referred to as Fog computing. The fog nodes, can be deployed anywhere with a network connection e.g. on a factory floor, on top of a power pole, , in a vehicle, or on an oil rig. This reduces bandwidth pressure on the long distance network and can handle cases where latency is critical. The percentage of devices that need computing power near to themselves will increase in future.
Analytics and Machine Learning
Data needs analysis. Big data algorithms hosted in cloud are needed for this analysis as data would come in various formats, huge volume and needs to be processed at fast speeds so that it could to be useful. But one of the proclaimed benefits of IoT is in predictions. Here Machine Learning (ML) could play a critical role. ML is defined as the ability of a machine to vary the outcome of a situation or behavior based on knowledge or observation which is essential for IoT solutions. ML could allow useful patterns, correlations and anomalies to be searched. It can also predict unknown outcomes. Different ML algorithms will need to be “trained’ for different use case of IoT
Security and Privacy
Security and privacy issues are significant hurdles to IoT penetration. The IoT devices will be always on and connected bringing new challenges to security. They will be additional challenges due to number of devices involved for which security measures will need constant upgrades.
In 2013, a hacker got access to credit card information of customers of Target by using network credentials taken from a heating, ventilation, and air conditioning vendor. 2015, 2 researchers demonstrated a wireless hack into Jeep Cherokee, first taking control of the entertainment system and windshield wipers, and then disabling the accelerator.
There is additional issue of privacy as huge amount of personal data would be captured by IoT devices which could be hacked or intentionally used for business purposes.
Batteries
IoT devices will need battery power to remain always connected. New wireless standards such as Bluetooth® Smart (also known as “BLE”) or zigbee reduce battery consumption and allow coin cell batteries to be used. But the sheer numbers have led to exploration of an alternative approach called Energy Harvesting (EH). Also called power harvesting it is a technology that aims at collecting energy from ambient external sources such as heat, light, vibrations, radio waves etc. It produces very low power levels on the order of several microwatts (10-6W) to milliwatts (10-3W) but that is enough for sensors that are battery optimized.
Summary
IoT will impact every aspect of our lives, including our homes, offices, cars and even our bodies. It will bring structural changes in global economy and as per McKenzie may generate upto $6.2 trillion in value by 2025. However many technologies need to deliver their expectations for IoT to deliver its promise
Disclaimer: The views expressed in the article above are those of the authors’ and do not necessarily represent or reflect the views of this publishing house. Unless otherwise noted, the author is writing in his/her personal capacity. They are not intended and should not be thought to represent official ideas, attitudes, or policies of any agency or institution.

Sandeep K Chhabra
Original post is at:
http://businessworld.in/article/Many-Technologies-Must-Deliver-For-IoT-To-Deliver/25-03-2018-144322/
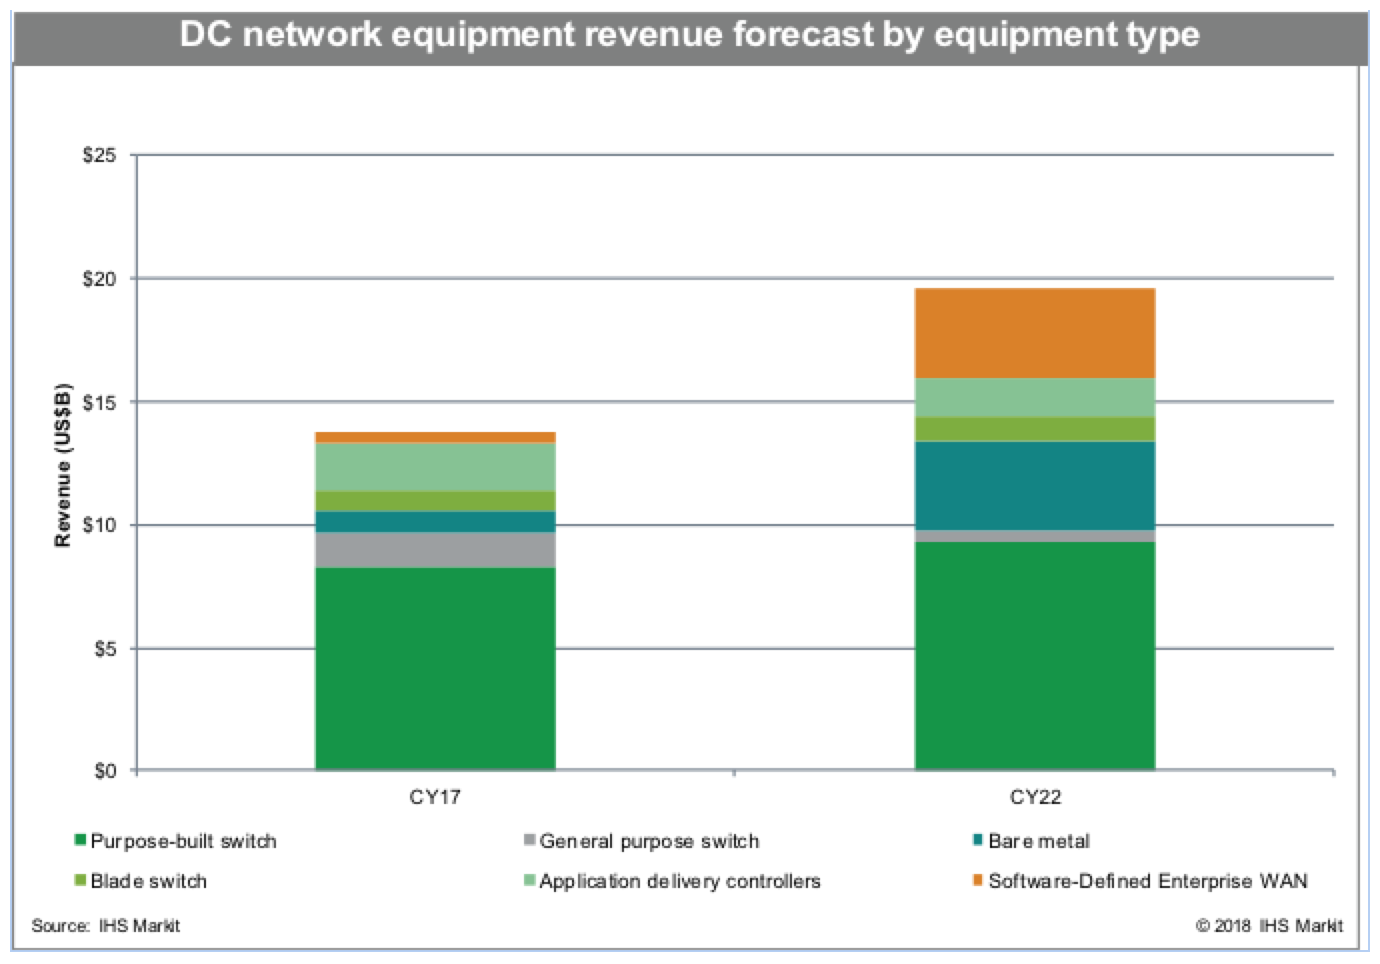
IHS Markit: Data center network equipment revenue reached $13.7 billion in 2017
Data center network equipment revenue, including data center Ethernet switches, application delivery controllers (ADCs) and software-defined enterprise WAN (SD-WAN), totaled $13.7 billion in 2017, increasing 13 percent over the previous year.
In the short term, investment in physical infrastructure is still driving data center network equipment revenue growth. However, in 2018 and 2019 the effect of server virtualization will slow the market, with fewer — but higher capacity — servers reducing the need for data center Ethernet switch ports, along with the move to virtual ADCs.
“The adoption of lower-priced bare metal switches will cause revenue growth to slow,” said Clifford Grossner, Ph.D., senior research director and advisor, cloud and data center research practice, IHS Markit. “The ongoing shift to the cloud not only moves network equipment out of the enterprise data center, but also requires less equipment, as the cloud represents data center consolidation on a wide scale.”
Data center network equipment highlights
- Data center network equipment revenue was on the rise, year over year, in all regions: North America and Europe, Middle-East and Africa (EMEA) each increased 10 percent in 2017; Asia Pacific (APAC) was up 23 percent; and Caribbean and Latin America (CALA) rose 2 percent.
- 25GE and 100GE data center switching ports increased three-fold year over year.
- New 200/400GE developments are underway, and shipments expected to begin in 2019.
- Long-term growth in the data center network equipment market is expected to slow to 6 percent in 2022, as SD-WAN revenue growth slows due to the migration from the enterprise dater center to the cloud.
- SD-WAN revenue is anticipated to reach $3.6 billion by 2022; the next wave for SD-WAN includes increased analytics, with artificial intelligence (AI) and machine learning (ML) providing multi-cloud connectivity.
Revenue results from key segments
- Data center Ethernet switch revenue rose 13 percent over the previous year, reaching $11.4 billion in 2017.
- SD-WAN market revenue hit $444.1 million for the full-year 2017.
- Bare metal switch revenue was up 60 percent year over year in the fourth quarter of 2017.
- ADC revenue was down 5 percent year over year in 2017.
Research synopsis
The IHS Markit Data Center Networks Intelligence Service provides quarterly worldwide and regional market size, vendor market share, forecasts through 2022, analysis and trends for data center Ethernet switches by category (purpose-built, bare metal, blade, and general purpose), port speed (1/10/25/40/50/100/200/400GE) and market segment (enterprise, telco and cloud service provider). The intelligence service also covers application delivery controllers by category (hardware-based appliances, virtual appliances), SD-WAN (appliances and control and management software), FC SAN switches by type (chassis, fixed) and FC SAN HBAs.
Vendors tracked include A10, ALE, Arista, Array Networks, Aryaka, Barracuda, Broadcom, Cavium, Cisco, Citrix, CloudGenix, Dell, F5, FatPipe, HPE, Huawei, InfoVista, Juniper, KEMP, Radware, Riverbed, Silver Peak, Talari, TELoIP, VMware, ZTE and others.
OCP – Linux Foundation Partnership Accelerates Megatrend of Open Software running on Open Hardware
“From 1876 to 2013 telecom and network equipment design was proprietary….We are now in the 3rd phase of open networking transformation,” said Arpit Joshipura, Linux Foundation GM of Networking at the 2018 OCP Summit. The network equipment design transformation is shown in the figure below:

During his OCP Summit keynote speech, Arpit announced a partnership between OCP and the Linux Foundation to further the development of software and hardware-based open source networking. The organizations will work together to create stronger integration and testing, new open networking features, more scalability, a reduction in CAPEX/OPEX, greater harmonization with switch network operating systems, and increased interoperability for network functions virtualization (NFV) network transformation.
Virtualization of network functions and the resulting disaggregation of hardware and software have created interest in open source at both layers. OCP provides an open source option for the hardware layer, and The Linux Foundation’s OPNFV project integrates OCP along with other open source software projects into relevant NFV reference architectures. Given this alignment, OCP and OPNFV already have been collaborating on activities such as plugfests and joint demos. Now they have committed to expanded collaborative efforts which will accelerate the megatrend of totally open networking.
“It’s exciting to see the principles of open source software development come to hardware, and OCP has already made a substantial contribution to some Linux Foundation project plugfests and demos,” said Arpit Joshipura in the referenced press release. “We see OCP as an integral partner as we explore new opportunities for NFV deployments, performance, features, and footprint. Global network operators agree and ranked OCP very high on a list of the most important projects for OPNFV in a recent survey. We look forward to continued and intensified collaboration across ecosystems.”
The key market disruptors- virtualization of equipment functions, software defined networking and disaggregation of equipment are shown below with the applicable software and hardware entities on the left, and sample open source projects on the right of the figure below.

Arpit said the drivers behind this huge move to open source software running on open source hardware are 5G and the Internet of Things (IoT). Mandatory automation of functions (e.g. provisioning and configuration) are (and will be) required to support the high speeds/low latency of 5G and the huge number of IoT endpoints.

The Linux Foundation Networking (LNF) group’s vision includes automating cloud services, network infrastructure, and IoT services as shown in this illustration:

The Linux Foundation Open Source Networking activities include participants from telecom carriers, cloud computing, and enterprises. As shown in the illustration below, 9 out of 10 of the most important projects of participants will use open source software with all 10 of the largest network equipment vendors actively involved and 60% of global subscribers represented. Shared innovation and a 15 minute “new service creation time” are selected goals of the LFN projects.

The .Linux Foundation is leading the way forward to harmonize open source software efforts and get them into the community. In the figure below, the services, software and infrastructure are shown on the left, the various open source projects are shown in the center, and the various standards organizations (but not the actual standards) are shown on the right. It should be duly noted that there are no official standards bodies working on open networking specifications to provide multi-vendor interoperability of exposed interfaces or even APIs within a single piece of equipment.
To clarify that point, Arpit wrote via email: “LFN (which hosts ONAP), is working on de-facto automation open source aspects independent of 5G/4G. The 5G services mandate automation due to IOT and new services that are coming up. The specific specs of 5G are out of scope for Networking Automation. OCP and LFN partnership is limited to what I spoke at the OCP Summit keynote.”

Note: There are more than 20 open source projects for networking currently active at the Linux Foundation (see above illustration). LF also has expanded lately into areas as diverse as software for IoT devices, storage and blockchain. It remains to be seen if the OCP – LNF partnership will create defacto standards (e.g. for virtualization of functions in 5G or IoT) or try to enforce interoperability through certification programs. The current motivation seems to come from carriers like AT&T which are demanding open source software on open source hardware to lower their CAPEX/OPEX and to improve automation of network functions.
…………………………………………………………………………………………………………………………………………………………………………………………………………………
Mr. Joshipura asserted that the LFN+OCP partnership would produce the very best of Open Source Software & Hardware. The total community collaboration will include: Hardware Vendors + Silicon Vendors + OEM/Manufacturers + Software Vendors, Systems Integrators + End Users.
…………………………………………………………………………………………………………………………………………………………………………………………………….
Arpit provided a strong conclusion via email:
“Open source networking software is creating de-facto platforms that result in faster innovation across many IT communities. Collaboration between the leaders in open hardware (OCP) and Open Source Software (Linux Foundation Networking) will help propel this even further and broaden the scope of true open networking. This industry collaboration allows faster deployment, but still offers innovation on top.”
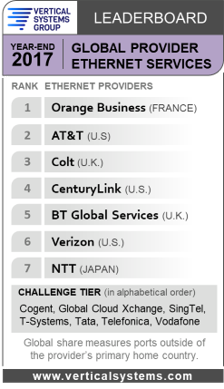
Vertical Systems Group 2017 Global Ethernet Service Provider Leaderboard
France’s Orange remained first while AT&T improved its position to second place in Vertical Systems Group’s (VSG) newly released 2017 Global Ethernet Leaderboard report. UK’s Colt was third while CenturyLink made its first appearance in the rankings finishing in fourth place. VSG said slim margins separated the leaders.
“With very slim margins separating the leading global service providers, Orange remains in first position, AT&T advances to second, and CenturyLink makes its debut,” Rick Malone, principal at Vertical Systems Group said in a press release. “To serve this specialized global market, key providers are increasing deployments of higher speed Ethernet connectivity to MPLS, VPLS and cloud services, while transitioning customers to more dynamic, advanced SDN-based hybrid WAN and SD-WAN offerings.”
VSG also noted that the Global provider Leaderboard companies that have received MEF 3.0 certification are AT&T, Colt, CenturyLink and Verizon. Challenge tier companies attaining the distinction are SingTel, T-Systems, Tata, Telefonica and Vodafone.
…………………………………………………………………………………………….
Last month, VSG said that CenturyLink, AT&T, Verizon, Spectrum Enterprise, Comcast, Windstream and Cox were, in that order, the top finishers in the U.S. Ethernet Leaderboard last year. The results are noteworthy because it was the first time since 2005 that AT&T did not finish as the leading provider.
References:
https://www.verticalsystems.com/2018/03/22/2017-global-provider-leaderboard/
Global Ethernet Service Provider Leaderboard: CenturyLink Makes its Debut
Korea Telecom to launch 5G service in March 2019 with what endpoints?
Korea Telecom (KT) announced today that it plans to offer 5G cellular service in March 2019, according to Yonhap and other news sources.
“It is true 5G only when coverage is guaranteed,” Oh Seong-mok, president of KT’s network business division, told reporters in Seoul. “KT will launch the 5G service for the first time in the world that combines true mobility, excellent service and nationwide coverage,” the KT executive added.
During this year’s PyeongChang Winter Olympics, KT offered a trial service of its 5G service for the first time in the world, allowing athletes and visitors to experience data transmission speeds 40-50 times faster than LTE.
Industry watchers said that at present, it is virtually impossible to set up a 5G nationwide network on par with existing LTE coverage, so full-fledged services will invariably be offered in major metropolitan areas first. Customers may not be able to immediately use KT’s 5G service next year because major makers of smartphones and silicon, including Samsung Electronics Co. and Qualcomm Technologies Inc., will only start shipping smart phones and 5G chip sets between the end of this year and the first half of 2019, KT said. Of course, those smart phones and silicon in them will not be compliant with the IMT 2020 standard which won’t be completed till late 2020.
Oh Seong-mok, president of KT’s network business, speaks at a press conference at the firm’s Gwanghwamun building in downtown Seoul, Thursday, stressing the firm will launch commercial 5G network services early next year based on its successful provision of the 5G trial service at the PyeongChang Winter Olympics. / Courtesy of KT
……………………………………………………………………………………………………………………………………………………………………………………………………
KT said it has no plans to commercialize its 5G network based on Fixed Wireless Access (FWA) currently being championed by U.S. mobile carrier Verizon which plans to provide fixed 5G with an FWA system in the first half of this year. Mr. Oh said commercializing the 5G service based on FWA is a step backward as the technology has already been seen before. That comment comes after KT collaborated with Verizon on 5G video calling tests during last month’s Super Bowl, illustrating the fierce international competition to bring 5G to market first.
References:
http://english.yonhapnews.co.kr/news/2018/03/22/0200000000AEN20180322007500320.html
http://koreabizwire.com/kt-aims-5g-commercial-launch-in-march-2019/114895
https://www.koreatimes.co.kr/www/tech/2018/03/133_246024.html
AT&T asks FCC to prohibit 6 GHz band for unlicensed use
AT&T is asking the Federal Communications Commission (FCC) to avoid any expansion of the 6 GHz band to unlicensed users, noting that roughly 25% of the links in the band support public safety and critical infrastructure licensees. AT&T said that band contains about 100,000 microwave links, many of which are carrying critical voice and data traffic, including for the nation’s first responders. AT&T added that introducing unlicensed devices would cause interference at the receive antennas of those microwave links, thereby reducing their reliability.
The telco estimates 27% of the links support utilities, making the upper and lower 6 GHz bands key in supporting the nation’s critical infrastructure. It also said that maintaining long-haul and high-reliability microwave links will be critical for 5G and other advanced services.
AT&T officials met last week with FCC staff to discuss its concerns about a proposed expansion of the 5.9125-7.125 GHz band to include unlicensed use. AT&T said it will be relying on a significant number of existing and newly developed 6 GHz fixed links in support of FirstNet [1.], where it’s contractually obligated to provide high levels of reliability.
Note 1. FirstNet is the first nationwide U.S. wireless network dedicated to public safety. AT&T won the contract to provide the wireless network for FirstNet last year.
AT&T’s letter to the FCC was made public in an ex parte filing.
References:
https://ecfsapi.fcc.gov/file/10319087261781/6GHz-ExParte031618.pdf
https://www.fiercewireless.com/wireless/at-t-says-6-ghz-band-key-for-firstnet-5g
Will the FCC Amend Rules for Small Cells on March 22nd? 2 Cities Express Concern!
The FCC is due to vote on exempting small cell installations from certain federal reviews on March 22, 2018. The CTIA-commissioned analysis by Accenture Strategy found that when such reviews are required, almost a third of the cost of next-generation wireless deployments go to federal regulatory reviews that the FCC now proposes to eliminate as unnecessary. These reviews cost industry $36 million in 2017, and are expected to increase over six-fold in 2018.
Backgrounder: To keep up with increasing demand for wireless data and build out 5G networks, the wireless industry needs to deploy hundreds of thousands of modern wireless antennas – small cells – in the next few years. Small cell deployments will escalate rapidly from roughly 13,000 deployed in 2017 to over 800,000 cumulatively deployed by 2026, according to the analysis.
Small cells are similar in size to a pizza box and can be deployed on streetlights or utility poles in about one hour. However, under rules that were designed decades ago for 200-foot cell towers, getting necessary federal and local permissions can take over a year and require multiple, duplicative reviews including federal environmental and historic preservation reviews.
The FCC’s new rules would modernize the historic and environmental regulatory requirements for wireless deployments, exclude small cells from certain federal regulatory hurdles, and adopt a “shot clock” for FCC review of environmental assessments when required. The analysis found that the U.S. will see a 550% increase in small cells year over year in 2018, underscoring the need for FCC action now to jumpstart more broadband investment.
………………………………………………………………………………………………………………………………………….
From the March 1, 2018 FCC fact sheet:
Background:
As part of the FCC’s efforts in the Wireless Infrastructure docket to streamline the deployment of next-generation wireless facilities, the agency has been attempting to identify instances in which regulatory review imposes needless burdens and slows infrastructure deployment. As part of that effort, the Commission has consulted extensively with Tribal Nations, intertribal organizations, state and local historic preservation officers, wireless carriers, network builders, relevant federal agencies, and many others to determine the steps the Commission needs to take to enable the deployment of 5G networks throughout America.
This Order focuses on the types of deployments that are subject to National Historic Preservation Act (NHPA) and National Environmental Policy Act (NEPA) review, and it reexamines and revises Commission rules and procedures for such deployments.
What the Second Report and Order Would Do:
o Amend Commission rules to clarify that the deployment of small wireless facilities by private parties does not constitute either a “federal undertaking” within the meaning of NHPA or a “major federal action” under NEPA, meaning that neither statute’s review process would be mandated for such deployments. Small wireless facilities deployments would continue to be subject to currently applicable state and local government approval requirements.
o Clarify and make improvements to the process for Tribal participation in Section 106 historic preservation reviews.
o Remove the requirement that applicants file Environmental Assessments (EAs) solely due to the location of a proposed facility in a floodplain, as long as certain conditions are met.
o Establish timeframes for the Commission to act on EAs.
………………………………………………………………………………………………………………………………………
However, San Jose, CA, in the heart of Silicon Valley, and Lincoln, NE, an innovative university and capitol city, both could be profoundly affected if the FCC decides to “cut red tape” with modifications to small cell antenna deployment rules. Local city officials argue the regulatory process serves an important purpose. “By removing the historic and environmental review, and taking away local control, it won’t allow cities to make sure that 5G is deployed in an equitable manner for citizens,” said Shireen Santosham, the chief innovation officer for the city of San Jose. San Jose is the tenth largest city in the U.S., the largest in Silicon Valley and has a median income that is over $90,000, but has approximately 9.5 percent of the city’s 1 million residents living below the poverty line. “Currently there are more than 100,000 people in our city who do not have broadband,” she said. “Small (5G) cells will not solve the digital divide; we need to know that there will be service to rural and low-income areas,” Santosham added.

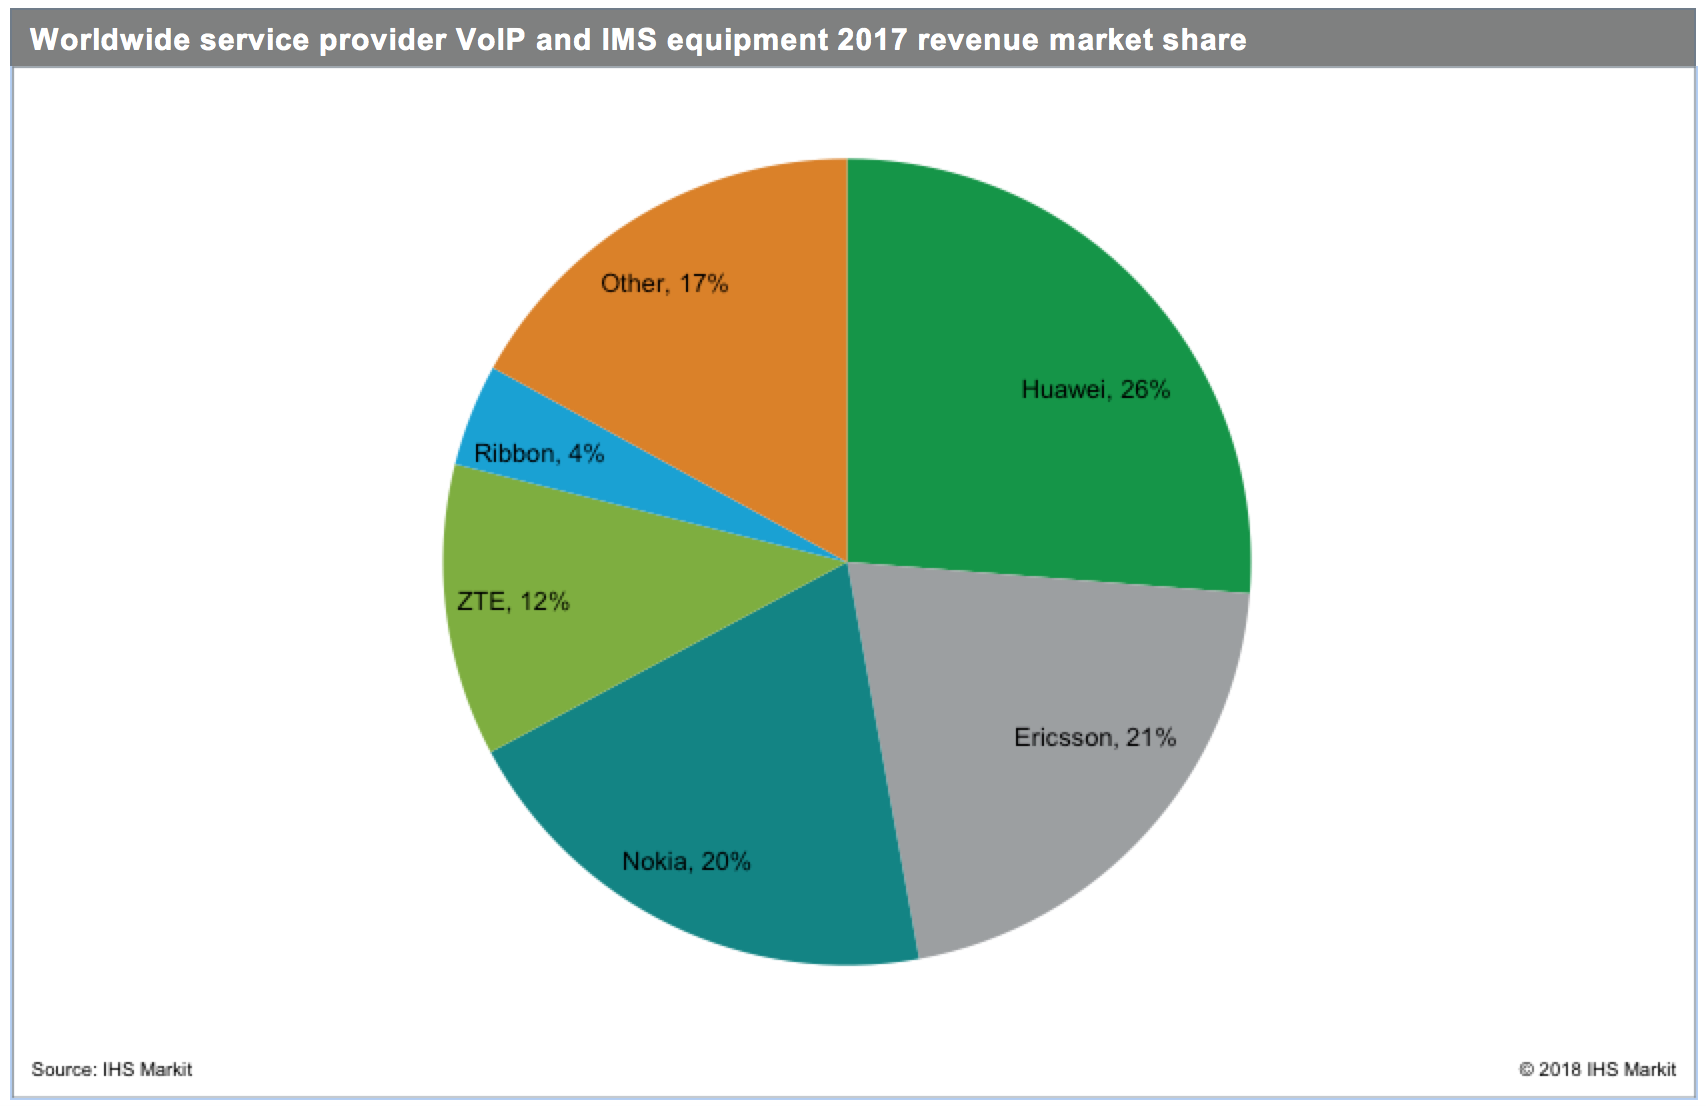
Service Provider VoIP and IMS -12% YoY in 2017; VoLTE Deployments Slowing
Following are highlights from the first quarter 2018 edition of the IHS Markit Service Provider VoIP and IMS Equipment and Subscribers Market Tracker, which includes data for the quarter ended December 31, 2017. Author is IHS Markit analyst Diane Myers.
Global service provider voice over Internet Protocol (VoIP) and IP multimedia subsystem (IMS) product revenue fell to $4.5 billion in 2017, a decline of 12 percent year over year. Overall worldwide revenue is forecast to decline at a compound annual growth rate (CAGR) of 3 percent, falling to $4 billion in 2022. This decline is due to the slowing of voice over LTE (VoLTE) network deployments and overall spending falling into a steady pattern. Downward pricing — because of continued competitive factors and large deal sizes in India, China and Brazil — is also dampening growth.
“The big story over the past four years has been mobile operators and the transition to VoLTE, which has been the number-one driver of VoIP and IMS market growth, along with voice over WIFI (VoWiFi) and other mobility services,” said Diane Myers, senior research director, VoIP, UC, and IMS, IHS Markit. “However, after initial VoLTE network builds are completed, sales growth drops off, as operators launch services and fill network capacity,” she added.
Huawei was the standout vendor in the VoIP and IMS market, with 26 percent of worldwide revenue in 2017. Ericsson ranked second, with 21 percent, followed by Nokia, ZTE and Ribbon Communications.
Service provider VoIP and IMS market highlights
- As large VoLTE projects in India and China continued to expand, the Asia-Pacific region ranked first in global revenue in 2017, accounting for 37 percent of the market. Spending from VoLTE projects in Asia-Pacific and Caribbean and Latin America continue, but it is not enough to move the worldwide market back into growth territory, primarily due to price compression in both regions.
- As of January 2018, 119 operators launched commercial VoLTE services, with more coming every year. However, new launches are slowing. Most VoLTE launches in 2017 occurred in Europe. There was also some expansion in Chinese provinces, due to growth from China Mobile; in Brazil, with Vivo; and in India, with Bharti Airtel.
Service Provider VoIP and IMS Equipment and Subscribers report synopsis
The quarterly Service Provider VoIP and IMS Equipment and Subscribers Market Tracker from IHS Markit provides worldwide and regional vendor market share, market size, forecasts through 2022, analysis and trends for trunk media gateways, SBCs, media servers, softswitches, voice application servers, HSS, CSCF and IM/presence servers.
New Southeast Asia-Japan 2 Cable to Link 9 Asian Countries
A consortium of Asia-Pacific network operators has contracted NEC Corp. to build a 10,500km subsea cable which will connect Singapore, Thailand, Cambodia, Vietnam, Hong Kong, Taiwan, mainland China, Korea and Japan. The Southeast Asia-Japan 2 cable (SJC2) will be built and operated by a consortium including China Mobile International, Chunghwa Telecom, Chuan Wei, Facebook, KDDI, Singtel, SK Broadband and VNPT. The eight fiber pair cable will have a total capacity of 144Tbps. Construction of the cable is expected to be completed by the fourth quarter of 2020.
“The construction of SJC2 cable is timely and will provide additional bandwidth between Southeast and North Asia, whose combined population of more than two billion are driving demand for data as their economies undergo digital transformation,” Singtel VP for carrier services Ooi Seng Keat said.
“As a new generation multimedia superhighway, the SJC2 can play a pivotal role in facilitating economic cooperation and digital innovation among the countries in this region. The construction of this cable reinforces Singtel’s position as the leading data services provider in the region and strengthens Singapore as a global business and info-communications hub,” Keat added.
China Mobile said in a statement it would be solely responsible for the landing stations in China and Hong Kong, with SJC2 complementing China’s Belt and Road Initiative, and this cable makes up one of seven investments the company has made into subsea cables.
Singtel has been investing in augmenting its international connectivity, including through the joint construction of the 9,000km INDIGO subsea cable linking Singapore with Perth and Sydney in Australia, and its involvement in the Southeast Asia-Middle East-Western Europe 5 (SEA-ME-WE 5) cable, which was completed in December 2016.

SJC2 submarine cable to connect 9 Asian countries
………………………………………………………………………………………………………………………………………….
In May, NEC demonstrated speeds of 50.9Tbps across subsea cables of up to 11,000km on a single optical fibre through the use of C+L-band erbium-doped optical fibre amplifiers (EDFA), amounting to speeds of 570 petabits per second-kilometre.
To hit those speeds, NEC researchers developed a multi-level, linear, and non-linear algorithm to obtain an optimisied 32 quadrature amplitude modulation (QAM) or opt32 constellation with a higher limit for non-linear capacity specifically for transmission across subsea cables.
NEC announced the completion of the 54Tbps Asia-Pacific Gateway cable in November 2016 between China, Hong Kong, Japan, South Korea, Malaysia, Taiwan, Thailand, Vietnam, and Singapore.
The cable is owned by China Telecom, China Unicom, China Mobile, NTT Communications, KT Corporation, LG Uplus, StarHub, Chunghwa Telecom, CAT, Global Transit Communications, Viettel, and VNPT.
References:
https://www.telecomasia.net/content/southeast-asia-japan-2-cable-link-9-markets
http://www.zdnet.com/article/nec-signed-to-build-southeast-asia-japan-2-cable/
………………………………………………………………………………………………………………………..
Related subsea cable construction:
Construction begins on Japan-Guam-Australia cable
https://www.telecomasia.net/content/construction-begins-japan-guam-australia-cable
