

Month: April 2022
MTN Consulting on Telco Network Infrastructure: Cisco, Samsung, and ZTE benefit (but only slightly)
By Matt Walker
Cisco, Samsung, and ZTE benefit most from Huawei bans in 2021 in the telco Network Infrastructure market. (However, the market share gains were miniscule= <1% for each network equipment vendor).
Introduction:
2021 results for the 100+ vendors selling into the telco market are just about finalized. Contrasting 2021 telco network infrastructure (NI) market share with 2020, we note the following NI Equipment Vendor Market Share Changes:
Cisco clearly came out on top, gaining 0.7% share in a market worth $231.4 billion (B). Cisco was helped both by a telco shift in 5G spending towards core networks, and Huawei’s entity list troubles.
Samsung’s share growth of 0.3% was due to a big win with Verizon and a growing telco interest in seeking RAN alternatives beyond Ericsson and Nokia. ZTE, which has escaped the US entity list to date, also picked up some unexpected 5G wins but its growth is more broad-based due to optical, fixed broadband, and emerging market 4G LTE business.
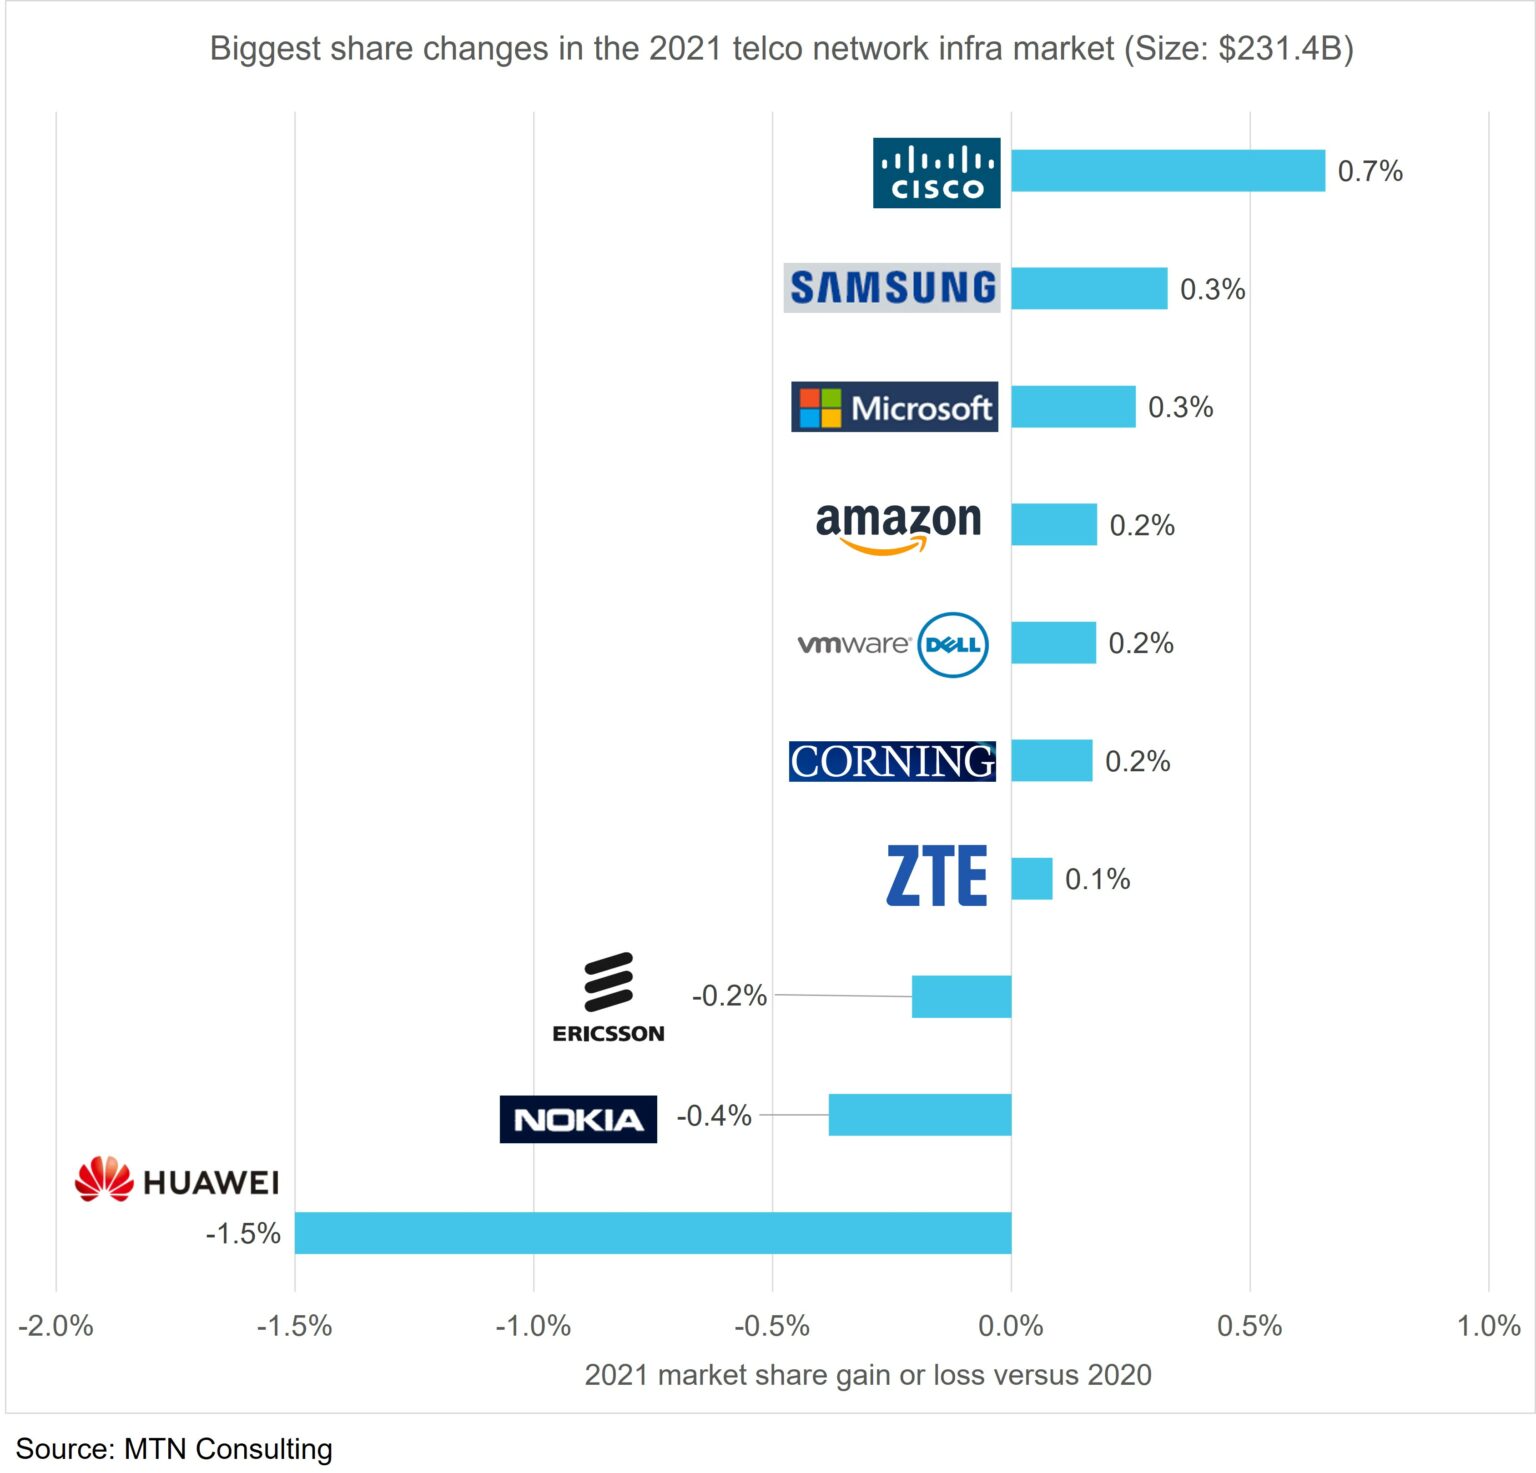
Dell (including VMWare), Microsoft, and Amazon also picked up share as telcos have begun investing in 5G core and cloud technologies. Their growth has little to do with Huawei, and more due to telcos’ ongoing changes to network architecture and service deployment patterns. Corning was an unexpected winner in 2021, gaining 0.2% share on the back of fiber-rich wireless deployments and government support for rural fiber builds.
On the flip side, both Nokia and Ericsson lost share in the overall telco NI market in 2021. Their RAN revenues benefited from Huawei’s troubles in 2020 but telco spending has since shifted towards product areas with more non-Huawei competition. Both vendors are attempting to diversify beyond the telco market, with Nokia so far having more success; its non-telco revenues grew 12% in 2021.
Huawei’s share of telco NI declined to 18.9% in 2021, down from a bit over 20% in both 2019 and 2020. The US Commerce Department’s entity list restrictions were issued in May 2019 but hit the hardest in late 2020 and 2021, after Huawei’s inventory stockpiles began running out.
Huawei’s messaging on its recent fall is muddled. During its annual report webcast yesterday, it cited three factors behind its 2021 revenue decline: supply continuity challenges, a drop in Chinese 5G construction, and COVID. In MTN Consulting’s opinion, supply continuity was the main factor. A related factor were the many government-imposed restrictions on using Huawei gear around the world, especially in Europe where 5G spending was strong in 2021. The other two factors cited by Huawei’s CFO, however, are misleading. Chinese telco network spending, overall, was relatively strong in 2021: total capex for the big three telcos was $52.8B, up 8% from 2020. Without this rise, Huawei’s 2021 results would have been worse. As for COVID, few other vendors cite the pandemic as a factor restraining 2021 telco spend. More vendors cite the opposite: 2021 spending was strong in part because telcos were forced to delay many projects during COVID’s early spread.
To date, Huawei’s troubles have impacted RAN markets the most, but in 2022 and 2023 will begin spreading more clearly to IP infrastructure, optical, microwave, fixed broadband, and other areas. A number of vendors are eager to pursue new opportunities as this happens, including Adtran/ADVA, Ciena, Cisco, CommScope, DZS, and Infinera. The CEO of Infinera, in fact, said on its 4Q21 earnings call that “it was a nice taste, a nice appetizer in 2021, but…we said all along that we would see the design wins and RFPs really scaling and we thought that we’d see revenues from that really beginning to take hold as we got into 2023.”
To date, Huawei has been unable to fully adapt to the supply chain restrictions put in place in 2019. It remains the global #1 in telco NI, however, due to dominance in China and a huge installed base across the globe. The company is investing heavily in carrier services & software, Huawei Cloud and new product areas. One certainty is that it won’t simply fade away, despite the current decline.
……………………………………………………………………………………………….
Editor’s Note:
In contrast, Dell’Oro estimates suggest the overall telecom equipment market advanced 7% in 2021, recording a fourth consecutive year of growth, underpinned by surging wireless revenues and healthy demand for wireline-related equipment spurred on by double-digit growth both in RAN and Broadband Access. Total worldwide telecom equipment revenues approached $100 B, up more than 20% since 2017.
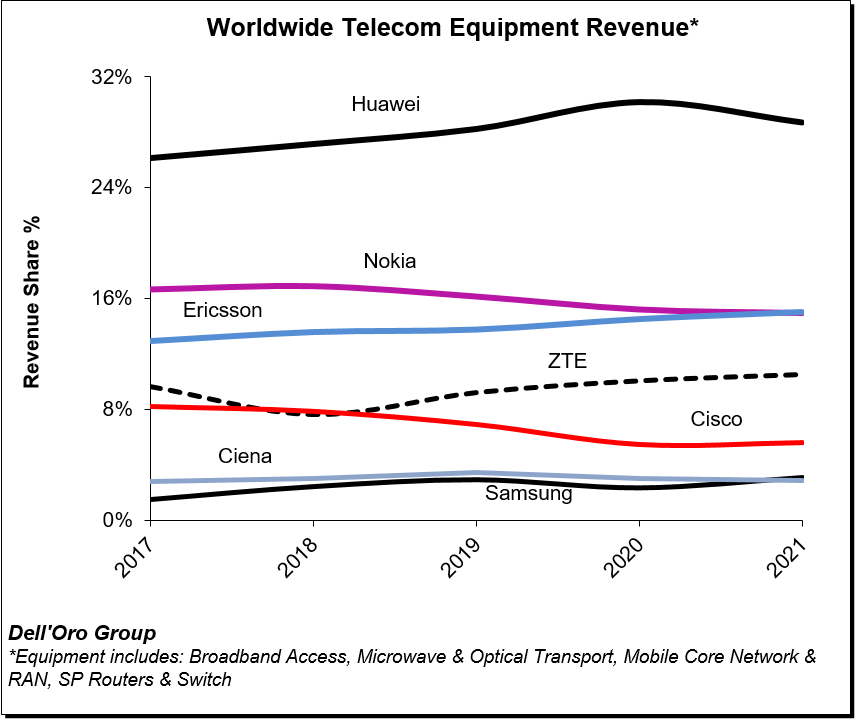
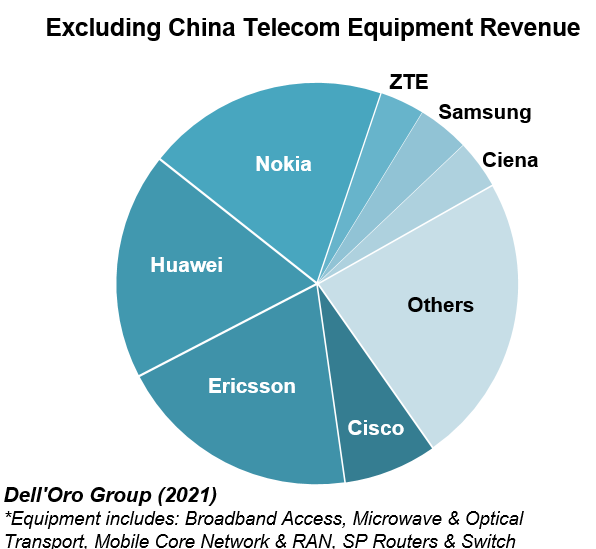
Initial readings suggest the playing field is more even outside of China, with Ericsson and Nokia essentially tied at 20% and Huawei accounting for around 18% of the market.
References:
Cisco, Samsung, and ZTE benefit most from Huawei bans in 2021 telco NI market
Dell’Oro: PONs boost Broadband Access; Total Telecom & Enterprise Network Equipment Markets
MTN Consulting: : 4Q2021 review of Telco & Webscale Network Operators Capex
by Matt Walker
Webscale revenues surge 25% to $2.1 trillion in 2021; capex of $175B drives global data center demand.
Introduction:
Revenues for the webscale sector of network operators ended 2021 at $2.14 trillion. That’s up 25% from 2020, and nearly 3x the total recorded in 2011. One reason for this is a dramatic uptick in cloud services revenues: cloud revenues for the top 3 (AWS, GCP and Azure) climbed 42% YoY, to $120.3B (per MTN Consulting). Still, this accounts for less than 6% of total webscale sector revenues. Larger factors behind 2021’s growth include: digital ad revenues for Alphabet and Facebook (Meta); ecommerce sales at Amazon, JD.Com, and Alibaba; and, 5G device revenue sales at Apple. The webscale sector is now comfortably larger than telecom, which recorded just under $1.9 trillion in 2021 revenues.
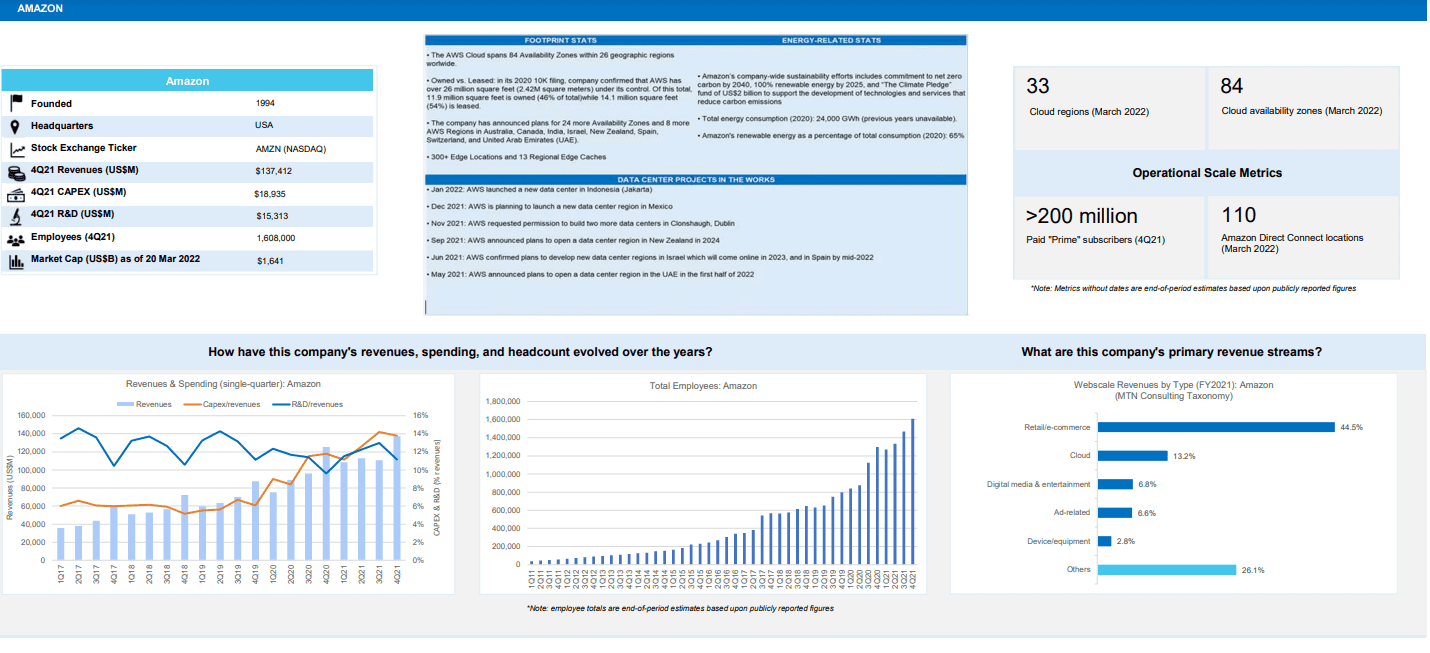
Here’s the profile for Amazon:
Capex- Telcos vs Webscalers:
On a capex basis, telecom remains far ahead, with nearly $325B in 2021 annualized capex, or nearly double the webscale total of $175B. Excluding China/HK-based companies (which haven’t finished reporting), the top 10 biggest telco capex spenders in 2021 were AT&T, DT, Verizon, NTT, Comcast, Vodafone, Orange, Charter, America Movil, and Telefonica. The biggest capex gains in 2021 were seen at America Movil (+$2.54B versus 2020 total), Telecom Italia (+$2.49B), Verizon (+$2.09B), AT&T (+$1.93B), Deutsche Telekom (+$1.74B), BT (+$1.63B), and Rakuten ($1.47B). The DT jump is inflated slightly by its Sprint acquisition, which closed in April 2020.
However, webscale is gradually bridging the capex gap with telcos: webscale capex spiked 30% YoY in 2021, versus an approximate 10% rise for telco capex. Capex in 4Q21 for webscalers was $50B, up 23% YoY. Webscalers also invest heavily in R&D, and have bleeding-edge requirements for the technology they deploy in their network. That has led them to drive the creation of many new innovations in network infrastructure over the last few years. These span semiconductors, optical transmission and components, intent-based routing, network automation, and other areas.
Facebook (Meta) is perhaps the most influential of all webscalers due in part to its openness and support for the OCP and TIP organizations.
Asia Pacific records best recent revenue growth in 2021
Regionally, the strongest growth in 2021 was in Asia Pacific, where revenues grew 29% YoY. The more mature Americas region lagged, with growth of just over 21% YoY. That pushed Americas down to about 44% of global webscale revenues, from 45% in 2020. Asia Pacific follows, with a 36% global revenue share, then Europe (17%) and MEA (3%). The Americas still account for the majority of webscale capex, with the US at the center. For instance, both Alphabet and Facebook (Meta) say well over 70% of their “long-lived assets” are in the US. Going forward, the non-US portion should rise as the cloud providers within the webscale market build out their global data center footprints. In January 2022, for example, AWS launched its first data center in Jakarta, Indonesia, and is planning a new region in Mexico.
Profitability still relatively high, but weaker than 2020:
Using a standardized definition of free cash flow (cash from operations less capex), the webscale sector’s FCF was $347.4B in 2021, or 16.2% of revenues. That is down significantly from a 19.7% margin in 2020. This ratio is still high relative to many sectors, however. The decline is due largely to a webscaler choice to accelerate capex during the COVID dislocation; that should pay off over the long run. Oracle, for instance, saw its FCF drop from 30.8% in 2020 to 17.2% in 2021, due mainly to its rapid cloud expansion. Nonetheless, Oracle says it will continue capex at a roughly $1B per quarter run rate, as it aspires to be the fourth major cloud provider with global scope. Amazon is actually the worst hit company in terms of FCF margin drop, due directly to its enormous 2021 capex outlays: Amazon’s FCF in 2021 was -3.1%, from 6.7% in 2020. Amazon, however, says its 2022 infrastructure (AWS) capex will likely rise.
Cash on hand, including short-term liquid investments, amounted to $747B for the webscale sector at the end of 4Q21, down 2% from the end of 2020. Total debt increased by 7%, to $518B. As a result, net debt (debt minus cash) in Dec. 2021 was -$228B for the webscale sector, from -$280B in December 2020. The companies with the biggest stockpiles of cash (and equivalents) are Alphabet ($139.6B), Microsoft ($125.4B), Amazon ($96.0B), and Apple ($63.9B). Facebook has just $48B, but no debt at all. Apple, IBM, and Oracle all have significantly more debt than cash.
Top 8 webscalers remain the biggest spenders, but Oracle and Twitter also important
This webscale tracker considers a “Top 8” group of companies as being, traditionally, the most influential in the market’s overall technology development and investments. These include three Chinese Internet companies (Alibaba, Baidu and Tencent), the world’s leading smartphone provider (Apple), the world’s biggest social media company (Facebook), and the leading three cloud providers: Alphabet, Amazon, and Microsoft. Ranking webscalers based on their share of tech capex, Amazon tops the list easily, accounting for 27.0% of network/IT capex in 2021. Amazon is followed by Alphabet (16.2%), Microsoft (14.0%), Facebook (10.0%), Tencent (6.3%), Apple (5.0%), Alibaba (4.1%), Oracle (2.9%), Baidu (2.1%), IBM (1.7%), HPE (1.5%), and Twitter (1.3%). Amazon’s recent capex surge is well known, and has supported expansion of the company’s AWS footprint and service offerings. Oracle has been quieter but its capex growth is equally impressive, from a smaller base: 2021 capex was $3.1B, up 70% from 2020. Twitter, a new addition to our webscale coverage, spends more on network/IT capex as a percentage of revenues (over 19%) than all other webscalers, due to ongoing software development and construction of its first owned data center.
The facilities these webscale players are building can be immense. For instance, Microsoft started construction recently on two new data centers in Des Moines Iowa, each of which costs over $1B and measures over 167K square meters (1.8 million square feet). These two are part of a cluster in the area, as is often the case; Microsoft already has three facilities around Des Moines. Facebook is working on a project in DeKalb, Illinois, roughly half the size at 84.2K square meters, costing US$800M and spreading across 500 acres of land. This construction project was announced in 2020 but won’t complete until 2023. These are just two examples of the many big facilities in the works in the webscale sector.
Who benefits from webscale capex?
The network spending of big webscalers is centered around immense, “hyperscale” data centers and undersea cable systems that support network traffic from the tech companies’ online retail, video, and social media platforms, along with cloud services. Webscale network operators (WNOs) may also own access networks, typically using fiber, microwave or mmWave, and even fixed satellite. WNOs exploring outer space for providing connectivity include Amazon, Apple, Alphabet, Facebook, and Microsoft.
A broad set of vendors are benefiting from WNO capex spending – from semiconductor players selling into the data center market (Intel, AMD, Nvidia, Broadcom, etc), to optical components & transport vendors selling into data center interconnect markets (e.g. Infinera, II-VI, Lumentum/Neophotonics), to contract manufacturers of white box/OCP servers (e.g. Wistron and Quanta). Cisco, for instance, recorded approximately $4.0B in 2021 sales to the webscale sector, up from about $2.1B in 2020. The construction industry also sees webscale as important, as much of their capex is for development of data center properties.
Network investment outlook:
Our current forecast calls for $187B of webscale capex in 2022, and further growth in the out-years until capex hits about $252B in 2026. For now, we are maintaining these targets. Despite a modest slippage in profitability, cash/debt and top-line growth in 4Q21, the sector retains many strengths which won’t go away overnight. Cloud services revenue growth remains strong, as does profitability for most players. Moreover, 2022 capex guidance from the major webscalers suggests modest growth; a summary follows:
- Amazon: 4Q21 earnings call confirmed that network/IT (“infrastructure” for AWS) is about 40% of total, consistent with MTN Consulting assumptions. Other components are fulfillment/logistics and transportation. For future capex, it says “we’re still working through some of our plans for 2022, but it’s coming into focus a bit. We see the CapEx for infrastructure going up…we’re adding regions and capacity to handle usage that still exceeds revenue growth in that business. So we feel good about making those investments.”
- Facebook (Meta): still calling for 2022 capex, including principal payments on finance leases, in the range of $29-34 billion (2021 actual: $19.2 billion). Says capex is driven by investments in data centers, servers, network infrastructure, and office facilities, and next year’s figure “reflects a significant increase in our AI and Machine Learning investments, which will support a number of areas across our Family of Apps.”
- Alphabet: projects a “meaningful increase in CapEx” for 2022, due to both technical infrastructure (mainly servers) and office facilities, where the company says it is “reaccelerating investment in fit-outs and ground-up construction.”
- Microsoft: expects 1Q22 capex to decline sequentially versus 4Q21, a change from the prior year period when 1Q21’s total capex was up 22% versus 4Q20. Does not provide any longer-term guidance. Its pending acquisition of Activision Blizzard is likely a factor in future plans, for two reasons. First, the deal consumes a lot of cash, and second, absorbing Activision would likely come with some changes in data center strategy. Currently Activision does not have any of its own data centers, rather, it rents colocation space in third-party facilities. The combined company will clearly want to see benefits from Microsoft’s data center footprint.
- Oracle: expects capex to continue in the roughly $1B per quarter range through the end of its current fiscal year (May 2022).
- Tencent: no concrete guidance but has hinted at Facebook-like investments in the “metaverse,” says it has a lot of the building blocks needed, for example, “a lot of gaming experiences…very strong social networking experience…engine capability, we have AI capability, we have the capability to build a large server architecture that can serve a huge number of concurrent users. We are very experienced in managing digital content economies as well as real-life digital assets.”
- Apple: nothing concrete on capex specifically, but in April 2021 it announced “$430 billion in contributions to the US economy include direct spend with American suppliers, data center investments, capital expenditures in the US, and other domestic spend…”
- Alibaba: no concrete guidance but 4Q21 call said it will continue to “invest in expanding its international infrastructure,” saying it now provides cloud services in 25 regions globally and that it is “committed to serving the real economy for the long term and the digitalization of all industries”. At its Apsara conference in October 2021, the company unveiled several new proprietary products, including Yitian 710 server chip, the X-Dragon architecture, Panjiu cloud-native server series, Alibaba AI and big data platform and a new generation of PolarDB database. It has global aspirations for its IaaS and PaaS services.
- Baidu: hasn’t addressed capex recently but on 4Q21 earnings call cited strong cloud demand growth, and said it is “trying to retain rapid revenue growth for 2022 and beyond,” which will require infrastructure investments.
- Twitter: its capex appears to be moderating now that it has (largely) completed construction of its new data center.
While we are maintaining the forecast outlook as published in Dec 2021, Amazon is a wildcard. It provides no specific guidance, and is clearly the market leader. Its quarterly outlays will be watched carefully. Even if its total capex does moderate, it is possible that the network/IT % of total will rise.
Implications for carrier-neutral market segment:
Webscalers with cloud operations are building out their data center footprints, and most webscalers are deploying more complex functionality into their networks (video, gaming, AI, metaverse). However, webscalers do have some financial pressures, and more important have an increasingly rich range of options for how they expand. The carrier-neutral segment (CNNO) of data center players is investing heavily in larger, more hyperscale-friendly and energy efficient facilities. Further, the sector is consolidating with help from private equity. MTN Consulting expects webscalers to continue to lean heavily on these third-parties for expansion in 2022 and beyond. As a result, data center CNNOs like Digital Realty, Equinix and its JV partners, QTS/Blackstone, CyrusOne/KKR/GIP, American Tower/CoreSite, and GDS will become more attractive to vendors as they invest more in network technology of their own.
References:
MTN Consulting: Network Infrastructure market grew 5.1% YoY; Telco revenues surge 12.2% YoY
MTN Consulting: Network operator capex forecast at $520B in 2025
Light Counting: Large majority of CSPs remain skeptical about Disaggregated Open Routers
LightCounting’s second annual report provides an update on the emergence of the Disaggregated Open Routers (DOR) market in wireless infrastructure. DOR are white-box cell site, aggregation and core routers based on an open and disaggregated architecture for existing 2G/3G/4G and future 5G network architectures.
The DOR architecture was hailed as a new paradigm as early as 2012, using open source software for a centralized SDN Controller from the Open Network Foundation and Linux Foundation. The “open networking architecture” was envisioned to be used by tier 1 telcos and hyperscale cloud service providers and later extend to enterprise/campus networks. Well, that never happened!
Instead, hyperscalers developed their own proprietary versions of SDN, sometimes using a bit of open sourced software (e.g. Microsoft Azure). A few start-ups (e.g. Pica 8 and Cumulus Networks) developed their own software to run on white boxes and bare metal switches, including network operating systems, routing and network management.
One company that’s succeeded at customized software running over white boxes is
Israel based DriveNets. Indeed, the DriveNets software (see References below) is custom built- not open source! It’s an “unbundled” networking software solution, which runs over a cluster of low-cost white box routers and white box x86 based compute servers. DriveNets has developed its own Network Operating System (NOS), rather than use open source or Cumulus’ NOS as several other open networking software companies have done.
LightCounting’s research indicates that the overall DOR market remains incipient and unless proof of concept (PoC), testing and validation accelerate, volumes will take some time to materialize.
“Despite TIP’s (Facebook’s Telecom Infra Project) relentless efforts to push network disaggregation to all network elements and domains, and a flurry of communication service providers (CSPs) taking the lead with commercial DOR deployments like AT&T with DriveNets (NOS), UfiSpace (hardware) and Broadcom (networking silicon), a large majority of CSPs (Communications Service Providers) remain skeptical about the potential opex reduction, the maturity of transport disaggregation, and the impact on operations, administration, maintenance, procurement and support.” said Stéphane Téral, Chief Analyst at LightCounting Market Research.
Source: Light Counting
That quote is quite different from Stephane’s comment one year ago that the DOR market was poised for imminent growth:
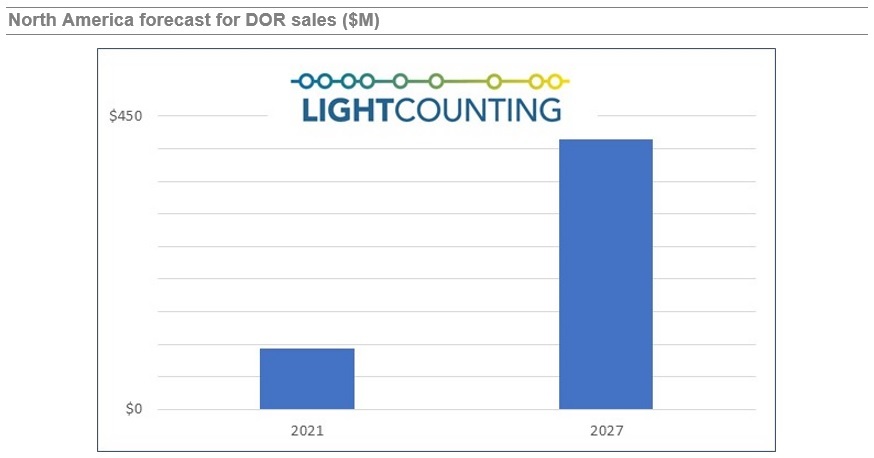
“Still incipient, the DOR market is just about to take off and is here to stay but requires more CSPs (Communications Service Providers) to take the plunge and drive volumes. And with China’s lack of appetite for DOR, North America is taking the lead.”
Major findings in the report are the following:
- The open RAN ascension brought router disaggregation to the spotlight and paved the way to four fundamental routes. This phenomenon would have never happened without TIP’s initiative.
- Although NOS software vendors are mushrooming and by far outnumbering the white box hardware suppliers dominated by UfiSpace, there have been some casualties down the DOR road. In the networking silicon domain, Broadcom remains predominant.
- CSPs remain cautiously optimistic about router disaggregation but have yet to see more maturity and the full benefits. As AT&T is showing the DOR way, KDDI and LG U+ could be DriveNets’ next major customers.
- With all inputs from all vendors and CSPs with DOR rollout plans taken into consideration, our cell site-based model produced a forecast showing a slow start that reflects the early stage of this market and an uptick at the end of the 2021-2026 forecast period marked by a double digit CAGR.
About the report:
LightCounting’s Disaggregated Open Routers report explores the emergence of the Disaggregated Open Routers (DOR) market. Disaggregated open routers are white-box routers based on separated white box hardware and software with cloud enabled software functions for existing 2G/3G/4G and future 5G network architectures. The report analyzes the disaggregated open routers’ (aggregation and core) architectures and implementations in wireless infrastructure, including the emerging vendor ecosystem, and tracks white box hardware units and sales, and software sales, all broken down by region including North America, Europe Middle East Africa, Asia Pacific, and Caribbean Latin America. It includes the total number of cell sites worldwide and a 5-year market forecast.
Historical data accounts for sales of the following vendors:
| Vendor | Software | Hardware/White Box | Source of Information | |
| Adva | Ensemble Activator | Survey data and estimates | ||
| Altran | Intelligent Switching Solution (ISS) | |||
| Alpha Networks | Hardware platform | |||
| Arrcus | ArcOS | |||
| Aviat Networks & Metaswitch (Microsoft) | AOS | |||
| Cisco | IOS XR7 | |||
| Datacom | DmOS | |||
| Dell Technologies | NOS | Hardware platform | ||
| Delta Electronics | AGCXD40V1, AGCV208S/AGCV208SV1, AGC7008S | Estimates | ||
| DriveNets | DNOS | |||
| Edgecore Networks | AS7316-26XB, AS7315-27X, AS5915-18X | Survey data and estimates | ||
| Exaware | ExaNOS | |||
| IP Infusion | OcNOS, DANOS | Estimates | ||
| Infinera | CNOS | DRX Series | Survey data and estimates | |
| Niral Networks | NiralOS | |||
| UfiSpace | S9700-53DX, S9700-23D, S9705-48D, S9500-30XS | Survey data and estimates | ||
| Volta Networks (now in IBM) | VEVRE | |||
| Note: Not all vendors provide services |
References:
https://www.lightcounting.com/report/march-2022-disaggregated-open-routers-135
