

Deep Dive – AT&T Fiber vs. Verizon Fios: Fiber Deployments, Footprints and Convergence Strategies
Disclaimer: This article was written by Perplexity.ai in response to a query from Alan J Weissberger who edited the piece. The companion article is here:
AT&T’s Fiber Expansion Strengthens Its Converged Wireless and Home Broadband Strategy
Introduction:
- AT&T reported the large fiber-reach of 39M locations and an aggressive fiber expansion program.
- Verizon’s acquisition of Frontier substantially broadens its fiber platform.
- However, a current, apples-to-apples deployment-cost ranking is unavailable: the verified disclosures do not establish comparable 2026 construction costs per home passed. Historical cost estimates should not be presented as current operating metrics.
Deployment Economics and Fiber Reach:
Reporting basis: AT&T third-quarter 2026 results; Verizon second-quarter 2026 disclosures and acquisition announcements. The periods and fiber footprint definitions differ.
| Metric | AT&T Fiber | Verizon Fios / expanded Verizon fiber platform |
|---|---|---|
| Reported fiber reach | More than 39 million consumer and business locations at September 30, 2026. | The Frontier transaction brought the combined footprint to approximately 30 million homes and businesses; this is an acquisition-era figure, not a verified Q3 closing balance. |
| Year-end 2026 target | More than 40 million locations. | More than 32 million fiber passings, reiterated on the Q2 earnings call. |
| Longer-term expansion | More than 60 million locations by the end of 2030. | No directly comparable long-term target established in the sources verified for this dashboard. |
| Footprint boundary | Includes owned-and-operated fiber and reach through Fiber Ventures arrangements; not exclusively AT&T-owned construction. | Combined Verizon footprint includes acquired Frontier territory. It should not be labeled “Fios-only” reach. |
| Current construction cost per home passed | No comparable 2026 dollar figure verified. Management reported approximately 2% annual increases in average deployment cost per passing over the preceding two years. | No comparable 2026 Fios-specific dollar figure verified. |
| Historical cost reference—not a current estimate | In February 2023, management commentary placed deployment costs near a $900–$1,000-per-passing ceiling. The reported figure does not provide enough accounting detail for a clean cross-operator comparison. | Frontier—not legacy Fios—expected costs toward the upper end of a $900–$1,000-per-passing range in 2023. This cannot be substituted for Verizon’s current blended build cost. |
| Capital-efficiency signal | AT&T expects annual capital investment in 2027–2028 to be approximately $1 billion below its previous plan while maintaining its fiber-reach objective. This is a companywide investment outlook, not a disclosed fiber unit-cost reduction. | Management emphasizes operating- and capital-expenditure efficiency alongside Frontier integration, but the verified disclosures do not isolate comparable savings per new fiber passing. |
Fixed-Mobile Convergence:
| Metric | AT&T | Verizon |
|---|---|---|
| Reported convergence penetration | 42.8% of advanced home internet connections also had an AT&T consumer postpaid wireless account at Q3-end. This includes fiber and Internet Air, rather than fiber alone. | A directly comparable penetration percentage was not established in the verified disclosures. |
| Incremental converged relationships | Approximately 350,000 added during Q3 2026. | No directly comparable quarterly relationship-addition figure established here. |
| Commercial execution | Uses fiber and fixed wireless broadband to anchor multiproduct relationships and cross-sell mobile service. | Verizon One combines mobility and broadband with one bill and integrated servicing; its broadband component can be fiber or FWA. |
| Evidence on retention | Management identifies convergence as a customer-lifetime-value strategy. The verified Q3 material does not establish a controlled, like-for-like churn reduction attributable solely to bundling. | In September 2024, a Verizon executive reported approximately 50% lower mobile churn and 40% lower broadband churn among bundled Fios/wireless customers. These are historical management claims, not current 2026 measurements. |
| Principal execution issue | Increase penetration and multiproduct adoption while introductory pricing and bundle discounts pressure standalone fiber ARPU. | Convert the enlarged Frontier footprint into mobile/broadband relationships while integrating customer servicing and go-to-market operations. |
A convergence percentage measures customer overlap, not network integration. Neither a bundled bill nor a household taking both services demonstrates a unified fixed-mobile core architecture. AT&T’s reported metric explicitly counts qualifying customer relationships; Verizon’s unified offering likewise spans commercial packaging and servicing.
Access-Network Technology:
The most useful engineering comparison is the optical access architecture—not simply the highest advertised retail speed.
| Technical dimension | AT&T Fiber | Legacy Verizon Fios |
|---|---|---|
| Established multi-gigabit upgrade approach | XGS-PON, alongside its existing GPON base. | NG-PON2 overlay on existing GPON infrastructure in upgraded markets. This should not be generalized to the acquired Frontier network. |
| PON capacity | XGS-PON provides nominal 10 Gbit/s symmetric line capacity on a wavelength pair. | The cited NG-PON2 implementation supports four 10 Gbit/s wavelength channels, providing 40 Gbit/s aggregate capacity. |
| Architecture tradeoff | Lower-cost fixed-wavelength optics and a widely adopted upgrade approach. | Higher initial optical-system cost, offset by wavelength flexibility, potential channel bonding, and service separation. |
| Shared-infrastructure opportunity | Higher-capacity PON supports multi-gigabit access without rebuilding the entire passive fiber plant. | Verizon has described using NG-PON2 to support residential, enterprise, and wireless transport services on a common optical distribution network. |
| Important capacity caveat | PON line rate is shared access capacity—not a dedicated 10 Gbit/s allocation to every household. | The 40 Gbit/s figure is aggregate multiwavelength system capacity—not a standard 40 Gbit/s residential service. |
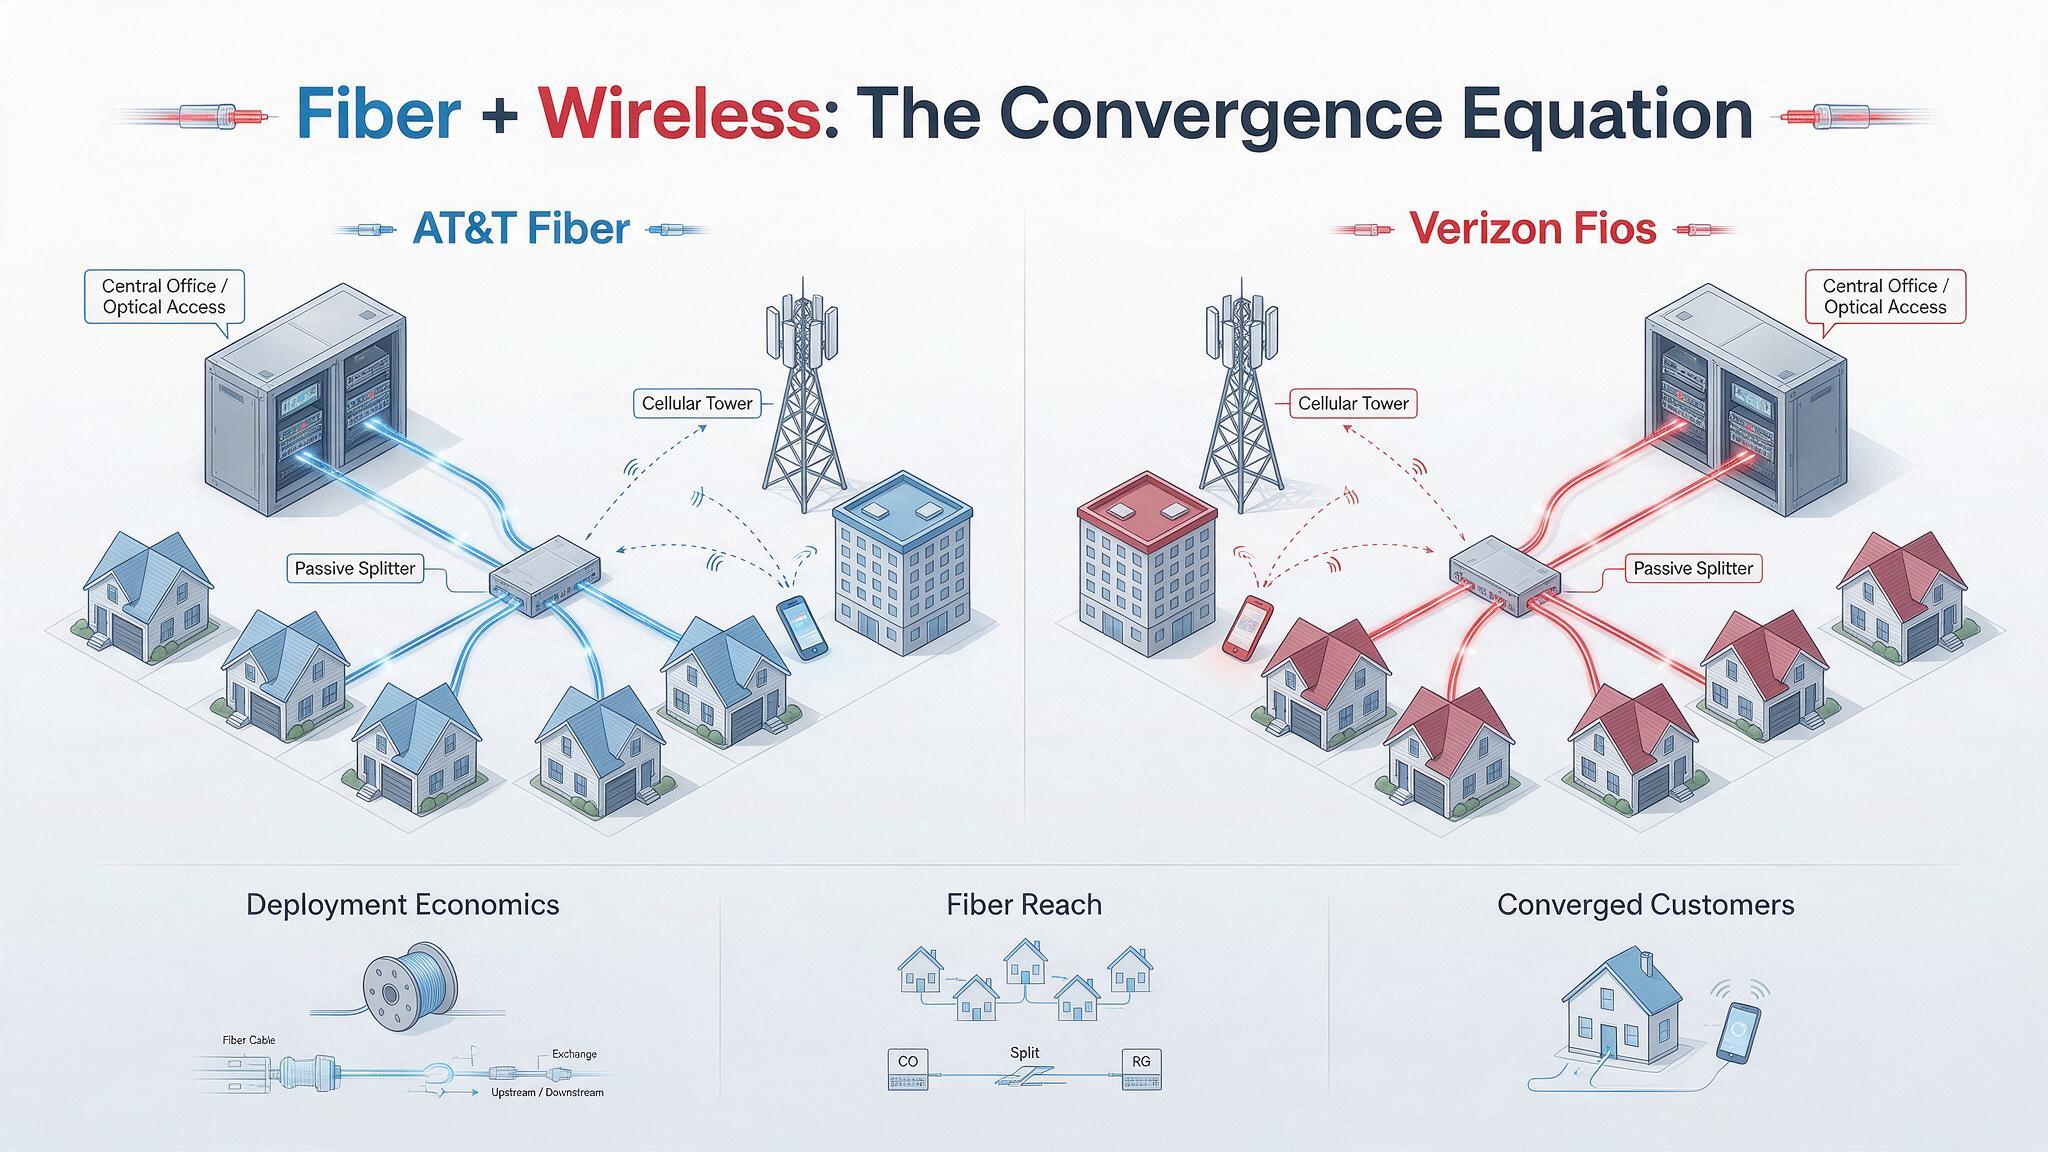
How to Interpret Deployment Cost Correctly:
A defensible cost dashboard must separate three different denominators:
-
Cost per passing: construction expenditure divided by newly serviceable locations.
-
Cost per connected customer: attributable construction expenditure divided by activated customers, plus any separately excluded connection costs.
-
Acquisition cost per passing: transaction value divided by acquired locations—a valuation measure, not a construction-cost measure.
The historical AT&T cost discussion illustrates the problem: the published figure did not clearly establish whether drops, customer electronics, installation labor, splitters, and other equipment were included. Without consistent cost boundaries, a seemingly precise AT&T–Verizon unit-cost comparison would be misleading.
An illustrative calculation—not either operator’s reported economics—shows why penetration matters:
References:
Network X Americas: AT&T and Comcast reveal huge AI impact on network operations
Analysis: AT&T 1Q-2026 results: increased fiber penetration, FWA momentum, D2D deals, and mobile/home internet bundles
AT&T grows fiber revenue 19%, 261K net fiber adds and 29.5M locations passed by its fiber optic network
AT&T sets 1.6 Tbps long distance speed record on its white box based fiber optic network
Lumen launches Multi-Cloud Gateway (MCGW) and expands metro fiber network after selling consumer FTTH business to AT&T
One thought on “Deep Dive – AT&T Fiber vs. Verizon Fios: Fiber Deployments, Footprints and Convergence Strategies”
Leave a Reply

From Google Gemini in response to a request to comment on this Deep Dive post and related one titled, “AT&T’s Fiber Expansion Strengthens Its Converged Wireless and Home Broadband Strategy”
These two IEEE ComSoc Techblog posts provide a highly analytical and technical overview of AT&T’s and Verizon’s broadband evolution. The articles successfully cut through standard marketing jargon to analyze the actual network economics, engineering architectures, and commercial mechanics behind fixed-mobile convergence.
Here is a breakdown and commentary on the key highlights from these pieces:
1. Clear-Eyed Approach to Deployment Economics
The “Deep Dive” piece accurately points out that an apples-to-apples comparison of current construction costs per home passed is missing due to a lack of uniform 2026 data boundary disclosures. It is crucial that the author separated “cost per passing” from “cost per connected customer” and “acquisition cost per passing”. As shown in the illustrative math, a $1,000 network build cost per passing actually jumps to $2,500 in allocated network costs if a provider only achieves a 40% take rate. This emphasizes that fiber success depends heavily on localized commercial execution, not just digging trenches.
2. Optical Access Technology Tradeoffs
The comparison of the underlying Passive Optical Network (PON) architectures is an excellent addition for network engineers:
• AT&T Fiber: Utilizing XGS-PON relies on fixed-wavelength optics. This is a more widely adopted, lower-cost path to nominal 10 Gbit/s symmetric line capacity.
• Verizon Fios: Deploying an NG-PON2 overlay supports four wavelength channels for an aggregate capacity of 40 Gbit/s. While it carries a higher initial optical system cost, it yields superior wavelength flexibility and channel bonding capabilities.
The piece correctly notes that these line rates represent shared access capacity across the passive splitters, rather than dedicated bandwidth to an individual residence.
3. Commercial Convergence vs. Core Network Architecture
Both posts highlight a common industry misconception regarding “fixed-mobile convergence.” As they point out, AT&T’s metric of 42.8% convergence penetration tracks customer relationships—households taking both an advanced home internet connection and a postpaid mobile line—on a single commercial packaging or billing level. It does not automatically signify a fully unified, technically integrated packet core infrastructure.
4. Legacy Decommissioning and “True” Savings
The second post rightly details that AT&T’s push to clear 100+ wire centers of copper dependencies is a vital milestone. While the physical buildings might not be closed yet, eliminating legacy service delivery is a hard prerequisite before true real estate and asset cost-decommissioning can begin. This structural transformation directly supports their broad corporate target of $4 billion in annual savings by 2028.