

FiOS
Deep Dive – AT&T Fiber vs. Verizon Fios: Fiber Deployments, Footprints and Convergence Strategies
Disclaimer: This article was written by Perplexity.ai in response to a query from Alan J Weissberger who edited the piece. The companion article is here:
AT&T’s Fiber Expansion Strengthens Its Converged Wireless and Home Broadband Strategy
Introduction:
- AT&T reported the large fiber-reach of 39M locations and an aggressive fiber expansion program.
- Verizon’s acquisition of Frontier substantially broadens its fiber platform.
- However, a current, apples-to-apples deployment-cost ranking is unavailable: the verified disclosures do not establish comparable 2026 construction costs per home passed. Historical cost estimates should not be presented as current operating metrics.
Deployment Economics and Fiber Reach:
Reporting basis: AT&T third-quarter 2026 results; Verizon second-quarter 2026 disclosures and acquisition announcements. The periods and fiber footprint definitions differ.
| Metric | AT&T Fiber | Verizon Fios / expanded Verizon fiber platform |
|---|---|---|
| Reported fiber reach | More than 39 million consumer and business locations at September 30, 2026. | The Frontier transaction brought the combined footprint to approximately 30 million homes and businesses; this is an acquisition-era figure, not a verified Q3 closing balance. |
| Year-end 2026 target | More than 40 million locations. | More than 32 million fiber passings, reiterated on the Q2 earnings call. |
| Longer-term expansion | More than 60 million locations by the end of 2030. | No directly comparable long-term target established in the sources verified for this dashboard. |
| Footprint boundary | Includes owned-and-operated fiber and reach through Fiber Ventures arrangements; not exclusively AT&T-owned construction. | Combined Verizon footprint includes acquired Frontier territory. It should not be labeled “Fios-only” reach. |
| Current construction cost per home passed | No comparable 2026 dollar figure verified. Management reported approximately 2% annual increases in average deployment cost per passing over the preceding two years. | No comparable 2026 Fios-specific dollar figure verified. |
| Historical cost reference—not a current estimate | In February 2023, management commentary placed deployment costs near a $900–$1,000-per-passing ceiling. The reported figure does not provide enough accounting detail for a clean cross-operator comparison. | Frontier—not legacy Fios—expected costs toward the upper end of a $900–$1,000-per-passing range in 2023. This cannot be substituted for Verizon’s current blended build cost. |
| Capital-efficiency signal | AT&T expects annual capital investment in 2027–2028 to be approximately $1 billion below its previous plan while maintaining its fiber-reach objective. This is a companywide investment outlook, not a disclosed fiber unit-cost reduction. | Management emphasizes operating- and capital-expenditure efficiency alongside Frontier integration, but the verified disclosures do not isolate comparable savings per new fiber passing. |
Fixed-Mobile Convergence:
| Metric | AT&T | Verizon |
|---|---|---|
| Reported convergence penetration | 42.8% of advanced home internet connections also had an AT&T consumer postpaid wireless account at Q3-end. This includes fiber and Internet Air, rather than fiber alone. | A directly comparable penetration percentage was not established in the verified disclosures. |
| Incremental converged relationships | Approximately 350,000 added during Q3 2026. | No directly comparable quarterly relationship-addition figure established here. |
| Commercial execution | Uses fiber and fixed wireless broadband to anchor multiproduct relationships and cross-sell mobile service. | Verizon One combines mobility and broadband with one bill and integrated servicing; its broadband component can be fiber or FWA. |
| Evidence on retention | Management identifies convergence as a customer-lifetime-value strategy. The verified Q3 material does not establish a controlled, like-for-like churn reduction attributable solely to bundling. | In September 2024, a Verizon executive reported approximately 50% lower mobile churn and 40% lower broadband churn among bundled Fios/wireless customers. These are historical management claims, not current 2026 measurements. |
| Principal execution issue | Increase penetration and multiproduct adoption while introductory pricing and bundle discounts pressure standalone fiber ARPU. | Convert the enlarged Frontier footprint into mobile/broadband relationships while integrating customer servicing and go-to-market operations. |
A convergence percentage measures customer overlap, not network integration. Neither a bundled bill nor a household taking both services demonstrates a unified fixed-mobile core architecture. AT&T’s reported metric explicitly counts qualifying customer relationships; Verizon’s unified offering likewise spans commercial packaging and servicing.
Access-Network Technology:
The most useful engineering comparison is the optical access architecture—not simply the highest advertised retail speed.
| Technical dimension | AT&T Fiber | Legacy Verizon Fios |
|---|---|---|
| Established multi-gigabit upgrade approach | XGS-PON, alongside its existing GPON base. | NG-PON2 overlay on existing GPON infrastructure in upgraded markets. This should not be generalized to the acquired Frontier network. |
| PON capacity | XGS-PON provides nominal 10 Gbit/s symmetric line capacity on a wavelength pair. | The cited NG-PON2 implementation supports four 10 Gbit/s wavelength channels, providing 40 Gbit/s aggregate capacity. |
| Architecture tradeoff | Lower-cost fixed-wavelength optics and a widely adopted upgrade approach. | Higher initial optical-system cost, offset by wavelength flexibility, potential channel bonding, and service separation. |
| Shared-infrastructure opportunity | Higher-capacity PON supports multi-gigabit access without rebuilding the entire passive fiber plant. | Verizon has described using NG-PON2 to support residential, enterprise, and wireless transport services on a common optical distribution network. |
| Important capacity caveat | PON line rate is shared access capacity—not a dedicated 10 Gbit/s allocation to every household. | The 40 Gbit/s figure is aggregate multiwavelength system capacity—not a standard 40 Gbit/s residential service. |
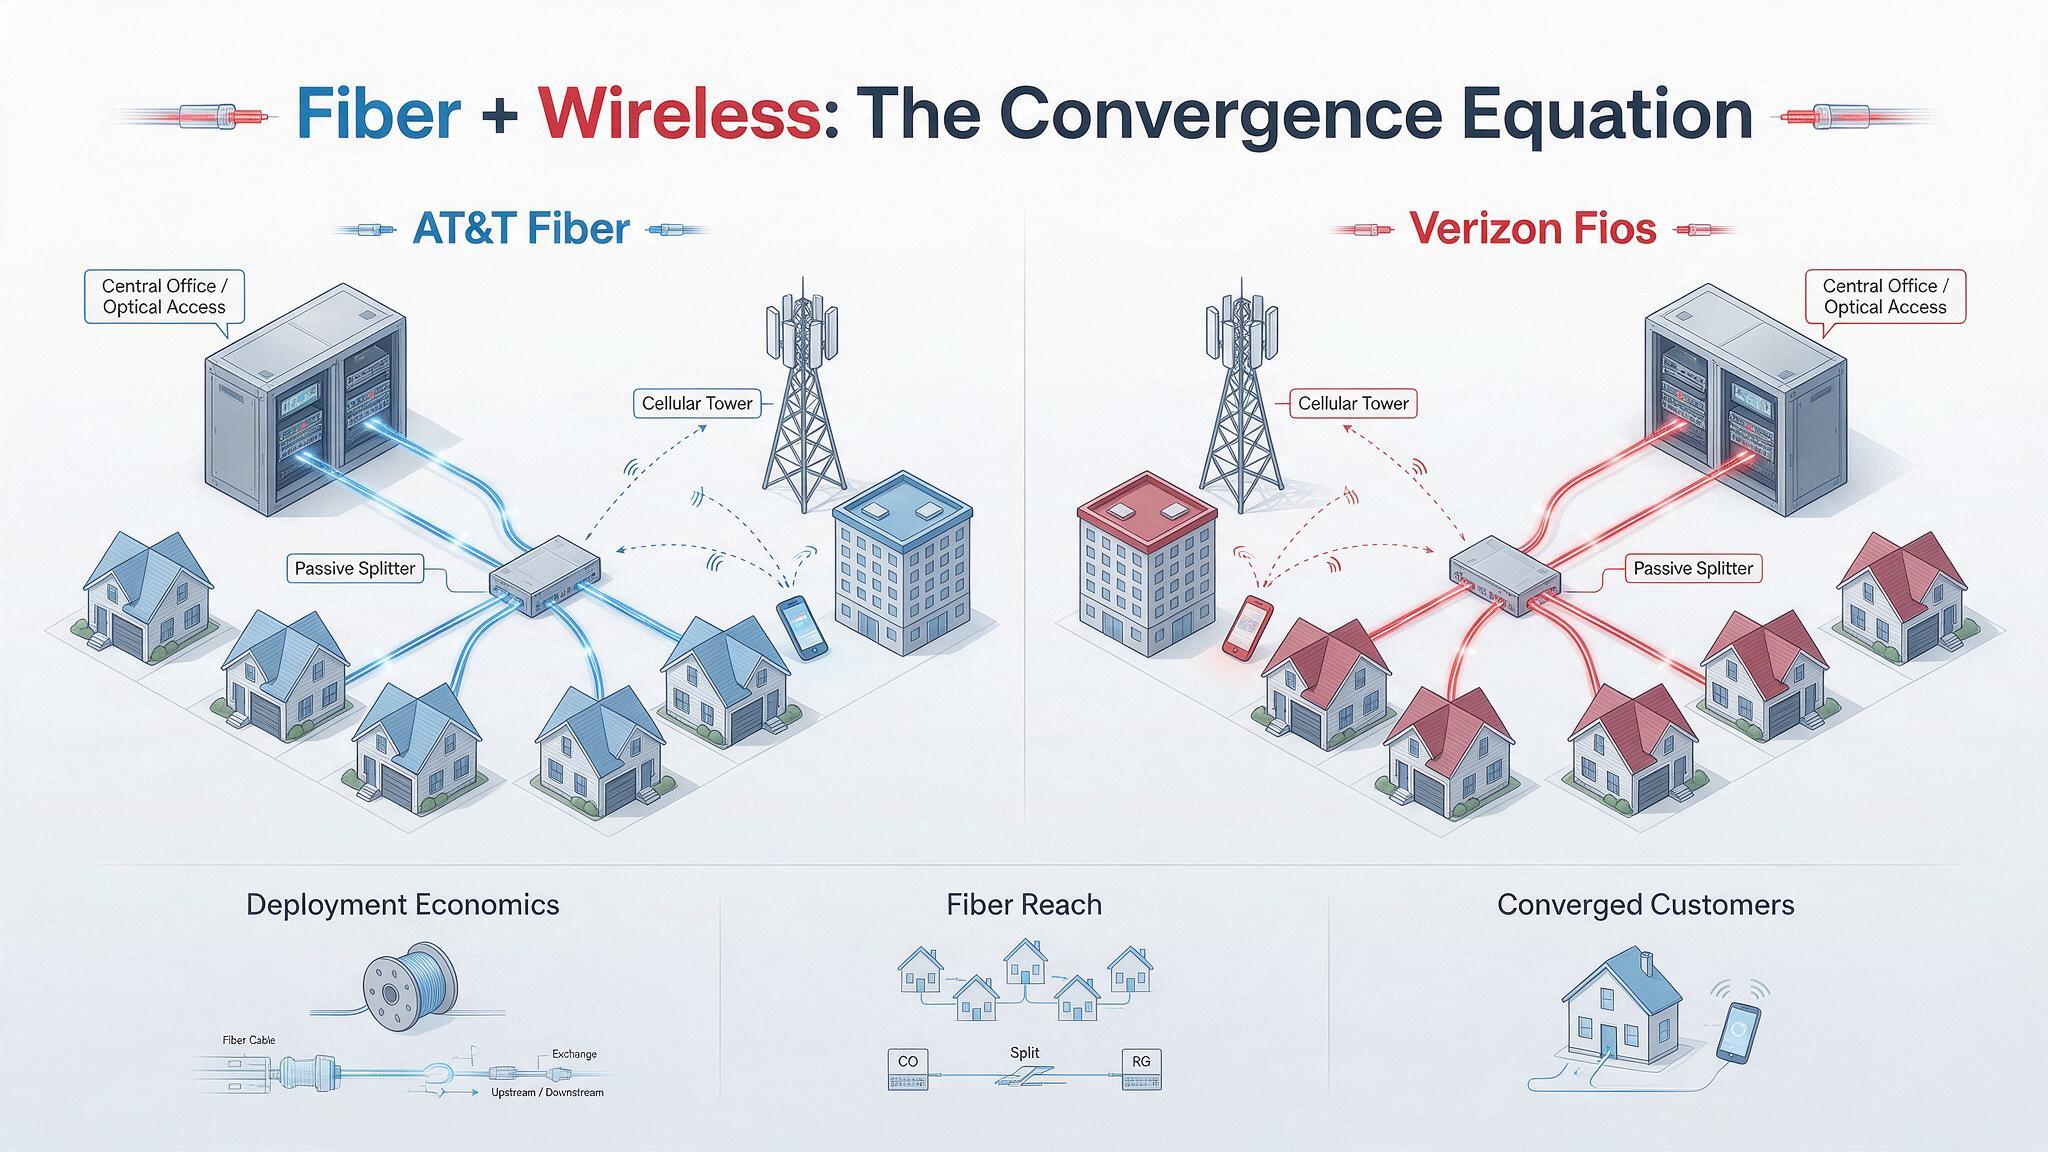
How to Interpret Deployment Cost Correctly:
A defensible cost dashboard must separate three different denominators:
-
Cost per passing: construction expenditure divided by newly serviceable locations.
-
Cost per connected customer: attributable construction expenditure divided by activated customers, plus any separately excluded connection costs.
-
Acquisition cost per passing: transaction value divided by acquired locations—a valuation measure, not a construction-cost measure.
The historical AT&T cost discussion illustrates the problem: the published figure did not clearly establish whether drops, customer electronics, installation labor, splitters, and other equipment were included. Without consistent cost boundaries, a seemingly precise AT&T–Verizon unit-cost comparison would be misleading.
An illustrative calculation—not either operator’s reported economics—shows why penetration matters:
References:
Network X Americas: AT&T and Comcast reveal huge AI impact on network operations
Analysis: AT&T 1Q-2026 results: increased fiber penetration, FWA momentum, D2D deals, and mobile/home internet bundles
AT&T grows fiber revenue 19%, 261K net fiber adds and 29.5M locations passed by its fiber optic network
AT&T sets 1.6 Tbps long distance speed record on its white box based fiber optic network
Lumen launches Multi-Cloud Gateway (MCGW) and expands metro fiber network after selling consumer FTTH business to AT&T