

Broadband Internet Speeds
BroadbandNow Research: Best & Worst States for Broadband Access
A recent study by BroadbandNow Research has assessed the best and worst states in the U.S. for broadband internet access in 2023. The study evaluated each state and the District of Columbia based on various factors such as access to wired or fixed wireless broadband, access to low-priced broadband, median download speed, and median upload speed.
Key Findings:
- Availability of low-priced broadband has increased across the U.S. There is now only 1 state with less than 20% of the population having access to a broadband plan for $60 per month or less (down from 25 states last year). Having said that, in only one state, Wyoming, more than half of residents have access to such a plan.
- Latency (round trip time) is a measure of responsiveness–the time between when you click something and when you get a response–and it’s critical for a smooth internet experience, especially for real-time interactions such as gaming or video calls. There is a huge geographic disparity between states that do well in this metric, like New York or Washington with median round trip times less than 7.5 milliseconds, and states that do poorly, like Hawai’i and Massachusetts with median round trip times greater than 61 milliseconds.
- Delaware is the best state for broadband internet, with 46.2% of its population having access to low-priced broadband and a median download speed of 96.1 Mbps. On the other hand, Alaska ranked at the bottom of the list, with only 20% of its population having access to affordable broadband and a median download speed of 58.5 Mbps.
- We support changing the definition of broadband speeds from 25Mbps down and 3Mbps up to 100Mbps down and 25Mbps up, but we’re a long way away from widespread access to those speeds. Nationally, only 39% of Americans are getting 100Mbps down, and only 25% are getting 25Mbps up.
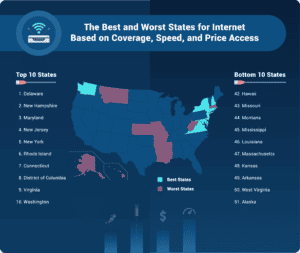
10 Best States for Broadband
10 Worst States for Broadband
According to the study, there is only one state, Nevada, with less than 20% of its population having access to a broadband plan for $60 per month or less. This is a significant drop from the 25 states that had such limited access last year.
In the Tri-State area, Illinois secured the 14th spot with 95.7% of its residents having access to wired or fixed wireless broadband. Additionally, 31.4% of the population had access to low-priced broadband. Illinois also boasted a median download speed of 85.3 Mbps, surpassing the national median.
Indiana ranked 23rd overall, with an impressive download speed of 85.7 Mbps. 31.4% of its population also had access to low-priced broadband. However, the state fell short in terms of overall broadband access, with only 92.8% of residents having access to wired or fixed wireless broadband.
Kentucky landed at the 36th spot, with a mere 25% of its population having access to affordable broadband. In an effort to improve access, Governor Andy Beshear, Senator Mitch McConnell, and other lawmakers secured over $1 billion in funding for broadband access in June, marking the largest public investment in high-speed internet in the state’s history.
References:
GAO: U.S. Broadband Benchmark Speeds Too Slow; FCC Should Analyze Small Business Speed Needs
FCC proposes 100 Mbps download as U.S. minimum broadband speed
FCC proposes 100 Mbps download as U.S. minimum broadband speed
Federal Communications Commission (FCC) Chairwoman Jessica Rosenworcel proposed a national goal of 100% affordable broadband access in the U.S. According to the official FCC release, Rosenworcel seeks to gauge the progress of broadband deployment, focusing on crucial characteristics such as affordability, adoption, availability, and equitable access for all Americans.
“In today’s world, everyone needs access to affordable, high-speed internet, no exceptions,” said Chairwoman Rosenworcel. “It’s time to connect everyone, everywhere. Anything short of 100% is just not good enough.”
As part of the plan, FCC now proposes to increase the national fixed broadband standard to 100 Mbps for download and 20 Mbps for upload, pushing internet service providers to enhance their offerings and reach more Americans. That’s up from 25 Mbps for download and 3 Mbps for upload which was established in 2015.
Anticipating future demands, Rosenworcel outlined a separate national goal of 1 Gbps for download and 500 Mbps for upload, ensuring that the United States remains at the forefront of digital innovation.
By increasing the national fixed broadband standard and setting ambitious targets, the FCC is taking decisive steps towards digital inclusion, opening up a world of opportunities in education, business, healthcare, and beyond.
References:
OpenVault: U.S. broadband users on 1-Gig tiers climbed to 26% in Q4 2022
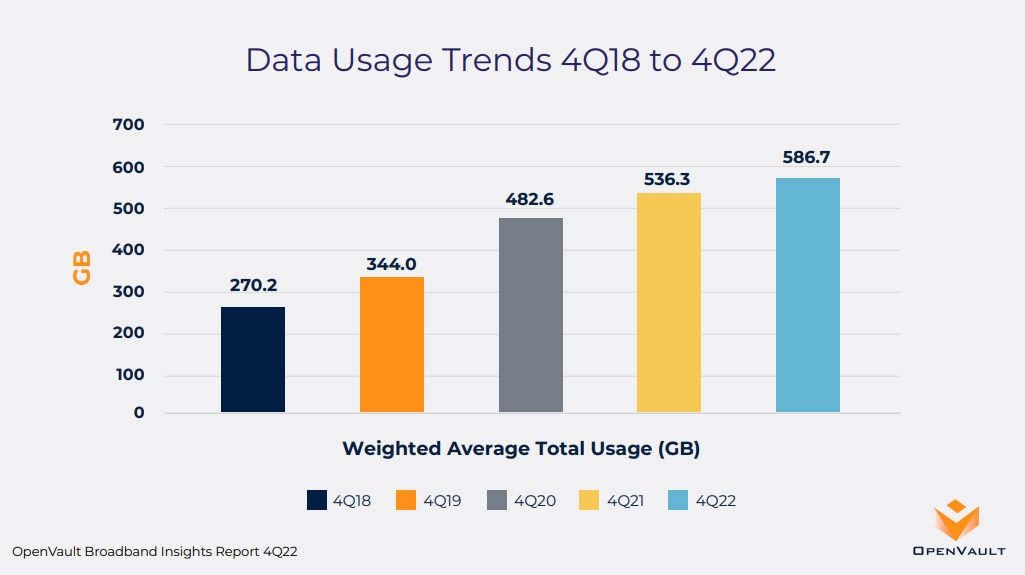
The 4Q22 edition of the OpenVault Broadband Insights (OVBI) report indicates that average household broadband consumption neared 600 GB per month, the percentage of subscribers on gigabit tiers more than doubled, and usage by participants in the FCC’s Affordable Connectivity Program (ACP) continued to outpace that of the general population. OpenVault expects household data usage to surpass 600GB by Q4 2023 and possibly reach 1 terabyte by the end of 2028.
Editor’s Note: OpenVault bases its findings on data from “millions” of individual broadband subscribers that are collected and aggregated from a software-as-a-service broadband service management tool in use by a wide range of ISPs. The data is used to pinpoint usage patterns, including the differences between two key categories: subscribers on flat-rate billing (FRB) plans that offer unlimited data usage and those on usage-based billing (UBB) plans, on which subscribers are billed based on their bandwidth consumption. OpenVault data is used for benchmarking purposes by the Federal Communications Commission (FCC) in specific comparative analyses.
…………………………………………………………………………………………………………………………………….
With broadband consumption on the rise, there’s been an increase in “power users” – households that use more than 1TB of data per month. The percentage of users at that level rose 18.7% year-over-year. “Super power users” – those consuming 2TB or more per month – climbed 25%, from 2.7% to 3.4%. That’s a nearly 30x increase within the past five years, OpenVault said.
- European average data usage (268.1 GB) grew 12.5% from a year ago, a faster pace than the North American annual growth rate of 9.4%.
- North American median data usage (396.6 GB) was more than 2.5x that of European median data usage (148.2 GB) in 4Q22, a slightly smaller difference than observed in 4Q21.
………………………………………………………………………………………………………………………………………………………………………………..
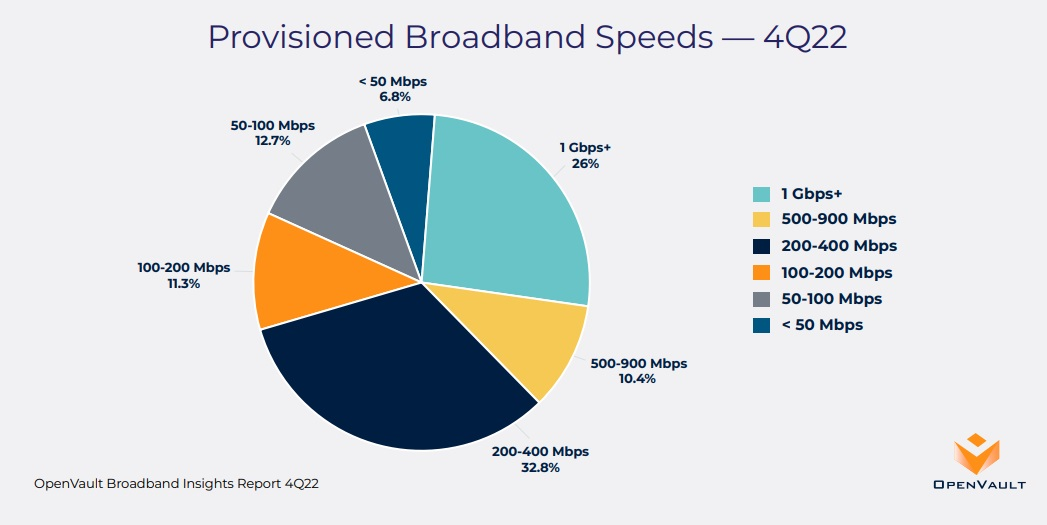
The percentage of U.S. broadband subs on 1-Gig (or higher speed) tiers climbed to 26% in Q4 2022, more than double the 12.2% observed in the year-ago period, OpenVault. As broadband speeds increase, the percentage of broadband customers provisioned for speeds of 200 Mbit/s or less is on the decline – 31% at the end of 2022, down 43% year-over-year, OpenVault found. Adoption of gigabit speeds has jumped significantly among Usage Based Billing (UBB) subscribers, increasing to almost 35% in 4Q22 from 13.4% in 4Q21.
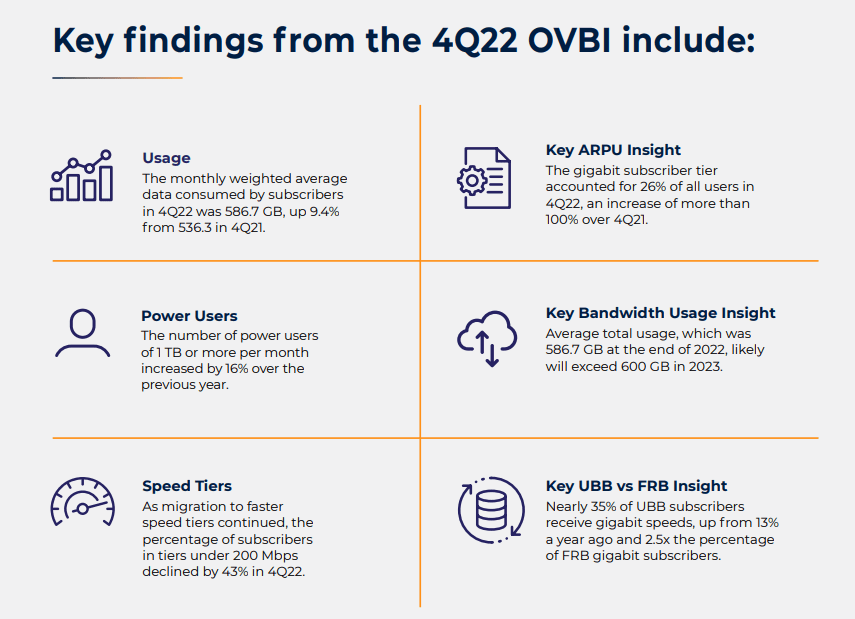
OpenVault found that average data usage in households on the FCC’s Affordable Connectivity Plan (ACP) continues to outpace the field. In Q4, average usage in ACP households was 688.7GB, 17% higher than the broader average of 586.7GB. OpenVault has observed that some households in the ACP program use the funds to upgrade to faster speed packages.
References:
https://openvault.com/resources/ovbi/ (register to download the report)
OpenVault: Broadband data usage surges as 1-Gig adoption climbs to 15.4% of wireline subscribers
Ookla: Fixed Broadband Speeds Increasing Faster than Mobile: 28.4% vs 16.8%
MoffettNathanson: 87.4% of available U.S. homes have broadband; Leichtman Research: 90% of U.S. homes have internet
OpenVault: Broadband data usage surges as 1-Gig adoption climbs to 15.4% of wireline subscribers
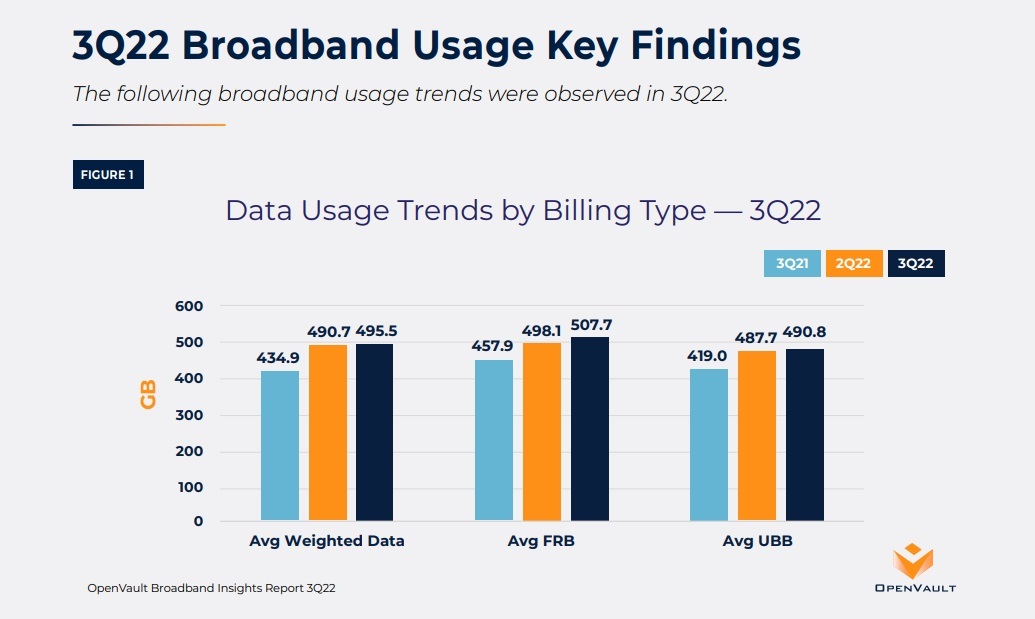
Dramatic increases in provisioned speeds are continuing to shift the broadband landscape, according to the Q3 2022 edition of the (OpenVault Broadband Insights) report. The report was issued today by OpenVault [1.], a market-leading source of SaaS-based revenue and network improvement solutions and data-driven insights for the broadband industry.
Note 1. OpenVault is a company that specializes in collecting and analyzing household broadband usage data. It bases its quarterly reports on anonymized and aggregated data from “millions of individual broadband subscribers.”
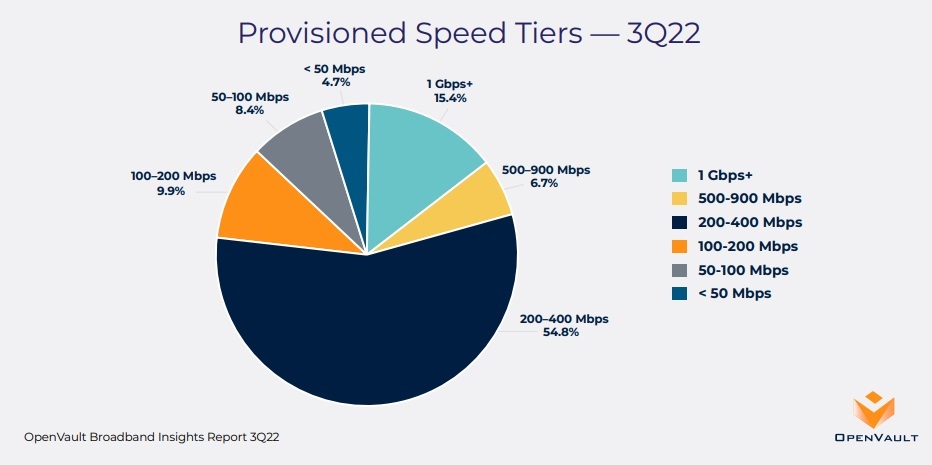
Using data aggregated from OpenVault’s broadband management tools, the 3Q22 OVBI shows a continued increase in gigabit tier adoption, as well as migration of subscribers to speeds of 200 Mbps or higher. Fifteen percent of subscribers were on gigabit tier plans in 3Q22, an increase of 35% over the 11.4% figure in 3Q21, and the percentage of subscribers on plans between 200-400 Mbps doubled to 54.8% from 27.4% in 3Q21. At the end of the third quarter, only 4.7% of all subscribers were provisioned for speeds of less than 50 Mbps, a reduction of more than 50% from the 3Q21 figure of 9.8%.
Gigabit tier subscribers are up more than 600% since the third quarter of 2019 and are now 15.4% of all wireline internet subs. “This trend is impacting bandwidth usage characteristics, with faster growth in power users and median bandwidth usage. Faster speeds are fueling greater consumption that may be reflected in the need for greater capacity in the future.”
Key findings in the 3Q22 report:
Other Highlights:
-
- Average monthly usage of 495.5 GB was up 13.9% from 3Q21’s average of 434.9 GB, and represented a slight increase over 2Q22’s 490.7 GB. Median broadband was up 14.3% year over year, representing broader growth across all subscribers.
- The speed tier with the fastest annual growth is in the range of 200 Mbit/s to 400 Mbit/s, which doubled to 54.8% of all subscribers. The percentage of customers on low-end 50Mbit/s tiers shrank to just 4.7% in Q3 2022, down more than 50% from the year-ago quarter.
- Year-over-year growth of power users of 1TB or more was 18%, to 13.7% of all subscribers, while the super power user category of consumers of 2 TB or more rose almost 50% during the same time frame.
- Participants in the FCC’s Affordable Connectivity Program (ACP) consumed 615.2 GB of data in 3Q22, 24% more than the 495.5 used by the general population.
OpenVault founder and CEO Mark Trudeau told Light Reading in October that high levels of data usage among ACP participants is surprising, but he said it’s likely due to households in the program that use the funds to upgrade to faster speed packages. As a successor to the original Emergency Broadband Benefit (EBB) program, ACP provides qualifying low-income households with a $30 per month subsidy ($75 for tribal households) that can be applied toward Internet subscriptions.
The entire report is at https://xprss.io/zdgeG if you fill in a form and click SEND (to OpenVault).
OpenVault also provides continuously updated broadband consumption figures at https://openvault.com/broadbandtracker/.
References:
https://www.telecompetitor.com/clients/openvault/2022/Q3/index.php
Ookla Ranks Internet Performance in the World’s Largest Cities: China is #1
Ookla Ranks Internet Performance in the World’s Largest Cities: China is #1
Internet connectivity benchmarking firm Ookla, which maintains the popular Speedtest.net service, has updated their ranking of broadband performance in countries around the world to include internet speed rankings for some of the “world’s largest cities.” Ookla’s new list ranks median internet download speeds in nearly 200 cities all over the world.
Overall, China topped the list with Shanghai as the fastest city on their list for mobile broadband with a median download speed of 158.63Mbps (24.32Mbps upload and 17ms latency), while Beijing was fastest for fixed broadband during September 2022 at 238.86Mbps (37.75Mbps upload and 7ms latency).
Beijing (China) and Valparaiso (Chile) were ranked highest in the fixed broadband category, with average speeds of 239 Mbps and 223 Mbps, respectively, followed by Shanghai (222 Mbps), New York (218 Mbps), Bangkok (217 Mbps) and Madrid (197 Mbps).
Fastest Broadband Speeds for the World’s Largest Cities 2022
| Fastest Cities for Mobile (Mbps) | Fastest Cities for Fixed Broadband (Mbps) | ||
| Shanghai, China | 158.63 | Beijing, China | 238.86 |
| Copenhagen, Denmark | 157.54 | Valparaíso, Chile | 222.67 |
| Oslo, Norway | 155.19 | Shanghai, China | 221.85 |
| Busan, South Korea | 147.55 | New York, United States | 218.04 |
| Beijing, China | 145.76 | Bangkok, Thailand | 217.19 |
| Sofia, Bulgaria | 145.28 | Madrid, Spain | 196.7 |
| Ar-Rayyan, Qatar | 140.69 | Bucharest, Romania | 195.6 |
| Abu Dhabi, United Arab Emirates | 137.48 | Lyon, France | 193.34 |
| Dubai, United Arab Emirates | 135.52 | Chon Buri, Thailand | 188.25 |
| Riyadh, Saudi Arabia | 133.65 | Tokyo, Japan | 185.04 |
| Stockholm, Sweden | 126.4 | Los Angeles, United States | 184.15 |
| Antwerp, Belgium | 121.33 | Geneva, Switzerland | 182.84 |
| Gothenburg, Sweden | 120.71 | Abu Dhabi, United Arab Emirates | 178.17 |
| Doha, Qatar | 114 | Zürich, Switzerland | 177.6 |
| Seoul, South Korea | 113.36 | Santiago, Chile | 176.58 |
| Melbourne (Greater), Australia | 111.78 | Copenhagen, Denmark | 175.31 |
| Sydney, Australia | 108.04 | Barcelona, Spain | 173.71 |
| New York, United States | 106.57 | Osaka, Japan | 169.18 |
| Rotterdam, Netherlands | 100.85 | Toronto, Canada | 164.93 |
| Skopje, North Macedonia | 99.02 | Paris, France | 155.24 |
| Toronto, Canada | 98.29 | Auckland, New Zealand | 149.22 |
| Amsterdam, Netherlands | 96.79 | Budapest, Hungary | 147.82 |
| Los Angeles, United States | 95.4 | Taipei, Taiwan | 144.35 |
| Zürich, Switzerland | 89.17 | Kraków, Poland | 138.75 |
| Montreal, Canada | 84.25 | Warsaw, Poland | 138.64 |
| Helsinki, Finland | 83.57 | São Paulo, Brazil | 124.05 |
| Zagreb, Croatia | 82.36 | Dubai, United Arab Emirates | 118.99 |
| Muscat, Oman | 79.66 | New Taipei, Taiwan | 115.36 |
| Auckland, New Zealand | 77.91 | Gothenburg, Sweden | 111.29 |
| Lisbon, Portugal | 76.23 | Porto, Portugal | 110.91 |
| Manama, Bahrain | 72.72 | Stockholm, Sweden | 109.59 |
| Kuwait City, Kuwait | 72.61 | Haifa, Israel | 108.46 |
| Porto, Portugal | 72.16 | Seoul, South Korea | 106.48 |
| Paris, France | 72.12 | Chisinau, Moldova | 105.05 |
| Jeddah, Saudi Arabia | 71.92 | Panama City, Panama | 104.25 |
| Geneva, Switzerland | 70.88 | Oslo, Norway | 102.76 |
| Berlin, Germany | 70.02 | Montevideo, Uruguay | 102.57 |
| Vilnius, Lithuania | 67.7 | Rio de Janeiro, Brazil | 100.49 |
| Manchester, United Kingdom | 67.07 | Amsterdam, Netherlands | 99.66 |
| London, United Kingdom | 66.36 | Milan, Italy | 98.57 |
| Taipei, Taiwan | 65.18 | Rotterdam, Netherlands | 95.39 |
| Vienna, Austria | 65.08 | Kuwait City, Kuwait | 94.65 |
| New Taipei, Taiwan | 64.69 | Medellín, Colombia | 94.48 |
| Brussels, Belgium | 58.78 | Busan, South Korea | 94.43 |
| Rio de Janeiro, Brazil | 58.64 | Bogotá, Colombia | 94.38 |
| Athens, Greece | 57.23 | Vilnius, Lithuania | 94.28 |
| Hamburg, Germany | 56.77 | Ar-Rayyan, Qatar | 94.16 |
| São Paulo, Brazil | 56.58 | Riyadh, Saudi Arabia | 93.71 |
| Thessaloniki, Greece | 56.57 | Lisbon, Portugal | 93.13 |
| Lyon, France | 56.08 | Dublin, Ireland | 91.63 |
| Prague, Czechia | 55.25 | Moscow, Russia | 91.26 |
| Belgrade, Serbia | 53.27 | Riga, Latvia | 91.14 |
| Bucharest, Romania | 52.03 | Montreal, Canada | 90.06 |
| Osaka, Japan | 51.53 | Kuala Lumpur, Malaysia | 89.38 |
| Milan, Italy | 51.27 | Vienna, Austria | 88.05 |
| Budapest, Hungary | 49.88 | Belgrade, Serbia | 87.88 |
| Tokyo, Japan | 49.86 | Antwerp, Belgium | 87.17 |
| Riga, Latvia | 45.88 | Berlin, Germany | 86.65 |
| Kraków, Poland | 44.42 | Doha, Qatar | 86.62 |
| Warsaw, Poland | 43.48 | Hamburg, Germany | 85.35 |
| Barcelona, Spain | 42.88 | Johor Bahru, Malaysia | 85.03 |
| Rabat, Morocco | 41.98 | Tel Aviv-Yafo, Israel | 84.96 |
| Madrid, Spain | 40.78 | Ho Chi Minh City, Vietnam | 84.32 |
| Johannesburg, South Africa | 40.38 | Helsinki, Finland | 84.11 |
| Hanoi, Vietnam | 40.01 | Saint Petersburg, Russia | 83.33 |
| Rome, Italy | 40 | Amman, Jordan | 80.37 |
| Dublin, Ireland | 39.96 | Kiev, Ukraine | 77.42 |
| Bangkok, Thailand | 39.3 | Jeddah, Saudi Arabia | 76.81 |
| Haifa, Israel | 39.05 | Davao City, Philippines | 75.23 |
| Chon Buri, Thailand | 39.03 | Asuncion, Paraguay | 74.18 |
| Baku, Azerbaijan | 37.12 | London, United Kingdom | 73.93 |
| Tbilisi, Georgia | 37.08 | Hanoi, Vietnam | 73.67 |
| Chisinau, Moldova | 36.3 | Sofia, Bulgaria | 73.66 |
| Ho Chi Minh City, Vietnam | 36.09 | Manila, Philippines | 73.47 |
| Johor Bahru, Malaysia | 35.67 | Manchester, United Kingdom | 73.43 |
| Cape Town, South Africa | 35.42 | Port of Spain, Trinidad and Tobago | 73.2 |
| Ankara, Turkey | 35.27 | Brussels, Belgium | 71.71 |
| Montevideo, Uruguay | 34.82 | Buenos Aires, Argentina | 71.41 |
| Istanbul, Turkey | 34.7 | Muscat, Oman | 69.46 |
| Tehran, Iran | 34.24 | Az-Zarqa, Jordan | 67.53 |
| Guadalajara, Mexico | 32.77 | Kharkiv, Ukraine | 67.05 |
| Mashhad, Iran | 32.71 | Rome, Italy | 64.92 |
| Beirut, Lebanon | 32.35 | Zagreb, Croatia | 63.92 |
| Tel Aviv-Yafo, Israel | 31.69 | Delhi, India | 63.2 |
| Kharkiv, Ukraine | 31.06 | San José, Costa Rica | 61.44 |
| Yangon, Myanmar (Burma) | 30.98 | Prague, Czechia | 60.67 |
| Casablanca, Morocco | 30.84 | Mexico City, Mexico | 59.56 |
| Mosul, Iraq | 30.77 | Minsk, Belarus | 59.14 |
| Sfax, Tunisia | 30.74 | Maracaibo, Venezuela | 57.31 |
| Kuala Lumpur, Malaysia | 30.1 | Guadalajara, Mexico | 55.63 |
| Kingston, Jamaica | 29.89 | Lima, Peru | 53.68 |
| Moscow, Russia | 29.74 | Sydney, Australia | 53.64 |
| Baghdad, Iraq | 29.62 | Melbourne (Greater), Australia | 53.45 |
| Mexico City, Mexico | 28.28 | Arequipa, Peru | 53.4 |
| Mandalay, Myanmar (Burma) | 28.21 | Gomel, Belarus | 52.91 |
| Samarkand, Uzbekistan | 28.2 | Ulaanbaatar, Mongolia | 52.79 |
| Vientiane, Laos | 28.15 | Kathmandu, Nepal | 52.68 |
| Kiev, Ukraine | 28.15 | Guayaquil, Ecuador | 51.87 |
| Guatemala City, Guatemala | 27.89 | Johannesburg, South Africa | 51.79 |
| Buenos Aires, Argentina | 26.49 | Córdoba, Argentina | 51.67 |
| Almaty, Kazakhstan | 26.44 | Alexandria, Egypt | 51.07 |
| Manila, Philippines | 26.16 | Nur-Sultan, Kazakhstan | 50.05 |
| Tunis, Tunisia | 25.87 | Skopje, North Macedonia | 48.09 |
| Córdoba, Argentina | 25.3 | Bishkek, Kyrgyzstan | 47.85 |
| Valparaíso, Chile | 24.16 | Manama, Bahrain | 47.69 |
| Yerevan, Armenia | 23.98 | Quito, Ecuador | 47.36 |
| Tegucigalpa, Honduras | 23.93 | Almaty, Kazakhstan | 47.21 |
| Luanda, Angola | 23.93 | Tashkent, Uzbekistan | 46.27 |
| San Pedro Sula, Honduras | 23.83 | Kingston, Jamaica | 45.75 |
| Santo Domingo, Dominican Republic | 23.81 | Thessaloniki, Greece | 44.35 |
| Santiago De Los Caballeros, Dominican Republic | 23.64 | Mumbai, India | 43.56 |
| Saint Petersburg, Russia | 21.19 | Ouagadougou, Burkina Faso | 43.14 |
| San Salvador, El Salvador | 20.58 | Managua, Nicaragua | 42.68 |
| Alexandria, Egypt | 20.46 | Dhaka, Bangladesh | 40.38 |
| Cairo, Egypt | 20.43 | Yerevan, Armenia | 40.34 |
| Az-Zarqa, Jordan | 20.4 | Athens, Greece | 40 |
| Davao City, Philippines | 20.35 | Cape Town, South Africa | 39.5 |
| Amman, Jordan | 20.13 | Abidjan, Côte d’Ivoire | 38.44 |
| Kampala, Uganda | 20.01 | Ankara, Turkey | 37.42 |
| Santiago, Chile | 19.87 | Istanbul, Turkey | 36.75 |
| Nur-Sultan, Kazakhstan | 19.79 | Libreville, Gabon | 36.13 |
| Phnom Penh, Cambodia | 18.94 | Tegucigalpa, Honduras | 33.55 |
| Quito, Ecuador | 18.89 | Antananarivo, Madagascar | 33.34 |
| Lagos, Nigeria | 18.85 | Chittagong, Bangladesh | 33.02 |
| Managua, Nicaragua | 18.64 | Lome, Togo | 31.97 |
| Bishkek, Kyrgyzstan | 18.37 | Samarkand, Uzbekistan | 31.58 |
| Addis Ababa, Ethiopia | 17.29 | San Pedro Sula, Honduras | 31.53 |
| Abidjan, Côte d’Ivoire | 17.22 | San Salvador, El Salvador | 31.36 |
| San José, Costa Rica | 17.21 | Santo Domingo, Dominican Republic | 30.87 |
| Nairobi, Kenya | 17.09 | Pointe-Noire, Congo | 30.11 |
| Colombo, Sri Lanka | 16.95 | Guatemala City, Guatemala | 29.53 |
| Tashkent, Uzbekistan | 16.69 | Vientiane, Laos | 29.04 |
| Guayaquil, Ecuador | 16.6 | Accra, Ghana | 28.71 |
| Bekasi, Indonesia | 16.47 | Baku, Azerbaijan | 28.69 |
| Misrata, Libya | 16.46 | Brazzaville, Congo | 27.55 |
| South Jakarta, Indonesia | 16.14 | Bekasi, Indonesia | 27.04 |
| Dakar, Senegal | 16.13 | South Jakarta, Indonesia | 27 |
| Asuncion, Paraguay | 15.93 | Santa Cruz de la Sierra, Bolivia | 26.28 |
| Ulaanbaatar, Mongolia | 15.8 | Tbilisi, Georgia | 26.12 |
| Panama City, Panama | 15.75 | Bamako, Mali | 24.37 |
| Oran, Algeria | 15.57 | Dakar, Senegal | 23.41 |
| Lahore, Pakistan | 15.01 | La Paz, Bolivia | 23.25 |
| Delhi, India | 14.99 | Cairo, Egypt | 22.42 |
| Dhaka, Bangladesh | 14.98 | Nouakchott, Mauritania | 21.75 |
| Kathmandu, Nepal | 14.94 | Baghdad, Iraq | 21.58 |
| Lima, Peru | 14.65 | Casablanca, Morocco | 20.23 |
| Dar es Salaam, Tanzania | 14.51 | Phnom Penh, Cambodia | 19.78 |
| Arequipa, Peru | 13.5 | Dushanbe, Tajikistan | 19.61 |
| Algiers, Algeria | 13.49 | Mandalay, Myanmar (Burma) | 19.37 |
| Damascus, Syria | 12.83 | Yangon, Myanmar (Burma) | 19.03 |
| Tripoli, Libya | 12.36 | Rabat, Morocco | 17.57 |
| Mumbai, India | 12.29 | Colombo, Sri Lanka | 16.65 |
| Bogotá, Colombia | 11.99 | Cotonou, Benin | 15.97 |
| Karachi, Pakistan | 11.92 | Karachi, Pakistan | 14.82 |
| Minsk, Belarus | 11.33 | Port-au-Prince, Haiti | 14.7 |
| La Paz, Bolivia | 10.76 | Luanda, Angola | 14.18 |
| Khartoum, Sudan | 10.66 | Mombasa, Kenya | 14.08 |
| Medellín, Colombia | 10.4 | Dar es Salaam, Tanzania | 13.74 |
| Santa Cruz de la Sierra, Bolivia | 10.07 | Mosul, Iraq | 12.43 |
| Sana’a, Yemen | 9.96 | Lagos, Nigeria | 12.22 |
| Aleppo, Syria | 9.18 | Oran, Algeria | 12.09 |
| Chittagong, Bangladesh | 8.84 | Tehran, Iran | 11.9 |
| Dushanbe, Tajikistan | 8.83 | Algiers, Algeria | 11.87 |
| Gomel, Belarus | 8.72 | Santiago De Los Caballeros, Dominican Republic | 11.71 |
| Maracaibo, Venezuela | 7.75 | Lahore, Pakistan | 10.88 |
| Caracas, Venezuela | 7.16 | Kampala, Uganda | 10.6 |
| Accra, Ghana | 6.41 | Kigali, Rwanda | 9.65 |
| Kabul, Afghanistan | 5.15 | Nairobi, Kenya | 9.58 |
| Port-au-Prince, Haiti | 4.82 | Lusaka, Zambia | 9.12 |
| Havana, Cuba | 4.51 | Tunis, Tunisia | 8.54 |
North America
- United States: T-Mobile was the fastest mobile operator with a median download speed of 116.14 Mbps. Spectrum was fastest for fixed broadband at 211.66 Mbps.
- Canada: TELUS was the fastest mobile operator in Canada with a median download speed of 76.03 Mbps. Rogers was fastest for fixed broadband (223.89 Mbps).
- Mexico: Telcel had the fastest median download speed over mobile at 36.07 Mbps. Totalplay was fastest for fixed broadband at 74.64 Mbps.
Europe
- Albania: Vodafone was the fastest mobile operator with a median download speed of 46.75 Mbps. Digicom was fastest for fixed broadband at 77.83 Mbps.
- Belgium: Telenet had the fastest median download speed over fixed broadband at 126.79 Mbps.
- Denmark: YouSee was the fastest mobile operator in Denmark with a median download speed of 118.32 Mbps. Fastspeed was fastest for fixed broadband at 270.80 Mbps.
- Estonia: The fastest operator in Estonia was Telia with a median download speed of 72.95 Mbps. Elisa was fastest over fixed broadband at 84.09 Mbps.
- Finland: DNA had the fastest median download speed over mobile at 74.65 Mbps. Lounea was fastest for fixed broadband at 103.79 Mbps.
- Germany: Telekom was the fastest mobile operator in Germany with a median download speed of 78.85 Mbps. Vodafone was fastest for fixed broadband at 112.58 Mbps.
- Latvia: LMT had the fastest median download speed over mobile at 63.59 Mbps. Balticom was fastest for fixed broadband at 203.31 Mbps.
- Lithuania: The operator with the fastest median download speed was Telia with 102.09 Mbps. Cgates was fastest for fixed broadband at 131.63 Mbps.
- Poland: Orange had the fastest median download speed over mobile at 43.02 Mbps. UPC was fastest for fixed broadband at 206.22 Mbps.
- Turkey: Turkcell was the fastest mobile operator in Turkey with a median download speed of 51.92 Mbps. TurkNet was fastest for fixed broadband at 50.94 Mbps.
References:
https://www.ookla.com/articles/global-index-cities-announcement
UK Struggles in Ranking of World’s Fastest Cities for Broadband
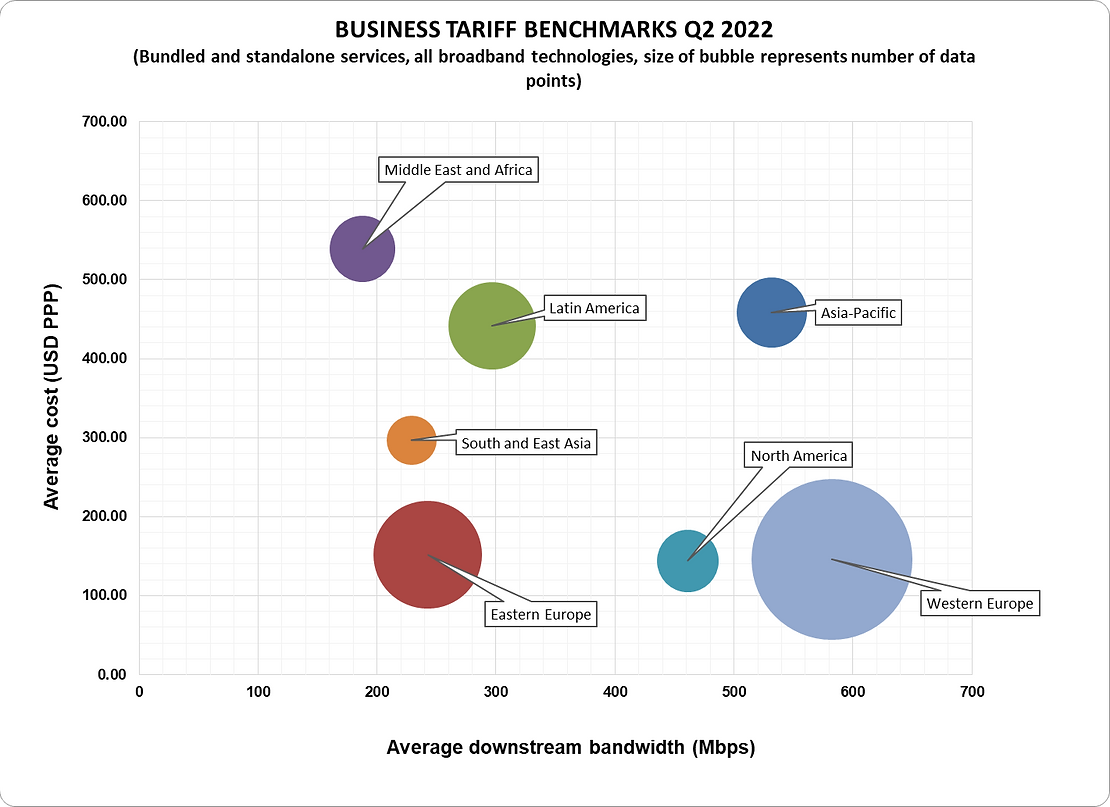
Point Topic: Global Broadband Tariff Benchmark Report- 2Q-2022
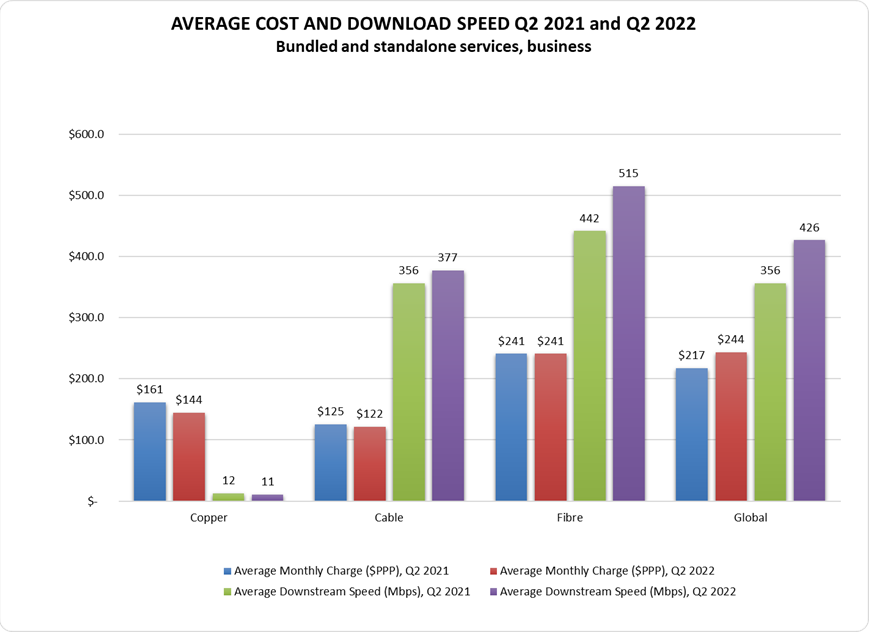
In the twelve months to the close of Q2 2022, global residential fixed line broadband subscribers saw their average monthly charges decrease by 4% on copper, cable and fiber-based tariffs. Across the three technologies the average bandwidth increased by 22% year-on-year (y-o-y), due to the increased innovation and proliferation of fiber-based networks globally. Business subscribers continued to struggle with rising monthly charges, with the average monthly charge increasing by 12% and the average downstream speed standing at 426 Mbps compared to residential tariff averages of 464 Mbps.
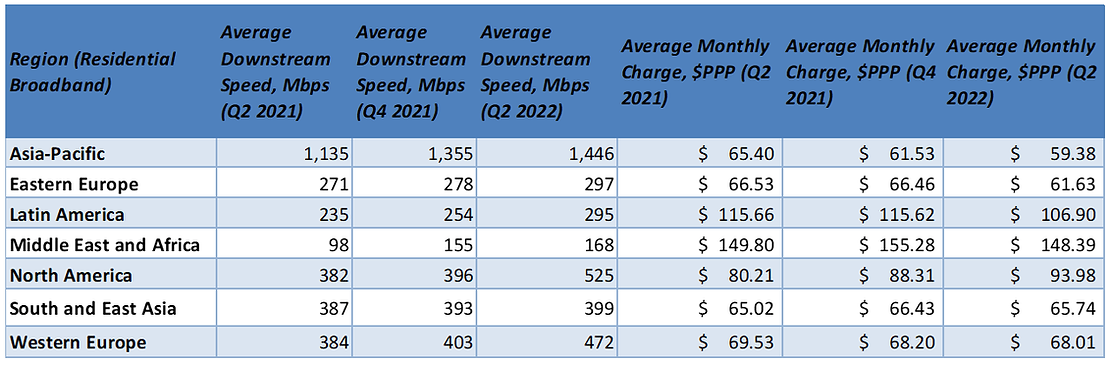
The Asia-Pacific region retained its dominant bandwidth position with average speeds of 1,146 Mbps, up from 1,355 Mbps in Q4 2021 and 1,135 Mbps y-o-y, followed by North America, Western Europe, and Southeast Asia with the three regions reaching a combined average of around 465 Mbps.
Qatar, Switzerland and Southeast Asian countries still remain at the top of the league by average bandwidth along Italy, France and Bulgaria; these countries all rank in the top ten cheapest for residential broadband in terms of average cost per Mbps being less than $0.10 PPP.


In Q2 2022, the combined average download bandwidth grew by 20% compared to Q2 2021 and stood at 426 Mbps. This was caused by the boost in the average speed over cable and especially fibre, 14% and 22% respectively. Copper maintained largely the same average download speed compared to the previous quarter. However, the overall global average monthly cost across the three technologies has increased by just over 12% from $217 PPP to $244 PPP at the close of Q2 2022


References:
Global Broadband Tariff Benchmark Report, Q2 2022 (point-topic.com)
2022 Study of broadband pricing in 220 countries reveals vast global disparities
Cable.co.uk has released a report listing what it found were the cheapest and most expensive countries and regions for broadband internet access all over the world. The study was based on of 3,356 fixed-line broadband deals in 220 countries between 19 January 2022 and 30 March 2022.
- Syria had the cheapest fixed-line broadband with an average monthly cost of $2.15 per month, which the report attributes to a collapse of the Syrian Pound (SYP) against the U.S. dollar.
- Burundi was the most expensive with a whopping average package price of $429.95 per month.
Most expensive:
- Burundi (average cost $429.95 per month)
- Sierra Leone (average cost $316.69 per month)
- Brunei Darussalam (average cost $258.42 per month)
- Virgin Islands (British) (average cost $184.00 per month)
- Turks and Caicos Islands (average cost $170.50 per month)
Cheapest:
- Syria (average cost $2.15 per month)
- Sudan (average cost $4.80 per month)
- Belarus (average cost $7.40 per month)
- Ukraine (average cost $7.40 per month)
- Russian Federation (average cost $8.07 per month)
Here are the monthly rates for several developed countries: Germany = $27.81; France= $28.92; South Korea $29.54; Spain = $35.04; UK = $39.01; Japan = $47.23; U.S. = $55.00; Australia – $59.42.
For regions, the most expensive to cheapest is:
- North America (average cost $89.44 per month)
- Oceania (average cost $85.14 per month)
- Caribbean (average cost $78.44 per month)
- Sub-Saharan Africa (average cost $77.70 per month)
- Near East (average cost $60.62 per month)
- South America (average cost $55.17 per month)
- Western Europe (average cost $49.25 per month)
- Central America (average cost $43.87 per month)
- Asia (Excl. Near East) (average cost $40.29 per month)
- Northern Africa (average cost $22.41 per month)
- Eastern Europe (average cost $19.90 per month)
- Baltics (average cost $19.19 per month)
- CIS (Former USSR) (average cost $13.96 per month)
“This year we have noticed a greater weighting towards currency devaluation in the top half of the table,” said Dan Howdle, consumer telecoms analyst at Cable.co.uk. “For example, first-place Syria, whose Syrian Pound has lost three-quarters of its value against the US dollar in the last 12 months. Island nations such as those in the Caribbean and Oceania continue to present problems when it comes to providing cheap, fast connectivity options. Those lucky enough to have an undersea cable running close by tend to be able to offer it, where others have to lean into pricier hybrid satellite, 4G and/or WiMAX solutions.
“It’s hard to see how more affordable connectivity for the general population will be coming anytime soon to those countries at the bottom of the table, plagued as they are with limitations that are geographical and geopolitical, and where there is a lack of desire in the marketplace for fixed-line broadband solutions.”
This year’s excluded countries are: Cocos (Keeling Islands), Central African Republic, Western Sahara, Guinea, British Indian Ocean Territory, Kiribati, North Korea, Northern Mariana Islands, Malawi, Niger, Nauru, Solomon Islands, South Sudan, Chad, Tuvalu, Vatican and Venezuela.
References:
https://www.cable.co.uk/broadband/pricing/worldwide-comparison/#speed
https://telecoms.com/514570/broadband-prices-ranked-uk-is-92nd-cheapest-in-the-world/
Omdia: Big increase in Gig internet subscribers in 2022; Top 25 countries ranked by Cable
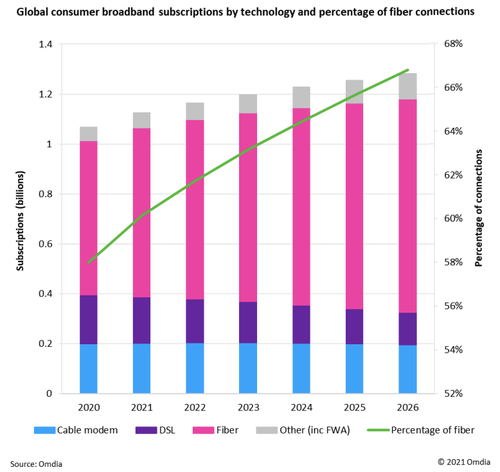
Global gigabit internet subscriptions are expected to increase to 50 million in 2022, more than doubling from 24 million at the end of 2020, according to a new report from market research firm Omdia (owned by Informa).
The Omdia report states that accelerated fiber deployments are helping to drive an increase in gigabit connectivity.
“Demand for reliable broadband is set to drive growth in gigabit services, with fiber playing a key role,” said Peter Boyland, principal analyst, broadband at Omdia.
“There were fewer than 620 million fiber subscriptions globally at the end of 2020, but we expect these to grow to 719 million in 2022, or 62% of total subscriptions.” The majority of fiber internet subscribers are expected to be in China.
However, Omdia warns that service providers must “carefully consider market demand” for their gigabit strategies and make targeted investments in fiber.
“Service providers need to carefully plan and execute gigabit network rollout, analyzing a number of factors, including infrastructure challenges, market competition, and expected demand,” writes Omdia. “But this does not stop with network rollout – operators need to continually monitor potential competitors and constantly innovate, refresh, and build service offerings so they stay ahead of rivals.”
The analysts also point out the opportunity for vendors in the market who can help service providers build “future proof” networks. “Vendors can offer long-term solutions such as monitoring and automation tools to extend the operator/vendor relationship beyond network rollouts,” the report recommends.
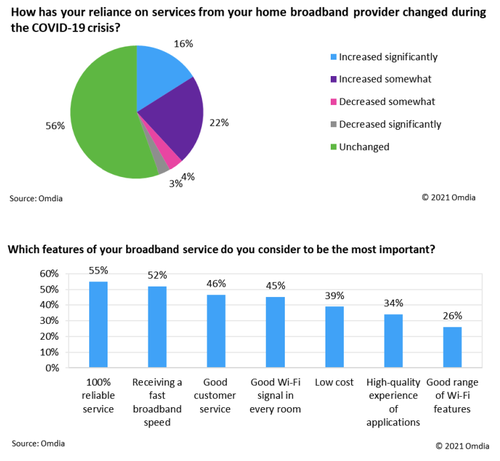
Of course, what matters most to consumers is reliable service. According to Omdia’s Digital Consumer Insights survey, 36% of respondents said they were more reliant on broadband services during COVID-19, and 55% of respondents said reliability ranked top among the most important home broadband features.
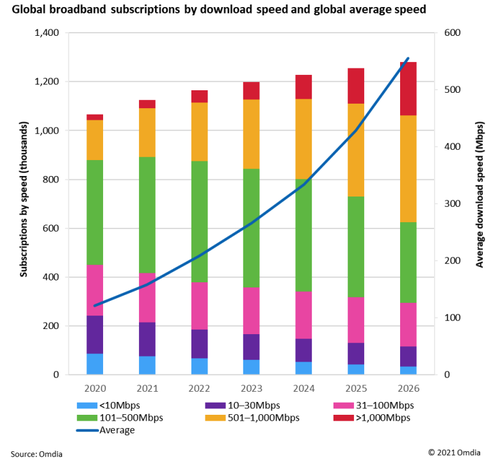
All of this gigabit and fiber growth will impact broadband speeds for years to come. According to Omdia:
“In 2020, just 2% of broadband subscriptions were more than 1Gbps, but this is expected to double to 4% in 2022.”
–>See table below for the 25 countries with the fastest AVERAGE internet speeds, ranked by Cable. Note that none of them is close to 1Gbps.
The report says that subscribers with access to 500 Mbit/s-1 Gbit/s will increase from 15% in 2020 to 21% in 202, with 17% of broadband subscriptions projected to reach speeds over 1 Gbit/s by 2026.
While high-bandwidth entertainment like augmented and virtual reality (AR/VR) and gaming were thought to be the main drivers for ever-faster home broadband speeds in pre-pandemic times, Omdia’s report doesn’t think they are significantly important for gigabit Internet growth, referring to them just once as “other drivers.”
……………………………………………………………………………………………
Internet comparison site Cable has ranked the countries with the fastest broadband internet in the world based on over 1.1 billion speed tests across 224 countries and territories.
“The acceleration of the fastest countries in the world has finally plateaued this year as they reach FTTP pure fibre saturation. Increases in speed among the elite performers, then, can be attributed in greater part to uptake in many cases than to network upgrades. Meanwhile, though the countries occupying the bottom end of the table still suffer from extremely poor speeds, 2021’s figures do indicate that the situation is improving,” said Dan Howdle of Cable.
Here are the 25 countries with the fastest download speeds:
| 1 | Jersey | JE | WESTERN EUROPE | 274.27 |
| 2 | Liechtenstein | LI | WESTERN EUROPE | 211.26 |
| 3 | Iceland | IS | WESTERN EUROPE | 191.83 |
| 4 | Andorra | AD | WESTERN EUROPE | 164.66 |
| 5 | Gibraltar | GI | WESTERN EUROPE | 151.34 |
| 6 | Monaco | MC | WESTERN EUROPE | 144.29 |
| 7 | Macau | MO | ASIA (EX. NEAR EAST) | 128.56 |
| 8 | Luxembourg | LU | WESTERN EUROPE | 107.94 |
| 9 | Netherlands | NL | WESTERN EUROPE | 107.30 |
| 10 | Hungary | HU | EASTERN EUROPE | 104.07 |
| 11 | Singapore | SG | ASIA (EX. NEAR EAST) | 97.61 |
| 12 | Bermuda | BM | NORTHERN AMERICA | 96.54 |
| 13 | Japan | JP | ASIA (EX. NEAR EAST) | 96.36 |
| 14 | United States | US | NORTHERN AMERICA | 92.42 |
| 15 | Hong Kong | HK | ASIA (EX. NEAR EAST) | 91.04 |
| 16 | Spain | ES | WESTERN EUROPE | 89.59 |
| 17 | Sweden | SE | WESTERN EUROPE | 88.98 |
| 18 | Norway | NO | WESTERN EUROPE | 88.67 |
| 19 | France | FR | WESTERN EUROPE | 85.96 |
| 20 | New Zealand | NZ | OCEANIA | 85.95 |
| 21 | Malta | MT | WESTERN EUROPE | 85.20 |
| 22 | Estonia | EE | BALTICS | 84.72 |
| 23 | Aland Islands | AX | WESTERN EUROPE | 81.31 |
| 24 | Canada | CA | NORTHERN AMERICA | 79.96 |
| 25 | Belgium | BE | WESTERN EUROPE | 78.46 |
It is the fourth year of the assessment and the latest ranking uses data collected in the 12 months up to 30th June 2021 to evaluate internet speed by country.
References:
https://www.cable.co.uk/broadband/speed/worldwide-speed-league/
GAO: U.S. Broadband Benchmark Speeds Too Slow; FCC Should Analyze Small Business Speed Needs
In a report released Thursday, the U.S. Government Accountability Office (GAO) said that the FCC’s benchmark for minimum broadband internet speeds (set six years ago at “always on” access of 25 Mbps downstream and 3 Mbps upstream) is no longer fast enough. That’s especially the case for small business owners. After conducting a study on the matter, the GAO recommends the FCC analyze small business speed requirements at this time and reconsider its current definition.
“FCC officials said they are not aware of any small business requirements that have been taken into consideration in determining the minimum speed benchmark,” the GAO says. “Analyzing small business speed requirements could help inform FCC’s determination of the benchmark speed for broadband.”

The figure below illustrates the various kinds of business broadband use and the associated relative speed requirements.
Illustrative Examples of Different Kinds of U.S. Business Broadband Use:

Sources vary in terms of the specific speeds they recommend for small businesses. For example, in 2017, BroadbandUSA—a National Telecommunications and Information Administration program—published a fact sheet stating that small businesses need a minimum of 50 Mbps speeds in order to conduct tasks such as managing inventory, operating point-of-sale terminals, and coordinating shipping. A 2019 USDA report on rural broadband and agriculture stated that, as technology advances and volumes of data needed to manage agriculture production grow, speeds in excess of 25/3 Mbps with more equal download and upload speeds will likely be necessary.
Reports from small businesses show that many want a download speed of at least 100 Mbps to run their operations more effectively. According to the FCC’s data, about 67 percent of rural Americans have access to 100 Mbps down/10 Mbps up speeds, compared to about 83 percent with access to the agency’s current minimum benchmark.
To fulfill a statutory requirement to determine annually whether advanced telecommunications capability is being deployed on a reasonable and timely basis to all Americans, FCC sets a minimum broadband speed benchmark.
In its 2021 Broadband Deployment Report, FCC stated that the current benchmark, last set in 2015, continues to meet that requirement. However, FCC officials said they are not aware of any small business requirements that have been taken into consideration in determining the minimum speed benchmark. Analyzing small business speed requirements could help inform FCC’s determination of the benchmark speed for broadband.
Recommendations:
GAO is making one recommendation to FCC to solicit stakeholder input and analyze small business broadband speed needs and incorporate the results of this analysis into the benchmark for broadband. FCC agreed with this recommendation.
References:
https://www.gao.gov/products/gao-21-494
https://www.gao.gov/assets/gao-21-494-highlights.pdf
https://gizmodo.com/the-fccs-definition-of-broadband-internet-is-too-slow-1847257425
