

Verizon Software-Defined Interconnect: Private IP network connectivity to Equinix global DC’s
Verizon today announced the launch of Software-Defined Interconnect (SDI), a solution that works with Equinix Cloud Exchange Fabric™ (ECX Fabric™), offering organizations with a Private IP network direct connectivity to 115 Equinix International Business Exchange™ (IBX ®) data centers (DC’s) around the globe within minutes.
Verizon claims its new Private IP service [1] provides a faster, more flexible alternative to traditional interconnectivity, which requires costly buildouts, long lead times, complex provisioning and often truck rolls: APIs are used to automate connections and, often, reduce costs, boasts Verizon. The telco said in a press release:
SDI addresses the longstanding challenges associated with connecting premises networks to colocation data centers. To do this over traditional infrastructure requires costly build-outs, long lead times and complex provisioning. The SDI solution leverages an automated Application Program Interface (API) to quickly and simply integrate pre-provisioned Verizon Private IP bandwidth via ECX Fabric, while eliminating the need for dedicated physical connectivity. The result is to make secure colocation and interconnection faster and easier for customers to implement, often at a significantly lower cost.
Note 1. Private IP is an MPLS-based VPN service that provides a simple network designed to grow with your business and help you consolidate your applications into a single network infrastructure. It gives you dedicated, secure connectivity that helps you adapt to changing demands, so you can deliver a better experience for customers, employees and partners.
Private IP uses Layer 3 networking to connect locations virtually rather than physically. That means you can exchange data among many different sites using Permanent Virtual Connections through a single physical port. Our MPLS-based VPN solution combines the flexibility of IP with the security and reliability of proven network technologies.
……………………………………………………………………………………………………………
“SDI is an addition to our best-in-class software-defined suite of services that can deliver performance ‘at the edge’ and support real-time interactions for our customers,” said Vickie Lonker, vice president of product management and development for Verizon. “Think about how many devices are connected to data centers, the amount of data generated, and then multiply that when 5G becomes ubiquitous. Enabling enterprises to virtually connect to Verizon’s private IP services by coupling our technology with the proven ECX Fabric makes it easy to provision and manage data-intensive network traffic in real time, lifting a key barrier to digital transformation.”
Verizon’s private IP – MPLS network is seeing high double-digit traffic growth year-over-year, and the adoption of colocation services continues to proliferate as more businesses grapple with complex cloud deployments to achieve greater efficiency, flexibility and additional functionality in data management.
“Verizon’s new Software Defined Interconnect addresses one of the leading issues for organizations by improving colocation access. This offer facilitates a reduction in network and connectivity costs for accessing colocation data centers, while promoting agility and innovation for enterprises. This represents a competitive advantage for Verizon as it applies SDN technology to improve interconnecting its Private IP MPLS network globally,” said Courtney Munroe, group vice president at IDC.
“With Software-Defined Interconnect, a key barrier to digital transformation has been lifted. By allowing enterprises to virtually connect to Verizon’s private IP services using the proven ECX Fabric, SDI makes secure colocation and interconnection easier – and more financially viable – to implement than ever before,” said Bill Long, vice president, interconnection services at Equinix [2].
Note 2. Equinix Internet Exchange™ enables networks, content providers and large enterprises to exchange internet traffic through the largest global peering solution across 52 markets.
………………………………………………………………………………………………………
Expert Opinion:
SDI is an incremental addition to Verizon’s overall strategy of interconnecting with other service providers to meet customer needs, as well as virtualizing its network, says Brian Washburn, an analyst at Ovum (owned by Informa as is LightReading and many other market research firms).
“Everything can be dynamic, everything can be made pay-as-you-go, everything can be controlled as a series of virtual resources to push them around the network as you need it, when you need it,” Washburn says.
For Equinix, the Verizon deal builds its gravitational pull. “It pulls in assets and just connects as many things to other things as possible. It is a virtuous circle. The more things they get into their data centers, the more resources they have there, that pulls in more companies to connect to the resources,” Washburn says. Equinix is standardizing its APIs to make interconnections easily.
SDI is similar to CenturyLink Dynamic Connections, which connects enterprises directly to public cloud services. And telcos are building interconnects with each other; for example, AT&T with Colt. “I expect we’ll see more of this sort of automation taking advantage of Equinix APIs,” Washburn says.
Microsoft also provides a virtual WAN service to connect enterprises to Azure. “It’s a different story, but it falls into the broader category of automation between network operators and cloud services,” Washburn said.
…………………………………………………………………………………………………………..
Verizon manages 500,000+ network, hosting, and security devices and 4,000+ networks in 150+ countries. To find out more about how Verizon’s global IP network, managed network services and Software-Defined Interconnect work please visit:
https://enterprise.verizon.com/products/network/connectivity/private-ip/
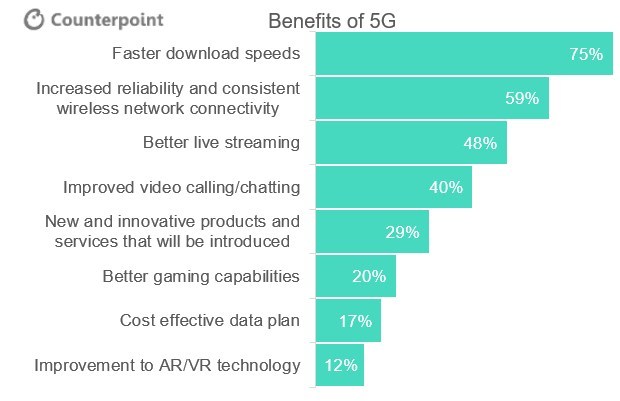
Counterpoint Research’s 5G Consumer Opinion Survey + Rebuttal
SOURCE: Counterpoint Research
Out of the total number of US consumers polled by Counterpoint Research’s 5G Consumer Opinion Survey, 81% find 5G ‘appealing’ or ‘very appealing’ over 4G service. Further, purchasing intent for 5G handsets is high. Over 59% of respondents were ‘very interested’ or ‘extremely interested’ for purchasing a 5G smartphone.
Commenting on the findings, Tom Kang, Research Director at Counterpoint Research, said, “This study is good news for handset OEMs and carriers who have invested heavily in 5G. Consumers have a very positive opinion about 5G despite not having a clear understanding of its capabilities. The study revealed there is tremendous interest in 5G and that over 30% of consumers are willing to buy a 5G device even if 5G is not yet available where they live.”
Another insight the Counterpoint survey revealed was that consumers do not have high initial expectations of 5G. Consumers look forward to faster download speeds and improved network experience of currently available applications.
Despite rather low service expectations, 95% of respondents expect to pay more for their 5G smartphone than what they paid for a 4G smartphone. A total of 75% of the respondents commented they expected to pay US$1,000 or less.
Research Director Jeff Fieldhack commented, “There appears to be a price ceiling at US$1,000 for most consumers. This is an important data point for handset OEMs. The positive news for handset OEMs is that there is very high brand loyalty when buying 5G devices. Even handset OEMs with low overall market share had brand loyalty above 82%. The loyalty is not nearly as high on the carrier side. Almost 50% of respondents were willing to switch carriers for access to 5G. The big four US carriers were smart to all launch 5G nearly simultaneously and not fall behind on the marketing war.”
………………………………………………………………………………………………..
Please feel free to contact us at [email protected] for further questions regarding our latest in-depth research, insights or press inquiries.
Analyst Contacts:
Jeff Fieldhack
(858) 603-2703
[email protected]
Tom Kang
[email protected]
Follow Counterpoint Research
[email protected]
……………………………………………………………………………………………………..
Opinion: The consumers polled have been hoodwinked by wireless carriers and equipment companies that have announced pre-standard “5G” roll-outs. These are mostly all based on 3GPP Rel 15 5G NR NSA which will be replaced by 3GPP Rel 16 in 2020. Very few 5G smartphones are available and they only work on a single “5G” carrier network, i.e. there is no roaming.
Lightreading reported today that 5G mmWave smartphones overheat when the outside temperature is high.
The expensive ($1,300) and short-range (up to 2,000 feet) Samsung S10 5G phones that are being used for early consumer tests of 5G promise speeds of over 1 Gbit/s on 5G networks. The catch? They can overheat as the temperature gets hotter.
“When I ran tests, the phone’s 5G often switched off due to overheating, leaving me with a 4G connection,” reports the Wall Street Journal’s Joanna Stern in a multi-city test of the 5G devices recently.
During 80 and 90-degree days, In Atlanta, New York and Chicago, Stern used ice packs, air conditioning in cars or simply the sun going down to cool the phones.
Samsung says the S10 5G phone can switch to a 4G connection when the phone reaches a certain temperature to preserve battery life and optimize operation. “As 5G technology and the ecosystem evolve, it’s only going to get better,” a Samsung spokeswoman told the Journal.
AT&T, T-Mobile and Verizon presently operate limited mmWave 5G networks in cities in the US. The higher-frequency 28GHz and 39GHz bands used in millimeter wave can have short signal coverage ranges, don’t work indoors and could even suffer from fingers directly blocking the high-frequency antennas.
A Lightreading report (sponsored by Ericsson) states:
43 % of iPhone owners and 39 percent of Android users with new devices bought in the past year say the smartphone form factors and features of today are not capable of taking advantage of 5G promises.
Globally, 50 percent of consumers believe that smartphones will still exist but we will all be wearing AR glasses by 2025.
“The smartphone will be dead in five years’ time,” predicts Johan Hagegård at IMRSV, an AR/VR innovation house. “I will instead have smart glasses in front of me all the time.”
Matt Stagg of EE agrees with this bold prediction: “The smartphone as we see it now does not have anything on it. It can’t take advantage of 5G, such as holographic apps, in the longer term.” Maybe it doesn’t stop there.
Maarten Ectors, Chief Innovation Officer of Legal & General, thinks that screens will be replaced altogether. “We will be going away from a world dominated by screens to other ways of projecting imagery; for example, three-dimensional projection or translucent types of screen. Glasses will come with projection capabilities for commercial usage.”
SK Telecom Builds ‘5G Cluster’ which includes AR, VR, and AI for South Korea
Overview of ‘5G Cluster:”
SK Telecom today announced its strategy to build ‘5G Cluster’ nationwide to further foster 5G services and benefits. Since the world’s first “5G” commercialization in April 2019, the number of 5G subscribers in South Korea has surpassed 1 million- far more than in any other country.
SK Telecom’s ‘5G Cluster’ is an advanced 5G environment with cutting-edge ICT including AR, VR, and AI. The Korean telco plans to build ‘5G Cluster’ in business districts, parks, factories, and etc. to provide differentiated 5G service and benefits in both of B2C and B2B sectors.
In the B2C sector, SK Telecom will operate ‘5G League of Legends (LoL) Park’ at Jonggak, Seoul, starting from July 25. At ‘5G LoL Park’, customers can view messages from supporting fans nationwide with Augmented Reality (AR) by facing their smartphones toward a certain location. Customers can also enjoy VR live broadcasting and VR playback during the games.
Starting this August, SK Telecom will provide a service that allows customers to meet a variety of animals, including giant cats and wyverns (a winged two-legged dragon with a barbed tail), using AR in Olympic Park and Yeouido Park, Seoul. For example, if customers hold their smartphones toward ‘The Lone Tree’ in Olympic Park, a giant cat will appear on smartphone screen in AR.
Moreover, the company plans to transform Jamsil Students’ Gymnasium into a 5G Stadium. SKTelecom will further expand 5G experience spaces with immersive media by the end of this year.
In the B2B sector, SK Telecom will apply 5G network and ‘Mobile Edge Computing’ (MEC) solution to SK Hynix to build a ‘5G Smart Factory’. The two companies expect that this will drastically reduce time to detect defective semiconductor products and more efficiently manage production and logistics.
Furthermore, SK Telecom plans to build a total of 12 Mobile Edge Computing (MEC) for 5G networks, to be located at key regions nationwide (South Korea). In particular, the company will provide dedicated 5G edge cloud service for enterprises that are in need of security and ultra-low latency communications, including manufacturing, media, finance, and game industry.
“With ‘5G Cluster’ as our key focus, SK Telecom will provide customers with outstanding service and pleasure that are beyond the imagination,” said Yoo Young-sang, Executive Vice President and Head of MNO Business of SK Telecom. “We will strive to create added values to different industries and regions.”

Yoo Young-sang, head of mobile network operator business at SK Telecom, speaks during a press conference at the company’s 5G smart office in Seoul, Thursday. Photo Courtesy of SK Telecom
“We are currently constructing smart factory systems at SK Hynix plants. We expect our 5G services will enable many companies in the manufacturing sector to use the automated logistics system and control manufacturing process in real time,” Yoo said. “By accumulating practical experiences with SK Hynix, we will bring about technological innovation.”
……………………………………………………………………………………………………………………………………………………………………………
About SK Telecom:
SK Telecom is the largest mobile operator in Korea with nearly 50 percent of the market share. As the pioneer of all generations of mobile networks, the company has commercialized the fifth generation (5G) network on December 1, 2018 and announced the first 5G smartphone subscribers on April 3, 2019. With its world’s best 5G, SK Telecom is set to realize the Age of Hyper-Innovation by transforming the way customers work, live and play.
Building on its strength in mobile services, the company is also creating unprecedented value in diverse ICT-related markets including media, security and commerce.
For more information, please contact [email protected] or [email protected]
………………………………………………………………………………
Related posts:
SK Telecom and Samsung Bring South Korea Closer to 5G Standalone Commercialization
MWC 2019: Korean companies set to present new world of 5G connectivity & smart phones
OpenSignal reports on 5G Speeds and 4G LTE Experience in South Korea & Other Countries
ITU-R WP5D Brazil Meeting: Complete IMT 2020 RIT/SRITs from 3GPP, China & Korea advance; Nufront submits new EUHT RIT
SOURCE: Meeting Report of ITU-R WP5D Working Group on Technology Aspects (17 July 2019)
IMT-2020 RIT/SRITs:
This past week’s 32nd meeting of ITU-R WP 5D in Brazil was a milestone for the IMT-2020 process described in Document IMT 2020/2(Rev.1): Step 3 – submission / reception of the RIT and SRIT proposals and acknowledgement of receipt.
Seven submissions of candidate IMT-2020 RIT/SRITs were received at this meeting. Importantly, some were updates to their previous submissions.
- 3GPP – RIT
- 3GPP -SRIT
- China (People’s Republic of)
- South Korea (Republic of)
- ETSI (TC DECT) and DECT Forum
- TSDSI (India)
- Nufront [1]
Note 1. At this week’s ITU-R WP5D meeting in Brazil, Nufront (Beijing) Technology Co. Ltd (Nufront) proposed ‘EUHT’ RIT as the candidate IMT-2020 radio interface technology. The Nufront new candidate RIT is in addition to the RIT/SRITs previously input by 3GPP, China, South Korea, TSDSI (India), ETSI/DECT Forum.
Nufront provided the characteristics template, link budget template, compliance template, and self-evaluation report of the EUHT RIT. The submission templates follow the ITU-R IMT-2020 submission format and guidelines as defined in Report ITU‑R M.2411.
–>Please refer to my Comment in the box below this article. It provides background on motivation for Nufront’s EUHT RIT proposal and their (failed) attempt to get IEEE 802.11AX to be included as either a merged RIT or a SRITs.
…………………………………………………………………………………………………………………………………………………………………………………..
After review of all the submissions (see Table 1. below) under the IMT-2020 process Step 3 (the cut off date for submissions of candidate IMT 2020 RIT/SRITs), the meeting determined that the submissions from 3GPP (SRIT and RIT), China and Korea are “complete” per section 5 of Report ITU-R M.2411. Therefore, they fulfilled the requirements for submission in Step 3 of the IMT-2020 process.
The meeting is of the view that, the supplied self-evaluation and any amendments accepted during this meeting for the submissions of ETSI (TC DECT) and DECT Forum (the component RIT DECT-2020 NR), Nufront and TSDSI do not yet permit WP 5D to determine if a complete and satisfactory self-evaluation as required by the IMT-2020 process has been fully provided.
A way forward for these submissions has been agreed by the meeting (Doc. 5D/TEMP/778-only available to those who have a TIES account). The Proponents should provide the full details requested in the process and in the specifically defined way to WP 5D, considering the comments raised in this meeting, in order for WP 5D to proceed further in the process with the submissions.
A decision on the submission above shall be taken in 33rd meeting WP 5D in December 2019.
For convenience, these submitted proposals are also posted on the “Web page for IMT-2020 submission and evaluation process.”
Under the IMT-2020 submission and evaluation process, the ITU-R will now proceed with the detailed evaluation of the proposed candidate technologies until 34th meeting of WP 5D in February 2020.
Table 1. Candidate RIT/SRIT Submissions from 3GPP, China, Korea, ETSI and DECT Forum, Nufront and TSDSI:
Seven submissions of candidate IMT-2020 RIT/SRITs were received at this meeting; some were updates to their previous submissions.
Table 3.4.3.A (documents listed are only available to those who have a TIES account with itu.int)
| RIT/SRIT Proponent | Candidate Technology Submission |
| 3GPP – SRIT | Docs. 5D/1215 and 5D/1216 |
| 3GPP – RIT | Docs. 5D/1215 and 5D/1217 |
| China (People’s Republic of) | Doc. 5D/1268 |
| Korea (Republic of) | Doc. 5D/1233 |
| ETSI (TC DECT) and DECT Forum | Docs. 5D/1230 and 5D/1253 |
| Nufront | Doc. 5D/1238 |
| TSDSI | Doc. 5D/1231 |
………………………………………………………………………………………………………………………………………………………………………………………….
IMT-2020/VVV:
The meeting agreed to complete this document (IMT-2020/VVV) at this meeting, rather than the original plan of the #34 meeting. During development of the document, it was agreed to follow the approach adopted by WP 5D for the development of IMT-Advanced (aka “LTE Advanced).
The finalized new IMT-2020/VVV document on “Process and use of the Global Core Specification (GCS), references, and related certifications in conjunction with Recommendation ITU-R M.[IMT-2020.SPECS]” is in Document 5D/TEMP/728 (only available to those who have a TIES account).
…………………………………………………………………………………………………………………………………………………………………………………………..
Synchronization of multiple IMT-2020 TDD networks:
This meeting received two input documents and continued the discussion. It was decided to carry forward all the input documents and to continue the work at the WP 5D #34 meeting in February 2020 (see Objectives for meeting #34 below).
…………………………………………………………………………………………………………………………………………………………………………………………..
Documents for consideration by WP 5D closing plenary:
The following documents were agreed by WG Technology Aspects and were provided to WP 5D closing plenary for approval.
- Draft IMT-2020/VVV − Process and the use of Global Core Specification (GCS), references and related certifications in conjunction with Recommendation ITU R M.[IMT-2020.SPECS]
- Draft IMT-2020 document − Detailed schedule for finalization of the first release of new Recommendation ITU-R M.[IMT-2020.SPECS] “Detailed specifications of the terrestrial radio interfaces of International Mobile Telecommunications-2020 (IMT-2020)”
- Liaison statement to External Organizations on the detailed schedule for finalization of the first release of new Recommendation ITU-R M.[IMT‑2020.SPECS]
- Liaison statement to 3GPP proponent concerning the time interval to provide transposing references for IMT 2020
- Many more documents, which are beyond the scope of the IEEE Techblog
…………………………………………………………………………………………………………………………………………………………………………………………..
Objectives for the ITU-R WP 5D meetings #33 and #34:
I. The next ITU-R WP 5D meeting #33, scheduled to be held in December 2019, will be entirely focused on the activities of the Technology Aspects Working Group. It should be noted that neither the General Aspects Working Group nor the Spectrum Aspects Working Group will be in session at the 33rd meeting. The next meeting at which Working Group Spectrum Aspects will be in session will be at the 34th meeting of WP 5D scheduled to be held in February 2020.
5D meeting #33 will be a focused meeting on the following technology aspects and will include the workshop on evaluation of IMT-2020 terrestrial radio interfaces (Doc. 5D/TEMP/809):
- Review additional materials to be provided by the candidate IMT-2020 RIT/SRIT proponents ETSI (TC DECT) and DECT Forum, Nufront and TSDSI, per the agreed way forward at the 32nd WP 5D meeting with regard to their respective submissions;
- Review of external activities in Independent Evaluation Groups through interim evaluation reports.
- Continue work on revision of Recommendation ITU-R M.1457-14
Note: SWG Out of band emissions and SWG Radio Aspects will not have any session at the WP 5D #33 meeting. Contributions to the respective work items would be considered at the WP 5D #34 meeting.
II. The key objectives of the Technology Aspects WG for the 34th ITU-R WP 5D meeting:
- Review of external activities and evaluation reports of Independent Evaluation Groups. Complete evaluation reports summary (IMT-2020/ZZZ).
- Continue the work on “Over-the-air (OTA) TRP field measurements for IMT radio equipment utilizing AAS” based on the requested response from 3GPP and expected input from other organisations and administrations.
- Continue work on revision of Recommendation ITU-R M.1457-14.
- Continue work on synchronization of multiple IMT-2020 TDD networks.
Special Details About WP 5D Meeting #33 – December 2019:
This is a focused Technology Aspects Working Group meeting on the conclusion of Step 3, continuation of Step 4, and the evaluation of IMT-2020 submitted candidate technologies including a Workshop, and related matters. Sessions of the meeting of the Working Groups and their SWGs in WP 5D meeting #33 are:
| Working Groups/SWGs | |
| Technology Aspects | IN SESSION |
| SWG COORDINATION
SWG EVALUATION SWG IMT SPECIFICATIONS |
IN SESSION |
| General Aspects | NOT in session |
| Spectrum Aspects | NOT in Session |
| Ad Hoc Workplan | IN SESSION –
ONLY for matters directly related to the Technology Aspects WG |
……………………………………………………………………………………………………………………………………………………………………………..
Appendix I: High-level scopes for Working Party 5D working and Ad hoc Groups:
| Group | Scope | Chairman |
| WG GENERAL ASPECTS | – To develop deliverables on services, forecasts, and also convergence of services of fixed and mobile networks which take account the needs of end users, and the demand for IMT capabilities and supported services. This includes aspects regarding the continued deployment of IMT, other general topics of IMT and overall objectives for the long-term development of IMT. To update the relevant IMT Recommendations/Reports.
– To ensure that the requirements and needs of the developing countries are reflected in the work and deliverables of WP 5D in the development of IMT. This includes coordination of work with ITU-D Sector on deployments of IMT systems and transition to IMT system. |
K.J. WEE
Korea |
| WG TECHNOLOGY ASPECTS | – To provide the technology related aspects of IMT through development of Recommendations and Reports. To update the relevant IMT‑2000 and IMT-Advanced Recommendations. To work on key elements of IMT technologies including requirements, evaluation, and evolution. To develop liaison with external research and standardization forums, and to coordinate the external and internal activities related to the IMT-2020 process.
– To manage the research topics website and its findings. |
H. WANG
China |
| WG SPECTRUM ASPECTS | – To undertake co-existence studies, develop spectrum plans, and channel/frequency arrangements for IMT. This includes spectrum sharing between IMT and other radio services/systems coordinating as appropriate with other Working Parties in ITU-R. | A. JAMIESON
New Zealand |
| AD HOC WORKPLAN | – To coordinate the work of WP 5D to facilitate efficient and timely progress of work items. | H. OHLSEN
Sweden |
Appendix II: Work with involved organizations, including research entities:
The strategy for ITU-R WP 5D going forward is to gather information from the organizations involved in the global research and development and those that have an interest in the future development of IMT and to inform them of the framework and technical requirements in order to build consensus on a global level.
ITU-R WP 5D can play an essential role to promote and encourage these research activities towards common goals and to ensure that information from the WP 5D development on the vision, spectrum issues, envisioned new services and technical requirements are widespread among the research community. In the same manner, WP 5D encourages inputs from the external communities involved in these research and technology developments.
It is evident that continuing dialogue between the ITU and the entities taking part in research is a key to the continuing success of the industry in advancing and expanding the global wireless marketplace.
Working Party 5D, as is the case with all ITU organizations, works from input contributions submitted by members of the ITU. In order to facilitate receipt of information from external entities who may not be direct members of ITU, the Radiocommunication Bureau Secretariat may be considered as the point of interface, in accordance with Resolution ITU-R 9‑5.
The following major activities are foreseen to take place outside of the ITU, including WP 5D, in order to successfully complement the WP 5D work:
–Research on new technologies to address the new elements and new capabilities of IMT‑2020;
–Ongoing development of specifications for IMT and subsequent enhancements.
Appendix III: Agreed overall deliverables/work plan of WP 5D and technical requirements in order to build consensus on a global level:
The following table provides the schedule of when approval of the planned major deliverables will be achieved following the procedures of WP 5D.
| Date | Meeting | Anticipated Milestones |
| December 2019 | Geneva WP 5D #33
(max. 4 day meeting) |
• Focus meeting on evaluation – review of external activities in Independent Evaluation groups through interim evaluation reports
• Workshop on evaluation of IMT-2020 terrestrial radio interfaces |
| February 2020 | [TBD] WP 5D #34 | • Finalize Doc. IMT-2020/ZZZ Evaluation Reports Summary
• Finalize Addendum 5 to Circular Letter IMT‑2020 • Finalize draft new Report M.[IMT.AAS] • Finalize draft new Report ITU-R M.[HAPS-IMT] • Finalize draft new Report ITU-R M.[IMT.1 452-1 492 MHz] • Finalize draft new Report ITU-R M.[IMT.MS/MSS.2GHz] • Further update/Finalize draft new Report/Recommendation ITU-R |
| June 2020 | [TBD] WP 5D #35 | • Finalize draft new Report ITU-R M.[IMT-2020.OUTCOME]
• Finalize Addendum 6 to Circular Letter IMT‑2020 |
| October 2020 | [TBD] WP 5D #36 | • Finalize Addendum 7 to Circular Letter IMT‑2020 (if needed)
• Finalize revision 15 of Recommendation M.1457 |
| November 2020 | Geneva WP 5D #36bis
(3 day meeting) |
• Finalize draft new Recommendation ITU-R M.[IMT‑2020.SPECS]
• Finalize Addendum [7/8] to Circular Letter IMT‑2020 |
Appendix IV: Detailed workplan for the development of a working document towards a preliminary draft new Report ITU-R M.[IMT-2020 BROADBAND REMOTE COVERAGE]:
Source: Document 5D/TEMP/760 (Ericsson)
| Title | “IMT-2020 for remote sparsely populated areas providing high data rate coverage” |
| Identifier | M.[IMT-2020 TERRESTRIAL BROADBAND REMOTE COVERAGE] |
| Document type | Report |
| WP 5D Lead Group | WG Technology Aspects |
| SWG Chair | Marc Grant, AT&T |
| Editor | <TBD> |
| Focus for scope and work | This Report provides details on prospects associated with provisioning of enhanced mobile broadband services to remote sparsely populated and under-served areas proposing enhancements of user equipment as well as for networks in suitable frequency bands:
− for user equipment, possible solutions based on affordable user deployed RF amplifier equipment combined with access to local spectrum could be considered and examined; and − for networks, possible solutions based on high gain massive MIMO antennas could be reviewed. |
| Related documents | Question ITU-R 77-7/5 − “Consideration of the needs of developing countries in the development and implementation of IMT”
Question ITU-R 229-4/5 − “Further development of the terrestrial component of IMT” |
| Milestones | Meeting No. 32 (9-17 July 2019, Búzios, Brazil)
1 Call for contributions in the WP 5D Chairman’s Report. Meeting No. 33 ([10-13 December 2019, Geneva, Switzerland]) 1 [No sessions scheduled]. Meeting No. 34 (19-26 February 2020, <TBD>) 1 Consider received contributions. 2 Draft liaison statements as required. 3 Produce working document. 3 Review and revise the detailed workplan as required. Meeting No. 35 (24 June – 1 July 2020, [China])) 1 Consider the received contributions. 2 Consider any necessary liaison statements. 3 Elevate the working document to a preliminary draft new Report. 4 Review and revise the detailed workplan as required. Meeting No. 36 (7-14 October 2020, [India]) 1 Consider the received contributions. 2 Consider any necessary liaison statements. 3 Elevate the preliminary draft new Report to a draft new Report for submission to Study Group 5. |
…………………………………………………………………………………………………
Update- Addendum 4 to Circular Letter 5/LCCE/59 24 July 2019:
To Administrations of Member States of the ITU, Radiocommunication Sector Members, ITU-R Associates participating in the work of Radiocommunication Study Group 5 and ITU Academia
Subject: Acknowledgement of IMT-2020 proposals, future plans and evaluation report requests
Evaluation Workshop:
WP 5D will hold a Workshop on “IMT-2020 Terrestrial Radio Interfaces Evaluation” from 10 to 11 December, 2019 during its 33rd meeting to provide an interactive discussion among IEGs, proponents and WP 5D delegates.
The workshop will be held at the same venue as the 33rd meeting of WP 5D. The program of the workshop and detailed information about the workshop registration can be found on the “Web page for IMT-2020 submission and evaluation process” (under “Workshop on IMT-2020 Terrestrial Radio Interfaces Evaluation”). Parties interested in the details of the workshop (program, registration deadline, etc.) are kindly requested to check the workshop website periodically before the 33rd WP 5D meeting.
Evaluation Group discussion area:
The Evaluation Group discussion area can be found on “Web page for IMT-2020 submission and evaluation process.”
This discussion area is to exchange views on the characteristics of the proposed radio interface(s) technologies submitted by proponents and to discuss evaluation related issues among IEGs and the proponents.
The discussion area is available on a subscription basis for ITU-R members, designated representatives of the proponents of candidate technology submissions and designated representatives of the IEGs. Focal points of both the proponents and IEGs are requested to provide details of the designated representatives. IEGs and proponents are encouraged to participate in the Evaluation Group discussion area, and share the experiences that might be helpful to progress the evaluation activities.
Request for evaluation reports:
Following the IMT-2020 process on “Submission/Reception of the RIT and SRIT proposals and acknowledgement of receipt” in accordance with Document IMT-2020/2(Rev.2), WP 5D started the evaluation process from its 31st meeting in October 2018, and will last until its 34th meeting in February 2020.
Therefore, WP 5D expects to receive the final evaluation reports from the Independent Evaluation Groups on those IMT-2020 candidate technology RIT(s)/SRIT(s) that have been evaluated by its 34th meeting. While WP 5D kindly requests the independent evaluation groups to provide an interim
evaluation report for its 33rd meeting in December 2019 in which the Workshop on IMT-2020 evaluation will also be held. It is also suggested that the evaluation reports contain information including the use of Report ITU-R M.2412, the considered test environment(s), the evaluated RIT(s)/ SRIT(s), and the evaluation results as requested by the compliance templates, but not limited to those. It is also requested that the interim evaluation report includes as much detail about the evaluation as possible.
Revision to Document IMT-2020/2:
Revision 2 to Document IMT-2020/2 “Submission, evaluation process and consensus building for IMT-2020”, is now available on “IMT-2020 documents”. This revision contains an additional WP 5D meeting planned in November 2020 to complete the Recommendation for detailed specifications of radio interface technologies for the terrestrial components of IMT-2020.
Updates to the ITU-R web page for the IMT-2020 submission and evaluation process and IMT-2020 documents Any future changes to the submission and evaluation process will be announced in Addenda to this
Circular Letter. Other information, such as information on the Workshop on IMT-2020 Terrestrial Radio Interfaces Evaluation, and interim evaluation report(s) will be updated dynamically on the “Web page for IMT-2020 submission and evaluation process” and “IMT-2020 documents.”
Consequently, Members and Sector members interested in the IMT-2020 development process including evaluation activities are kindly requested to periodically check the website.
Mario Maniewicz
Director
AT&T announces cloud partnership with Microsoft 1 day after similar deal with IBM
AT&T has entered into a multi-year, cloud-based collaborative effort with Microsoft the day after announcing an alliance with IBM [1] that also focused on cloud computing. The teleco and media giant will move many of its non-network apps to Microsoft Azure and use the company’s 365 software suite while Microsoft will deploy new AT&T technologies, such as 5G, to build edge computing applications.
Comment: This is yet another proof point that telco cloud computing has been a dismal failure. AT&T and Verizon have both sold off many of their data centers and given up on cloud computing/storage in favor of the much bigger players (e.g. Amazon, Microsoft, Google and IBM in the U.S.). This new agreement appears to be a big win for Microsoft Azure, and probably at the expense of Amazon AWS, Google and IBM cloud rivals.
…………………………………………………………………………………………………………………………………………………………………………………………………….
“AT&T and Microsoft are among the most committed companies to fostering technology that serves people,” said John Donovan, CEO of AT&T Communications in a prepared statement. “By working together on common efforts around 5G, the cloud, and AI, we will accelerate the speed of innovation and impact for our customers and our communities,” he added (John is NEVER at a loss for words!)
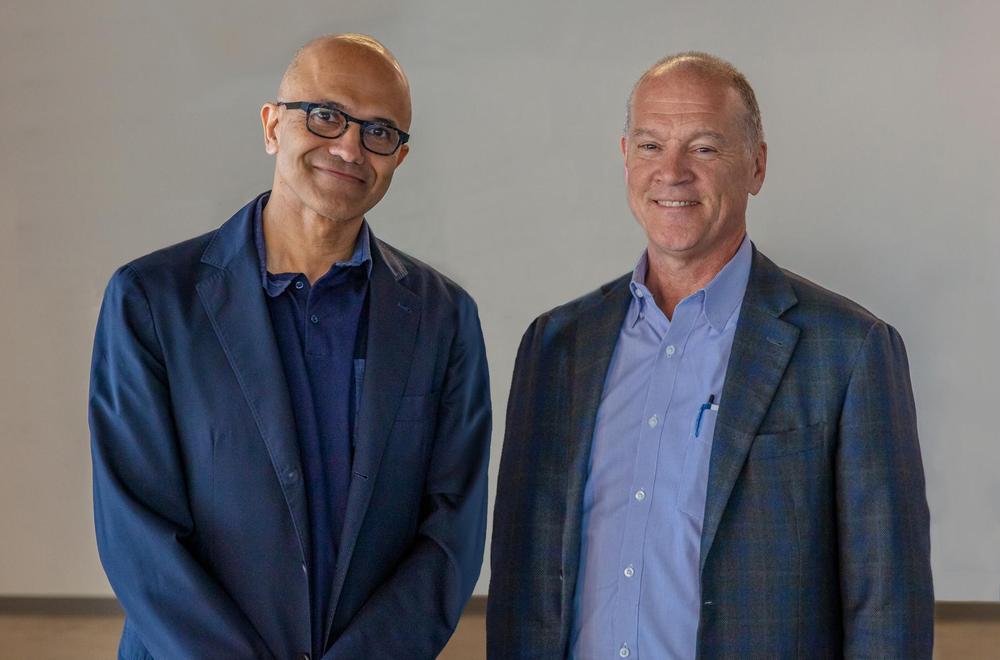
Microsoft CEO Satya Nadella with AT&T Communications CEO John Donovan
…………………………………………………………………………………………………………………………………………………………………………………………………….
Observation:
The AT&T Microsoft partnership appears to be broader than the just announced AT&T IBM deal (see note 1 below). That deal is cloud-focused as well but is limited to the AT&T Business Solutions business unit, helping to better manage internal applications. A key objective of the IBM deal is to provide tools for AT&T Business solutions to better serve enterprise customers.
…………………………………………………………………………………………………………………………………………………………………………………………………….
AT&T partnerships on edge computing:
AT&T and Microsoft had earlier announced a deal on mobile edge computing which we reported here. Earlier this year, AT&T said it will work with Hewlett Packard Enterprise (HPE) to help businesses harness powerful edge capabilities. The two companies have agreed to a go-to-market program to accelerate business adoption of edge connections and edge computing.
…………………………………………………………………………………………………………………………………………………………………………………………….
Note 1. AT&T – IBM Cloud Parthership:
AT&T Communications will work with IBM to modernize AT&T Business Solutions’ internal software applications, enabling migrations to the IBM Cloud. IBM will provide infrastructure to support AT&T Business’s applications. AT&T Business will use the Red Hat open source platform to manage workloads and applications. IBM will be the primary developer and cloud provider for AT&T Business’s operational applications and will help manage the AT&T Communications IT infrastructure, on and off-premises and across different clouds –private and public.
As part of the agreement, AT&T Business will be IBM’s primary provider of software defined networking and will leverage the carrier’s latest technologies including 5G, Edge Compute, and IoT as well as multi-cloud capabilities using Red Hat.

Additionally, the two companies will work together on edge computing platforms, which will help enterprise clients capitalize on the power of 5G network speeds and the internet-connected devices and sensors at the edge of the network.
“In AT&T Business, we’re constantly evolving to better serve business customers around the globe by securely connecting them to the digital capabilities they need,” said Thaddeus Arroyo, CEO of AT&T Business, in a prepared statement. “This includes optimizing our core operations and modernizing our internal business applications to accelerate innovation. Through our collaboration with IBM, we’re adopting open, flexible, cloud technologies, that will ultimately help accelerate our business leadership.”
References:
https://about.att.com/story/2019/microsoft.html
https://www.business.att.com/products/multi-access-edge-computing.html
AT&T owns >630 MHz nationwide of mmWave spectrum + HPE partnership for Edge Networking & Computing
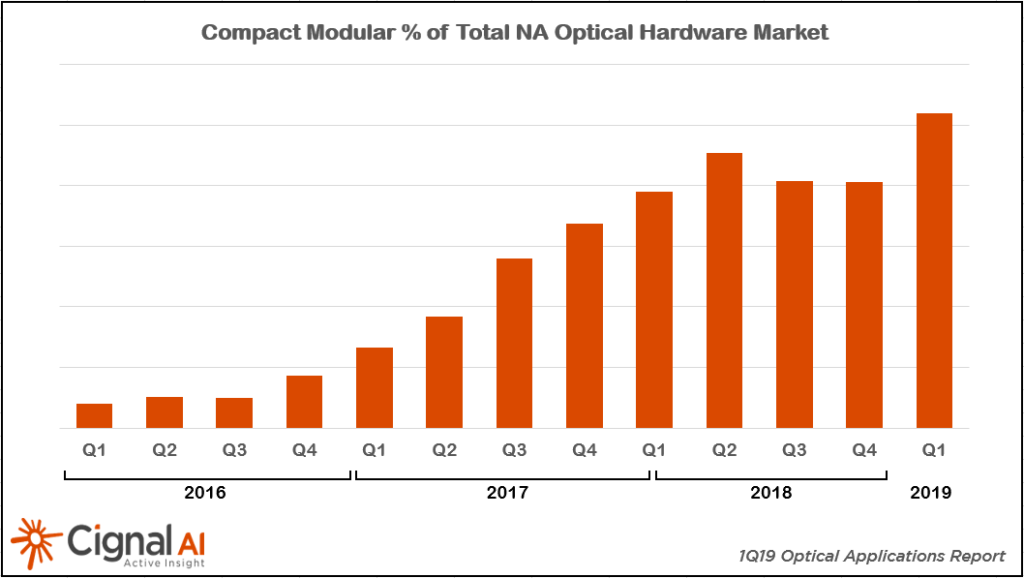
Cignal AI: Modular Optical Sales Expand, Reaching Over $275M
Almost 30% of North American Optical Hardware Shipments Now in Compact Modular Format
by Cignal AI staff
Compact modular optical hardware is being used in more network applications than ever before, driving up sales during the first quarter of 2019 as reported in the latest Optical Applications Report from market research firm Cignal AI.
Compact modular optical systems were first used by cloud operators for data center interconnect applications but have since expanded well beyond into many other operators and applications. Market share leaders include the Ciena Waveserver, Infinera CX and Groove, and Cisco 1000 series.
The report illustrates significant growth throughout most regions as the compact modular customer base expands beyond cloud and webscale operators to include traditional telco customers pursuing network disaggregation. Compact modular hardware sales exceeded $275 million in Q1 and are tracking to exceed $1 billion in revenue this year. Growth was most pronounced in North America this quarter, where it accounted for almost 30% of the entire optical market and is expected to continue advancing through 2023.
“Network applications for the compact modular form factor have expanded well beyond the original data center interconnect deployments,” said Scott Wilkinson, Lead Analyst for Optical Hardware at Cignal AI. “Applications now include traditional telco networks, metro and long haul deployments, and even some early trials for subsea deployment. We expect this spending trend to increase in 2019 as new compact modular products come to market from a variety of vendors.”
Cignal AI’s 1Q19 Optical Applications Report details market share for the first quarter of 2019 and provides forecasts in three key markets: compact modular equipment, advanced packet-OTN switching hardware, and 100Gbps+ coherent WDM port shipments across multiple speeds. Hardware and coherent port shipments are forecasted through 2023. The Applications Report is issued quarterly.
Additional 1Q19 Applications Report Key Findings:
Ciena expanded its dominance in compact modular with over 50% market share in Q1. The combined Infinera/Coriant held on to second place despite declining sales.
Acacia [1] AC1200-based platforms are expected to have an impact starting next quarter. Cisco (which is acquiring Acacia) compact modular sales paused in Q1 in anticipation of the NCS1004 platform.
Note 1. Cisco and Acacia Communications entered into a definitive agreement under which Cisco has agreed to acquire Acacia for a consideration of US$2.6 billion.
……………………………………………………………………………………………..
Almost 500k physical coherent ports have shipped in the last 12 months. Currently, over 70% of coherent ports are shipped by the top five vendors in the market.
After a 2018 recovery year, long haul port shipments are starting to pick up. Metro growth is advancing at a similar pace, as next-generation coherent enables an upgrade from 100Gbps.
Packet OTN growth is slowing. New deployments are limited to China and parts of APAC as networks in other regions evolve away from the packet OTN architecture.
About the Optical Applications Report:
The Cignal AI Optical Applications Report includes market share and forecasts for revenue and port shipments for optical equipment designed to meet the needs of specific applications: 100G+ coherent, and compact modular and advanced packet-OTN switching hardware.
Vendors examined include Acacia, Adtran, ADVA, Ciena, Cisco, ECI, Ekinops, Fiberhome, Fujitsu, Huawei, Infinera, Inphi, NEC, Nokia, NTT Electronics (NEL), Padtec, Tejas, Xtera and ZTE.
Deliverables include Excel files with complete data sets, PowerPoint summaries and Cignal AI’s Active Insight news reporting. Cignal AI clients with Applications report subscriptions may access this material on the Cignal AI website.
About Cignal AI:
Cignal AI provides active and insightful market research for the networking component and equipment market and the market’s end customers. Our work blends expertise from a variety of disciplines to create a uniquely informed perspective on the evolution of networking communications.
Contact Us/Purchase Report:
| Sales: [email protected] Web: Contact us |
SK Telecom with Swisscom: World’s First “5G” Roaming Service
SK Telecom announced today that it will begin the world’s first 5G roaming service [1] from midnight KST on July 16 through a strategic partnership with Swisscom, the largest telecommunications provider in Switzerland.
Note 1. Not only is there no standard for “5G’ roaming (or even signaling.control plane), but there are no standards for anything related to 5G radio and non radio aspects. Hence, this “5G’ roaming agreement is specific to these two carriers. They have obviously agreed on a roaming/handoff spec for 5G NR (3GPP Rel 15) in the data plane and LTE signaling in the control plane.
………………………………………………………………………………….
Swisscom, which boasts over 6 million mobile subscriptions, started to roll out its 5G network on April 17th. The company currently provides 5G service in 110 cities and villages including Zurich, Geneva and Bern as well as rural and touristic areas.
SK Telecom’s customers using Samsung Galaxy S10 5G smartphone will be able to use 5G roaming service through Swisscom when visiting Switzerland after upgrading their devices with the latest software update. In the future, SK Telecom plans to provide software upgrades to LG V50 users and further expand 5G roaming service to other countries around the globe.
“SK Telecom once again proved its leadership in advanced roaming technology with the launch of world’s first 5G roaming service” said Han Myung-jin, Vice President and Head of MNO Business Supporting Group of SK Telecom. “We will continuously expand our 5G roaming service to enhance customer experience and benefits.”
Meanwhile, with the aim to enable its customers to make and receive high-quality, free-of-charge international roaming voice calls while travelling to 171 countries across the world, SK Telecom launched ‘baro’ on December 17, 2018. As of June 2019, ‘baro’ has attracted 2.2 million users and 38 million cumulative calls (total of 800,000 hours of voice calls). Moreover, ‘baro’ won the ‘Best Mobile Technology Breakthrough in Asia’ award at the 2019 Asia Mobile Awards held as part of MWC19 Shanghai.
…………………………………………………………………………………………………..
About SK Telecom:
SK Telecom is the largest mobile operator in Korea with nearly 50 percent of the market share. As the pioneer of all generations of mobile networks, the company has commercialized the fifth generation (5G) network on December 1, 2018 and announced the first 5G smartphone subscribers on April 3, 2019. With its world’s best 5G, SK Telecom is set to realize the Age of Hyper-Innovation by transforming the way customers work, live and play.
Building on its strength in mobile services, the company is also creating unprecedented value in diverse ICT-related markets including media, security and commerce.
……………………………………………………………………………………………………….
For more information, please contact:
[email protected] or [email protected].
About Swisscom:
Swisscom, Switzerland’s leading telecoms company and one of its leading IT companies, is headquartered in Ittigen, close to the capital city Berne. Outside Switzerland, Swisscom has a presence on the Italian market in the guise of Fastweb. About 20,000 employees generated sales of CHF 2’860 million to the end of the 1st Quarter 2019. It is 51% Confederation-owned and is one of Switzerland’s most sustainable and innovative companies.
…………………………………………………………………………………………..
Media Contacts:
Yong-jae Lee
SK Telecom Co. Ltd.
(822) 6100 3838
(8210) 3129 6880
Irene Kim
SK Telecom Co. Ltd.
(822) 6100 3867
(8210) 8936 0062
Ha-young Lee
BCW Korea
(822) 3782 6421
Israel Ministry of Communications publishes 5G frequencies auction
Israel’s Ministry of Communications is publishing the auction for 5G frequencies today. The tender winners will be announced in the fourth quarter of the year, after which the frequencies will be allocated to the companies.
The auction utilizes the Vickrey method – a public auction in sealed envelopes. The party making the highest bid wins the auction, but will pay the second highest price. The state is using this method in order to get the maximum value, while at the same time avoiding inflated prices.
As first reported by “Globes,” the Ministry of Communications will try to allocate the most desirable frequencies, 700 MHz, to all of the cellular companies. These frequencies are the best and most effective of all the 5G frequencies. Two other frequencies are being offered in addition to 700 MHz.
In order to support the venture, the state will provide substantial incentives to operators in the form of a NIS 500 million refund to encourage the operators to act quickly. The current government cannot make the decision, because it is a transition government, but the Ministry of Communications has agreed in principle not to increase the yearly fees paid by the cellular companies.
All of the cellular operators currently pay NIS 300 million annually, and this figure is not expected to change in the next four years. The cellular operators will pay a one-time amount in the tender framework, but part of it will be refunded to them on the basis of meeting targets.
The participants in the tender will pay the license fee only in January 2022. This postponement will enable them to allocate the money in the first two years to investments in technology. The Israel government will later allow the operators to bid in another tender in which they will provide wireless Internet for homes.
The auction will be managed using a method called combinatorial clock auctions. This method enables bidders to compete simultaneously in all of the frequency areas. The frequencies in the auction will be offered only to companies agreeing to found a shared network. The aim is to avoid an inefficient allocation of frequencies.
The systems of incentives for deployment is composed of two tracks: reducing the fees for the frequencies – a annual reduction of 28% of all the frequency fees for four years. The operators will be required to meet engineering targets each year. The benefit will be provided at the beginning of each year, assuming that the operator meets the targets.
In the second track, the state will provide an incentive of up to NIS 200 million. The cellular companies will have to establish 250 5G broadcasting centers. The operator that builds the most sites will receive up to NIS 82 million – 41% of the total incentive. The builder of the second most sites will get NIS 66 million, and the operator in third place will receive NIS 52 million.

The Ministry of Communications believes that the public will begin benefiting from the new technology in 2020. Minister of Communications David Amsalem said today, “This technological measure will leave its mark for decades from now. With the introduction of the new 5G technology, the smart digital revolution will get underway and affect all spheres of life: smart homes, smart cities, smart medicine, making the outlying areas closer to the central area, education. autonomous vehicles, advanced industry, etc.
“The financial state of the companies at this time has not escaped us, and the tender also takes this situation into account. I congratulate my friends and participants in the tenders committee for their professional work. The dedication and responsibility exercised is what made it possible to lay the cornerstone today for the next era of technology.”
Amsalem added, “All of our lives are going to change as a result of 5G. Human life is going to develop concurrently with the industrial revolution, and the technology is therefore of critical importance. There is of course an amazing team here that has been working on this for over 18 months. It is a difficult, complicated matter, as are the tenders. There is something extremely sophisticated here. I want to take this opportunity to thank the ministry’s employees for what they have done up until now, and it has to be pushed forward as much as possible. The revolution has two arteries: the frequencies tender and the other story that completes it, which is fiber-optics. Both of them together will enable us to make progress, so that Israel adapts itself to global technology. Today, if you lag behind in some aspect, you become an underdevelopment country.”
………………………………………………………………………………………………..
Published by Globes, Israel business news – en.globes.co.il July 14, 2019
https://en.globes.co.il/en/article-israeli-govt-publishes-5g-frequency-auction-1001293454
………………………………………………………………………………………….
Also see these previous Globes articles:
Timelines for IMT 2020 (subject to change) and 3GPP Release 16


15 July 2019 Update & Clarification:
For the completion of Step 8 (see revised description below) and the finalization of the draft new Recommendation ITU-R M.[IMT‑2020.SPECS] in Working Party 5D, a completion date of the WP 5D meeting No. 36, currently planned for 7-14 October 2020 had previously been chosen.
However, this completion date has been shifted to a new WP 5D Meeting #36bis planned for 17-19 November 2020 (shown in above table). The focus of this ‘bis’ meeting is specifically the technology aspects and associated matters necessary to finalize the draft new Recommendation ITU-R M.[IMT-2020.SPECS].
This shift was done to assist the Transposing Organizations by providing them additional time to prepare their transposed standards aligned with the Global Core Specification that would be provided to WP 5D meeting #35 (24 June – 1 July 2020).
The additional time afforded by scheduling a new WP 5D Meeting #36bis as the new completion meeting of the draft new Recommendation ITU-R M.[IMT-2020.SPECS] affords the Transposing Organizations at least 13 weeks of time after WP 5D Meeting #35 to provide the Radiocommunication Bureau by the indicated due date (8 October 2020) with the relevant technical material (e.g., the URL hyperlinks) and other related administrative matters to ITU-R after the Meeting #35, in proper alignment with the GCS.
The ITU-R Secretariat, upon receipt of this material from the Transposing Organizations will administratively prepare (i.e., compile, edit, format, etc.) the final draft of the Recommendation incorporating all the technologies (RITs and SRITs) agreed by ITU-R for inclusion in Step 8 and make it available to WP 5D Meeting #36bis.
Step 8 – Development of radio interface Recommendation(s):
In this step a (set of) IMT-2020 terrestrial component radio interface Recommendation(s) is developed within the ITU-R on the basis of the results of Step 7, sufficiently detailed to enable worldwide compatibility of operation and equipment, including roaming.
This work may proceed in cooperation with relevant organizations external to ITU in order to complement the work within ITU‑R, using the principles set out in Resolution ITU-R 9-5.
Step 9 – Implementation of Recommendation(s):
In this step, activities external to ITU-R include the development of supplementary standards (if appropriate), equipment design and development, testing, field trials, type approval (if appropriate), development of relevant commercial aspects such as roaming agreements, manufacture and deployment of IMT-2020 infrastructure leading to commercial service.
……………………………………………………………………………………………………………………………………………………………………………………………………………
3GPP input to IMT 2020 RIT/SRIT and Release 16 Schedule:
3GPP notes that with the complexities of 5G as a new generation of technology and the importance of the new Recommendation ITU-R M.[IMT-2020.SPECS] globally for all stakeholders (including support for the results of WRC-19), any additional time afforded to the External Organizations in Step 8 for provision of the URL references would be of great benefit to all the radio interface technology proponents, not just 3GPP.
3GPP welcomes any accommodation WP 5D might make concerning the scheduling of the work to conclude the first release of Recommendation ITU-R M.[IMT-2020.SPECS] and kindly asks for feedback to 3GPP from that discussion.
……………………………………………………………………………………………………………………
From 3GPP Webinar – 3 July 2019:
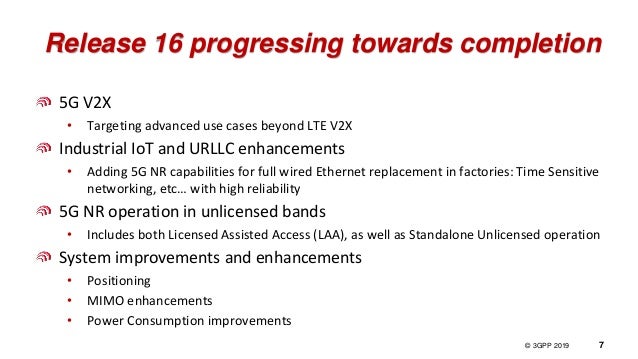
“For the (industry) verticals, there are three distinct pillars that we are focused on: Automotive, Industrial IoT and Operation in unlicensed frequency bands.
For 5G based V2X, which builds on the two iterations of the LTE-V2X, we are now adding advanced features – primarily in the area of low latency use cases.
The second focus is industrial IoT and URLLC enhancements. Factory automation, in particular, is a strong pillar for 5G going forward. We are trying to ensure that the radio side covers all of the functions that all the verticals need for factory automation. What this means in practice is that we are trying to make sure 5G NR can fully replace a wired Ethernet – currently used – by adding time sensitive networking and high reliability capabilities.
The third pillar is operation in unlicensed bands. We have seen different schemes for generic 5G licensing strategies in Europe and in other parts of the World. We have seen in some countries that certain licensed bands have been allocated for vertical use cases, though that is not the case for a majority of countries. The use of unlicensed bands provides a great opportunity – where licensed spectrum is not an option. We are now focused on not only what we have with LTE, which is the licensed assisted access scheme, but also on standalone unlicensed operation – to be completed in Release 16.
Release 16 also delivers generic system improvements & enhancements, which target Mobile Broadband, but can also be used in vertical deployments –> Particularly: positioning, MIMO enhancements and Power consumption improvements.”
See and listen to this 3GPP Webinar at: https://vimeo.com/346171906
………………………………………………………………………………………………………………………………………………….
Annex 1. From ATIS contribution to ITU-R WP5D July 2019 meeting in Brazil:
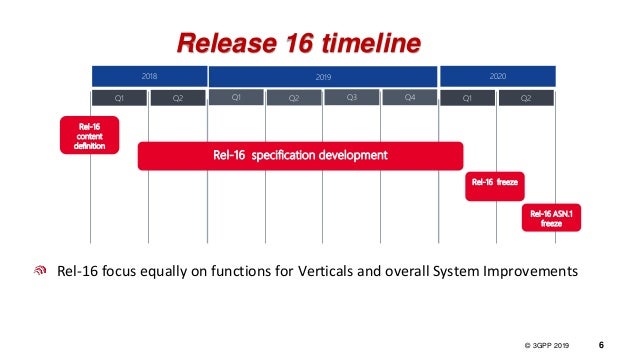
3GPP has agreed revised completion dates for Release 16 – schedule shifted out by 3 months:
Release 16 RAN-1 Freeze RAN # 86 December 2019
Release 16 RAN Stage 3 Freeze RAN # 87 March 2020
Release 16 ASN.1 Freeze RAN # 88 June 2020
Release 16 RAN-4 Freeze RAN # 89 September 2020
……………………………………………………………………………………………………………………
Submitted on behalf of the 3GPP Proponent of the 3GPP submission, which is collectively the 3GPP Organizational Partners (OPs). The 3GPP OPs are ARIB, ATIS, CCSA, ETSI, TSDSI, TTA and TTC (http://www.3gpp.org/partners)
IMT 2020: Concept of Global Core Specification (GCS) and Transposing Organization(s)
Introduction:
When completed, Recommendation ITU-R M.[IMT-2020.SPECS] will contain the detailed specifications of the radio interfaces of IMT-2020. The structure and philosophy adopted for M.[IMT-2020.SPECS] for IMT2020 is based on those used in Recommendations ITU-R M.1457 for IMT-2000 and ITU-R M.2012 for IMT-Advanced, which have been successfully utilized for two decades through numerous revisions of Recommendations ITU-R M.1457 and ITU-R M.2012.
A key concept is the continued use of the Global Core Specification (GCS) provided by the GCS Proponent and references to standards of Transposing Organization(s) [1.] authorized by the GCS Proponent whereby the detailed standardization is undertaken within the Transposing Organization that operates in concert with the RIT/SRIT Proponent and/or GCS Proponent entities.
The relationship between the GCSs for IMT-2020 radio interface technologies and the corresponding transposed standards is such that the GCSs are the framework for their corresponding detailed transposed specifications. Recommendation ITU-R M.[IMT-2020.SPECS] may also include references to specific related standards of the Transposing Organizations. There may be one or more entities that exist within a GCS Proponent for a given GCS.
It is also permissible to not have a separate GCS for a particular radio interface technology, in which case all the detailed specifications of that particular radio interface technology (the Directly Incorporated Specification1) would be fully contained directly within the Recommendation ITU-R M.[IMT-2020.SPECS].
This understanding of whether a GCS would or would not be utilized in the context of a particular radio interface technology within Recommendation ITU-R M.[IMT-2020.SPECS] is necessary so that the proper structure and content of the Recommendation is chosen to properly reflect the technology specifications.
Consequently, the RIT/SRIT Proponent is requested to indicate at an early stage to the ITU-R its preliminary intention to submit a Global Core Specification, in advance of the required formal certifications, which will be used to form the basis of information in the Recommendation ITU‑R M.[IMT-2020.SPECS].
The ITU-R (Working Party 5D) will review any GCS or DIS submission(s) and agree/approve or suggest changes in conjunction with the development and the ultimate approval by ITU-R of the final published version of Recommendation ITU-R M.[IMT-2020.SPECS] and the established schedules.
ITU-R (WP 5D and/or the Radiocommunication Bureau) will maintain liaison with the relevant External Organizations (RIT/SRIT Proponents, GCS Proponents, and Transposing Organizations) on the required deliverables and also the relevant schedules and administrative matters associated with the various stages of the development of the Recommendation ITU‑R M.[IMT-2020.SPECS] and its revisions over time.
………………………………………………………………………………………………………………………………………..
ITU-R WP 5D will review any GCS or DIS submission(s) and agree/approve or suggest changes in conjunction with the development and the ultimate approval by ITU-R of the final published version of Recommendation ITU-R M.[IMT-2020.SPECS] and the established schedules.
ITU-R (WP 5D and/or the Radiocommunication Bureau) will maintain liaison with the relevant External Organizations (RIT/SRIT Proponents, GCS Proponents, and Transposing Organizations) on the required deliverables and also the relevant schedules and administrative matters associated with the various stages of the development of the Recommendation ITUR M.[IMT-2020.SPECS] and its revisions over time.
Respecting the integrity of the GCSs and ensuring that the transposed standards are consistent with the GCS:
To assure users of Recommendation ITU-R M.[IMT-2020.SPECS] of the integrity of the GCS for a particular technology, and to ensure that the transposed standards are consistent with the common globally agreed vision of IMT-2020, completeness and traceability of the GCS and the transposed standards is a foremost obligation of the ITU-R.
As noted above, the IMT-2020 specifications could be developed around a “Global Core Specification” (GCS), which is related to externally developed materials incorporated by specific references for a specific technology. The submitted GCSs as accepted by WP 5D for inclusion in Recommendation ITU-R M.[IMT-2020.SPECS] will be placed on the relevant ITU website and indicated by hyperlinks in each relevant technology Section of Recommendation ITU-R M.[IMT2020.SPECS].
The GCS provided by the GCS Proponent would form the nucleus of Recommendation ITUR M.[IMT-2020.SPECS]. For each radio interface technology in Recommendation ITU-R M.[IMT2020.SPECS] (whether presented as a single RIT or as one of the component RITs within an SRIT) there will be only one corresponding GCS. A GCS will have one or more GCS Proponents. Each component RIT within a SRIT may be separately addressed with regard to its GCS and the associated GCS Proponents.
Each GCS would correspond to separate sets of transposed standards/specifications from one or more individual standards development organizations or equivalent entities. For each separate set of transposed standards/specifications, there will be only one Transposing Organization.
The referenced standards of the authorized Transposing Organizations [1.] must be technically consistent with the corresponding GCS while allowing a limited amount of flexibility to accommodate, e.g. minimal regional differences. An example of a regional difference would be a regional adjustment for differing frequency bands. Adherence to this format and principle assures a common global standard for IMT-2020 as codified in Recommendation ITU-R M.[IMT2020.SPECS] including the external materials incorporated by reference.
The receipt of information with regard to Recommendation ITUR M.[IMT-2020.SPECS] that is related to a business relationship of the ITU and the relevant external organizations complements and support activities such as the technical work under the purview of the relevant Study Group within the ITU. It must be noted that where this document addresses administrative matters it does not intend to usurp the Study Group or Working Party authority but merely seeks to provide additional critical information to the deliberations on Recommendation ITU-R M.[IMT-2020.SPECS] as to the individual or collective intent and/or actions of the RIT/SRIT Proponents, GCS Proponents, and/or Transposing Organizations that support a particular technology, a corresponding GCS, and the related transposed standards.
NOTE 1. A Transposing Organization is an individual entity authorized by a GCS Proponent to transpose the relevant GCS into specific standards and to provide specific references and hyperlinks (Transposition References) for the purposes of Recommendation ITU-R M.[IMT-2020.SPECS]. A Transposing Organization:
1) must have been authorized by the relevant GCS Proponent to produce transposed standards for a particular technology, and
2) must have the relevant legal usage rights.
………………………………………………………………………………………………………………………………………………………………………….
It is noted that the entity or entities that make up a GCS Proponent may also be a Transposing Organization. It should also be noted that the term Transposing Organization is always indicated to be a single entity. It is also noted that, for the purposes of Recommendation ITU-R M.[IMT-2020.SPECS], the ITUR will only recognize as valid those Transposing Organizations that have been identified to the ITU-R by the GCS Proponent as authorized to transpose the GCS Proponent’s GCS.
Neither a GCS Proponent nor a Transposing Organization need to be a formal “Standards Development Organization” or “SDO.” For example, “SDO” here could represent an industry entity, organization, individual company, etc. that, if applicable, also qualifies appropriately under the auspices of Resolution ITU-R 9.
…………………………………………………………………………………………….
References:
https://www.itu.int/md/R15-IMT.2020-C-0020/en
https://www.itu.int/pub/R-RES-R.9
