

Point Topic
Point Topic: Global Broadband Subscribers in Q2 2025: 5G FWA, DSL, satellite and FTTP
Overview:
Global broadband subscribers surpassed 1.53 billion in Q2 2025, marking a 1.1% growth. Broadband subscriptions[1] declined in 24 countries[2], compared to 22 in Q1 2025. In some of these markets consumers are migrating to mobile broadband, others are experiencing economic headwinds or are already highly saturated. Some are still in the midst of conflict. Globally, the growth in Q2 2025 has increased slightly, compared to the same quarter of 2024.
Notes:
[1] Whenever Point Topic refers to ‘broadband’ in this report, they mean fixed broadband. Also, ‘subscriptions’ and ‘connections’ are used interchangeably.
[2] It is possible there will be restatements in the coming quarter/s and single period data should be viewed in that light. Decline in some markets can be due to changes in methodology used by national regulatory authorities.
Key Points:
-
In terms of growth, India remained at the top of the largest 20 fixed broadband markets with a 6.7% quarterly growth rate.
-
The share of FTTH/B in the total fixed broadband subscriptions increased further and stood at 72.68%. Broadband connections based on other technologies saw their market shares shrink again, with an exception of satellite and fixed wireless access (FWA).
-
Year-on-year, FTTH/B connections grew by 7.2%. Satellite and FWA saw an even higher annual growth (41.6% and 31% respectively).
-
Legacy copper subscriptions declined by 12.1% y-o-y, while FTTx lines (mainly VDSL) went down by 6%, with Spain becoming one of the first countries in the world and the first major European economy to shut down its copper network completely.
-
5G FWA take-up accelerated, especially in India and the US, as a result of aggressive investments by Reliance, Bharti Airtel, T-Mobile, Verizon and AT&T.

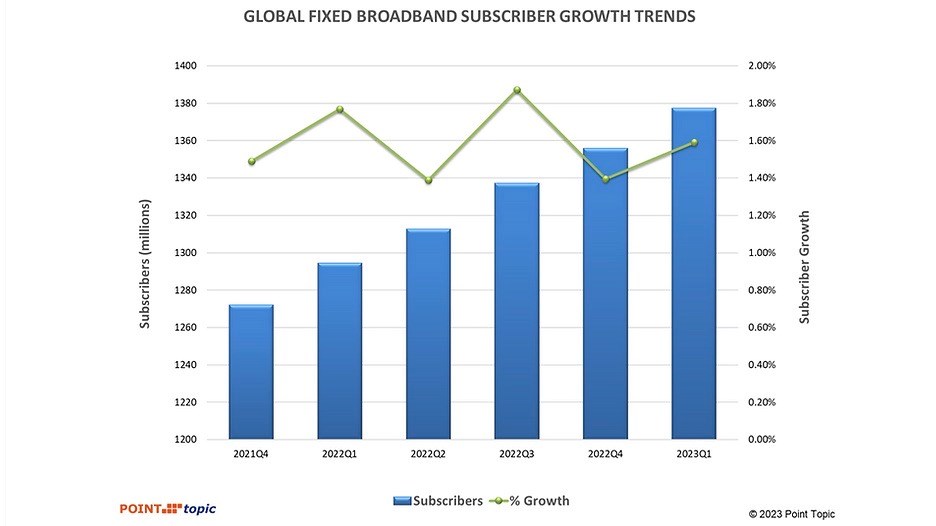
In Q2 2025, the global fixed broadband subscriber figure grew by 1.1%, exceeding 1.53 billion. In line with seasonal trends, the growth rate was slower than in the previous quarter but it was slightly higher than in the respective quarter of 2024 (Figure 1. above and Table 1. below).
Table 1. Global broadband subscribers and quarterly growth rates. Source – Point Topic

South and East Asia continues to claim the largest share of net adds in global fixed broadband subscribers, though it dropped slightly quarter-on-quarter from 63.5% to 62.3%. This was largely due to the slower quarterly growth in China, the largest broadband market of the region[3], which is inevitable due to the increasing market saturation (Table 2. below).
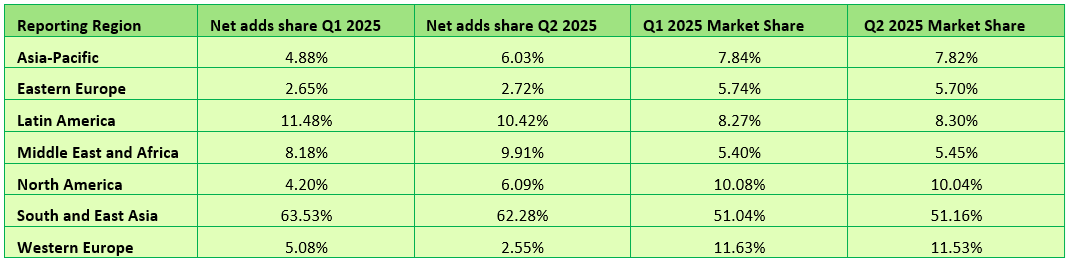
Other regions saw their net adds shares expand, with an exception of Latin America and Western Europe. In Western Europe, whose net adds share halved, most of the Scandinavian countries, the UK and some others saw a decline in fixed broadband subscribers, as the extent of migration to gigabit capable technologies was not sufficient to offset the decline in copper based subscriptions.
For the largest twenty broadband markets, once again all except the UK saw fixed broadband subscriber growth in Q2 2025 (Figure 5). The UK saw a -0.05% decline (compared to -0.3% in the previous quarter), as the FTTP growth was not sufficient to offset the decline in DSL, FTTx and cable broadband connections. For several quarters now India is at the top of this cohort, with a 6.7% growth, continuing to show huge growth potential due to the low fixed broadband penetration (16% of households) and the fast growing economy. Along with Canada, India also saw the largest increase in quarterly growth, compared to Q1 2025.

Globally, healthy quarterly FTTH/B growth rates were spread around the world, with the less advanced economies and more youthful fibre markets generally exhibiting higher growth. In the last 12 months to the end of Q2 2025, the number of DSL lines saw another decline (-12.1%), while FTTH/B connections grew by 7.2%. The decline in FTTx was -6%, while cable (HFC) broadband subscribers dropped by -0.9%.
The decline in copper and FTTx (mainly VDSL) is not surprising. When it comes to cable/HFC, it is not immune to competition from other technologies either. The US is a good example, being the largest cable market globally. There the decline has continued as major players such as Comcast, Charter, Cox, Altice and others are losing customers. Competition from telcos who are rapidly expanding their fibre footprints (AT&T, Verizon, Frontier, Lumen, Consolidated Communications) and offering symmetric bandwidth, superior upload speeds and lower latency is partly to blame. At the same time, cable broadband prices have risen steadily due to promotional offer expirations, ‘network fees’, and equipment costs. Finally, 5G FWA home broadband from T-Mobile, Verizon and AT&T has exploded, with their customer numbers jumping year-on-year by 31%, 34% and 194% respectively.
Globally, wireless broadband (FWA, 5G FWA and LTE fixed) connections also continued to grow – they went up by 31% year-on-year, largely impacted by an explosive growth of 5G FWA in India (332% year-on-year) as well as the US (39%). In India, Reliance and Bharti Airtel are marching ahead with 5G FWA rollouts, capitalising on the huge potential of the enormous broadband hungry market.
Point Topic expects this trend to continue due to the fact that FWA networks are easier to scale after the initial investment, FWA broadband services being generally cheaper for consumers than the alternatives, easy to self-install, and being ‘good enough’ for streaming, remote work, and average household use, as well as the demand for connectivity in remote and underserved areas. Having said that, this applies primarily to the more advanced FWA, especially 5G based. They are also seeing a decline in subscriptions based on older FWA variants in some markets.
Point Topic: FTTP broadband subs to reach 1.12bn by 2030 in 29 largest markets
U.S. broadband subscriber growth slowed in 1Q-2024 after net adds in 2023
Point Topic Comprehensive Report: Global Fixed Broadband Connections at 1.377B as of Q1-2023
Point Topic: Global Broadband Tariff Benchmark Report- 2Q-2022
Point Topic: Global fixed broadband connections up 1.7% in 1Q-2022, FTTH at 58% market share
Cable broadband subscriber growth slows while FTTx and FWA gain ground
Point Topic: FTTP broadband subs to reach 1.12bn by 2030 in 29 largest markets
Point Topic forecasts 1.39 billion fixed broadband connections by the end of the decade in the 29 largest broadband markets in the world. Fiber to the Premises (FTTP) is already dominating most of the markets and it will be the preferred option for most consumers, where it is available.
Between 2023 and 2030 Point Topic projects a 15% growth in total fixed broadband subscribers in the top 29 markets. The growth will come mainly from FTTP – although the increase in the total fiber lines will be lower than that in Fixed Wireless Access lines – 25% and 61% respectively, the sheer number of already existing and new FTTP connections will drive the total growth.

Figure 1. Fixed broadband lines by technology (Top 29 markets)
………………………………………………………………………………………………………..
Split by technology we estimate that by 2030 there will be 1.12 billion FTTP, 149 million cable, 79 million FTTX, 16 million FWA[1] and only 28 million DSL lines in these markets.
 Figure 2. Change in fixed broadband lines, 2023-2030 (Top 29 markets)
Cable is a term used as a proxy for those legacy MSOs/cablecos (e.g. Charter, VMO2, Comcast, etc.) that still have significant networks based on coaxial cable, mainly DOCSIS 3.0 and 3.1. We forecast some decline (-6%) in cable broadband lines by the end of the decade as these networks are being replaced with full fibre. The new generation DOCSIS4, which is in development, will match the capabilities of FTTH with XGPON, so markets with established cable networks will see a slight growth or stable take-up figures for ‘cable’ broadband lines.
FTTX (where fibre is present in the local loop with copper, mainly fiber to the cabinet) will decline over the next seven years (-19%). Some modest growth from new subscribers will remain in a few markets where legacy infrastructure is still widespread. Also, it will remain a cheaper option even where other technologies are available as it still offers enough bandwidth for some users.
DSL will see the largest decline at -44%. However, while being a slower and less reliable solution, it can provide enough bandwidth at a low price to some single or older households that are reluctant to upgrade. Besides, some of them will not have a choice of other technologies, especially in certain regions and markets.
………………………………………………………………………………………………………………

Figure 3. Fixed broadband penetration, 2023 and 2030 (top 29 markets)
…………………………………………………………………………………………………………………………
Point Topic only included FWA in its data in significant markets and where it was able to source reliable figures, such at the U.S., Canada, and Italy. Therefore, the total number of FWA subscribers could end up higher if FWA takes off in other markets.
In the U.S., T-Mobile US and Verizon are the FWA leaders with 8.6 million connections between them as of March 2024. T-Mobile recently added a new FWA service offer to its portfolio aimed at customers who might need a back-up for unreliable fiber or cable connections.
……………………………………………………………………………………………………………………..
China will be among the 16 markets with 90%-plus broadband penetration in seven years time. The potential for signing up new customers in those markets will shrink, leaving broadband providers with the task of converting existing customers to higher bandwidths and more advanced technologies for growth.
At the other end of the scale, there is still lots of room for broadband growth. India will have the lowest percentage of premises with a fixed broadband connection by 2030 at 33%, up from just 11% last year.
“There is significant growth to come in the ‘youthful’ markets with low fixed broadband penetration, with plenty of consumers in India, Indonesia and other fast-growing economies hungry for the advantages offered by fixed broadband and full fibre in particular,” Point Topic said.
……………………………………………………………………………………………………………………..
References:
https://www.point-topic.com/post/fttp-broadband-subscriber-forecasts-q4-2023
https://www.telecoms.com/fibre/fibre-to-drive-15-broadband-growth-by-2030
U.S. broadband subscriber growth slowed in 1Q-2024 after net adds in 2023
Dell’Oro: Broadband access equipment sales to increase in 2025 led by XGS-PON deployments
Altice USA transition to fiber access; MoffettNathanson analysis of low population growth on cablecos broadband growth
Point Topic Comprehensive Report: Global Fixed Broadband Connections at 1.377B as of Q1-2023
Global fixed broadband connections reached 1.377 billion as of Q1-2023, up by 83 million from a year earlier and reflecting an annual growth rate of 1.59%, according to Point Topic.
There was a decline in fixed broadband subscriptions in 18 countries[1] which mainly include emerging markets, as well as some saturated markets such as Singapore. However, while there were fluctuations in growth rates across regions and markets, the overall trend indicates a steady expansion of global broadband connectivity.
Highlights:
-
Among global regions, Africa, East Asia and America Other saw the fastest growth in broadband connections (2.9%, 2.2% and 1.8%), not least due to healthy increases in broadband subscribers in the vast markets of Egypt, Brazil and China.
-
The share of FTTH/B in the total fixed broadband subscriptions continued to increase and stood at 66.7%. Broadband connections based on other technologies saw their market shares shrink further, with an exception of satellite and wireless (mainly FWA).
-
VDSL subscriber numbers grew in ten countries, while they dropped in at least 22 markets as consumers migrated to FTTH/B.
-
The highest FTTH/B broadband subscriber growth rates in Q1 2023 were in Algeria, Peru and UK.
At 21.6 million, the quarterly net adds were close to the figure we recorded a year ago, though the growth rate (1.59%) was slower, compared to 1.77% in Q1 2022, with global inflation and economic instability having an impact.

East Asia continued to dominate in Q1 2023, maintaining its position as the largest market with a 49.6% share of global fixed broadband subscribers. This substantial market share is primarily driven by China with its vast population.
In Q1 2023, broadband subscriber base grew faster in China, Hong Kong and Korea, compared to Q4 2022. As a result, the region’s net adds share globally went up from 63.2% to 68.8%. Asia Other accounted for 10.8% of the global broadband market, similarly to the previous quarter, though the region’s net adds share went down from 12.8% to 9.4%.

Europe’s market shares remained rather consistent, though Eastern Europe saw their net adds share decline from 3.4% to 0.5%, as a result of slower growth in almost all markets and the decline in broadband subscribers in Russia having an especially significant impact due to its market size.
Similarly, Americas maintained relatively stable market shares of 10.3% and 8.1% respectively, while America – Other’s net adds share increased from 7.8% to 9%, driven by higher growth in such sizeable markets as Brazil, Mexico, Colombia and Chile, to name a few.

Next Point Topic looks at fixed broadband penetration among population, comparing it to growth rates across the regions.
Africa and Asia Other continue to have relatively low fixed broadband penetration rates among their populations. In Q1 2023, this metric in Africa stood at 4.6%, while Asia Other reached 5.6%. These figures indicate the potential for future expansion in these regions. Not surprisingly, Africa also recorded the highest quarterly growth rate of 2.9%.
The markets of East Asia and America Other followed closely with growth rates of 2.2% and 1.8% respectively, despite East Asia already having the highest population penetration at 41.9%. This reflects a widespread adoption of fixed broadband services in East Asia, while America Other showcases steady growth in a region with significant potential, where broadband penetration is among the lowest, at 17.2%.
Eastern Europe displayed a modest growth rate of 0.2% with a population penetration of 24.8%. Some markets in this region still have a lot of headspace when it comes to broadband adoption but the growth was sluggish, likely due to economic pressures. Other European regions showed a slightly higher growth rate, with Europe Other at 0.5%, coupled with the second highest population penetration of 39.4%. These figures indicate a mature market with limited growth opportunities.

Among the largest twenty broadband markets all but one saw fixed broadband subscribers grow in Q1 2023, although in ten of them the growth was slower than in the Q4 2022. There was a slight drop in broadband subscribers in Russia which is under international sanctions.

The less saturated broadband markets of India, Egypt, Brazil and Mexico recorded the highest quarterly growth rates in Q1 2023, all higher than 2%. China recorded an above 2% growth as well. At the other end of the spectrum, the mature markets of Germany, France, Japan, UK, and Italy saw modest growth rates at below 0.5%. At the same time, Italy was among the countries that saw one of the largest improvements in growth rates, from -0.44% in Q4 2022 to 0.04% in Q1 2023, as its GDP growth also went from negative to positive in that period[2]. Mexico, China and Brazil recorded the largest improvements in their growth rates, at +1.14.%, +0.52% and +0.41% respectively.
Between Q4 2022 and Q1 2023, the share of FTTH/B connections in the total fixed broadband subscriptions went up by 0.7% and stood at 66.7%. Broadband connections based on other technologies saw their market shares shrink further, with an exception of satellite and wireless (mainly FWA), which remained stable.

FTTx (mainly VDSL) share stood at 6.7%[3]. VDSL subscriber numbers grew in ten countries (including modest quarterly increase in the large VDSL markets of Turkey, Czech Republic, Greece and Germany, for example), while they fell in 22 other markets as consumers migrated to FTTH/B.

It remains to be seen whether consumers will continue to gravitate toward fibre broadband offerings, particularly as global economies face potential slowdown and inflationary pressures.
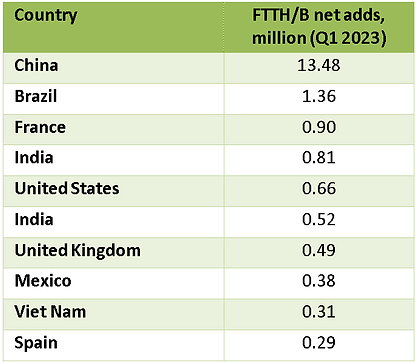
In terms of FTTH/B broadband net additions in Q1 2023, China continued to maintain a significant lead with 13.5 million while Brazil added 1.4 million. Mexico is back in the top ten league, having pushed out Argentina this quarter.
Satellite broadband also saw a modest growth of 1.3% while wireless broadband demonstrated continued relevance with a respectable growth rate of 4.9%. These trends can be attributed to the demand for connectivity in remote or underserved areas where traditional broadband infrastructure is not feasible.

The diverse growth rates among different broadband technologies highlight the dynamic nature of the industry as consumers seek more reliable and high-speed connections. The significant increase in FTTH/B connections and the growth of satellite and wireless broadband underline the ongoing efforts to bridge the digital divide and ensure connectivity for all.
The top ten countries by fixed broadband subscribers remained unchanged (Figure 5). As of Q1 2023, China exceeded 0.6 billion fixed broadband subscribers, having added 14.6 million in the quarter. Also, the country is approaching 1.2 billion 5G subscribers, with the service now being used by 84% of the population.

Overall, the latest fixed broadband subscriber data reveals a clear trend towards advanced, high-speed broadband solutions like FTTH/B, while older technologies such as copper-based broadband (ADSL and VDSL) are experiencing a decline, suggesting that the broadband landscape is continuously evolving to meet the growing demand for faster and more reliable connectivity.
References:
https://www.point-topic.com/post/global-broadband-subscriptions-q1-2023
Point Topic: Global Broadband Tariff Benchmark Report- 2Q-2022
Point Topic: Global fixed broadband connections up 1.7% in 1Q-2022, FTTH at 58% market share
Point Topic Analysis: 4G LTE /5G tariffs provided by mobile operators across Europe
Point Topic has compared the average monthly subscription charges and download speeds offered by mobile broadband providers across the EU-28, Norway and Switzerland. All prices are quoted in US dollars at PPP (purchasing power parity) rates to allow for easier comparison.
Overall 4G/5G tariff trends
In Q2 2020, the average monthly charge for residential 4G/5G data services varied from $73.62 (PPP) in Greece to $17.27 (PPP) in Italy.

Figure 1. Average residential 4G/5G monthly tariff in PPP$, Q2 2020
…………………………………………………………………………………………………………………………………………………………………………………………………………..
In some instances, a relatively low average monthly charge comes with high average data cap (Figure 2). For example, this quarter Switzerland, Denmark and the Netherlands stand out as being at the high end of data allowances but at the low end of monthly charges, providing the best value for money to subscribers. This is reflected in the average cost per GB of data in these countries being among the lowest in Europe (Figure 3). In Slovakia, Czech Republic, Cyprus and Greece, on the other hand users pay a high monthly price for very low data allowance.

Figure 3. Average cost per GB of 4G/5G data in PPP$, Q2 2020
One of the factors which complicates comparing mobile broadband services between countries and against fixed broadband services is the fact that some mobile operators do not report bandwidth on their tariffs. Even when they do, the difference between the theoretical maximum bandwidths and the actual ones is much higher for mobile broadband compared to fixed.

Figure 4. Average theoretical downstream speed on residential 4G/5G services, Q2 2020
Nevertheless, Figure 4 shows which countries are investing in higher speed and more advanced networks, including those using the LTE-Advanced technology as well as those which are rolling out 5G. For example, Switzerland was among countries who offered lowest average downstream speeds in Q1 2019, however, after introducing 5G services it offers the second highest average downstream speed of 760Mbps and the top 5G speed of 2Gbps. The average speed in Italy also increased significantly after the 5G launch. The country now offers the highest average downstream speed of 1Gbps having overtaken Switzerland in Q4 2019. Denmark and Austria, among others, offer relatively low bandwidth, while being among the most generous markets in terms of data allowances[1].
[1] It should be noted that Denmark is a special case. The 71Mbps refers to the maximum download speed that the Danish operators are allowed to market after agreement with the consumer ombudsman. In fact, TDC’s theoretical maximum speed in 2018 was 413Mbps.
Regional and country benchmarks
The data will vary at a country level but when comparing the markets of Central & Eastern and Western Europe at a regional level, Western Europe came out on top in terms of the average data allowance with 167GB per month, compared to 116GB in Central & Eastern Europe. At the same time, customers in Western Europe were charged a lower average monthly subscription at $32.95 PPP. In Central & Eastern Europe, the same indicator was $37.26 PPP (Figure 5). Hence, the average cost per GB in Central & Eastern Europe was significantly higher at $0.32 PPP, compared to $0.20 PPP in Western European markets. In terms of downstream speeds, both regions recorded the same average speed of 242 Mbps.

Figure 5. Regional tariff benchmarks for residential 4G/5G services, Q2 2020
Among the selected six mature markets, Sweden stands out in terms of the top average data cap and Italy in terms of the lowest average monthly charge (Figure 6).

Figure 6. Tariff benchmarks for residential 4G/5G services in six major European economies, Q2 2020
The mobile operators in Sweden offer consumers on average 145GB a month while the Netherlands follow with 123GB average allowance. For several quarters in a row the Netherlands offered the highest average monthly charge among the selected six markets but in Q3 2019 the prices dropped significantly, and the country is now the second cheapest with only Italy offering a lower average monthly subscription of $17.27 PPP. The Netherlands offers the lowest average cost per GB, currently at $0.20 PPP, compared to $3.36 PPP in Germany (Figure 7).

Figure 7. Average data and cost of 4G/5G services in selected countries, Q2 2020 (in $PPP)
To compare the prices that residential customers pay for unlimited monthly 4G/5G data in various European markets, we selected the countries which offered such tariffs in Q2 2020 (Figure 8).

Figure 8. Entry level monthly charge for unlimited data on residential 4G/5G tariffs, Q2 2020
The entry level unlimited data tariffs in the countries at the high end of the spectrum (Sweden) were 3.5 times higher than those at the low end (Switzerland). However, when customers paid $54.84 PPP for unlimited data in Sweden, they were purchasing 4G services with speeds up to 300Mbps, while in Switzerland they were charged $15.57 (PPP) for the advertised 4G speed of up to 10Mbps.
Country ranking
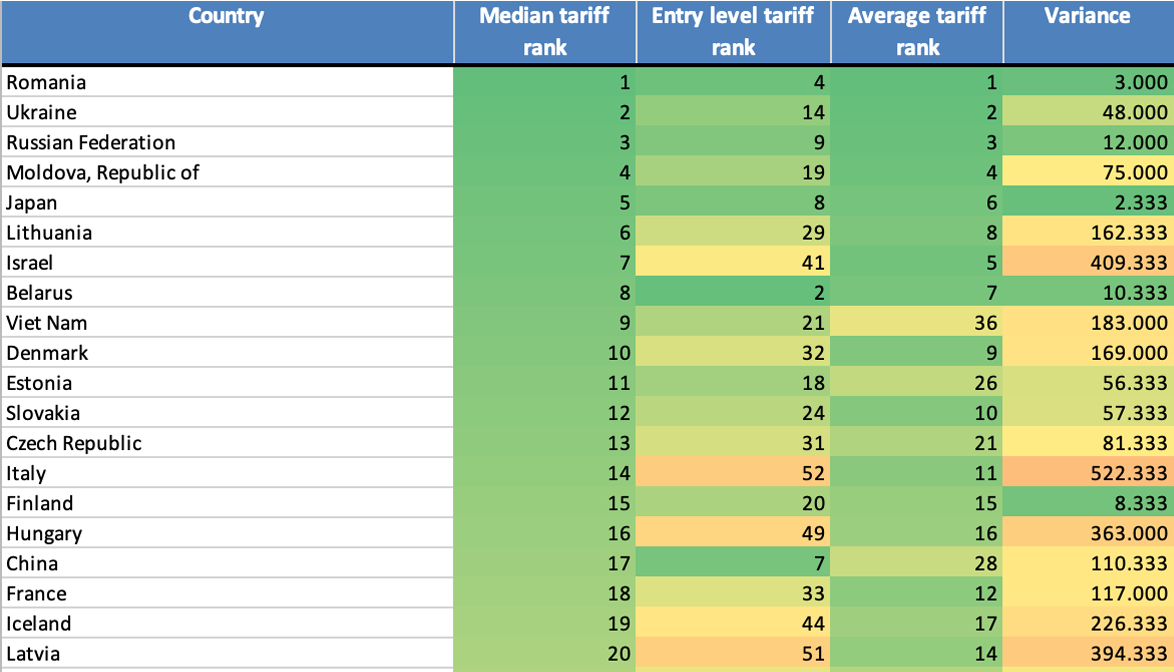
Comparing countries by using the average cost of mobile broadband subscriptions is a straightforward idea but the variation in entry level versus median and average costs can be significant. To help provide an easy way of comparing directly we have taken the $PPP data on entry level, median and average tariffs, produced rankings and then compared the variance (Table 1).

Table 1. Country scorecard by residential 4G/5G tariffs, Q2 2020
* Countries which now offer 5G
We have included a ‘variance’ column to indicate how different ranks for the different metrics are spread. We see that the wide spread in Austria, Slovakia and Spain for example is represented by high variance. At the other end of the scale countries like Poland, Sweden or Croatia rank rather consistently.
Why such market differences between countries?
There is no simple clear-cut explanation as many factors come into play. The length of time after the 4G/5G networks were launched, service take-up, the market shares of ‘standalone’ and of multi-play bundles, the extent of competition from fixed broadband services with comparable bandwidth, the availability and the cost of 4G/5G spectrum, the regulatory pressures to offer mobile broadband services in remote and rural areas as a priority, the demographic characteristics and life-styles of the users and the cord-cutting tendencies will all have influenced the 4G and 5G offerings available in different European markets. A further statistical modelling would provide more insight into these differences.
What Point Topic measured
This analysis is based on more than 800 tariffs from all major mobile broadband providers from the EU-28, Norway and Switzerland. In total, we provide data on 88 operators from 30 countries. We track a representative sample of tariffs offered by each operator, making sure we include the top end, the entry level and the medium level tariffs, which results in a broad range of prices and data allowances.
We use this data to report on pan-European trends in tariffs and bandwidths offered. We also report on regional trends and variations across countries. The data can be used to track changes in the tariffs offered by individual operators as well.
Technologies
We track mobile broadband tariffs provided over 4G LTE and LTE-Advanced technologies. For the sake of brevity, we are referring to both of them as ‘4G LTE’ or sometimes ‘4G’. From Q2 2019, a small number of 5G tariffs are included in our analysis. Countries which offered 5G commercially at the time of our quarterly data collection are marked with an asterisk (*).
Standalone and bundled
We record 4G / 5G tariffs which are offered as SIM only data only, some of which come with a device (a modem). From Q2 2017 onwards we do not track tariffs bundled with tablets. However, we do record multi-play service bundles (mobile broadband plus TV, fixed broadband and/or voice). From this quarter, they are not included in this analysis, only in the tariff database. We track monthly tariffs rather than daily, weekly or pay as you go, and exclude tariffs offered as part of the smartphone purchase.
Residential and business
We record both business and residential mobile broadband tariffs. The analysis in this report is based on residential tariffs.
Currency
To allow for comparison between countries with different living standards, this report refers to the tariffs in $ PPP (purchasing power parity). The data on PPP conversion rates is provided by the World Bank. The tariffs in our database are also available in local currencies, USD, EUR and GBP.
Notes on methodology
In order to represent the tariffs we collate more efficiently, we have consolidated the tariff benchmark spreadsheets into a single file. This is available to subscribers to the Mobile Broadband Tariffs service – click here to access the full file.
If there is a particular element that you cannot find, and you wish to have available please contact us on [email protected].
Coverage and methodology
A full set of mobile broadband tariff data is available for download as part of Point Topic’s Mobile Operator Tariffs Service. The data set contains the most up-to-date end of quarter tariff information including such details as monthly rental, connection speed, data allowance, equipment costs, service features and special offers.
Price comparison issues
This analysis is intended as a general indicator of the trends in 4G/5G service pricing across Europe. There are several additional variables that complicate the process of making a direct comparison of mobile broadband tariffs. They need to be taken into account when making a more in-depth analysis:
- Device charges: Some 4G/5G monthly tariffs include all charges for devices, for example, routers or dongles, whereas others come with additional one-off (upfront) costs which can be substantial. We include monthly device charges in the total monthly subscription, and it is this figure that is used in the analysis. One-off charges are more difficult to compare as they vary depending on the device and the monthly charge a user is prepared to pay.
- Bundling: Increasingly, mobile operators are entering the multi-play arena by bundling their mobile broadband services with voice services, fixed broadband and TV. At the moment, the Mobile Broadband Tariffs service provides access to a sample of multi-play bundles from Europe and beyond. Note: although 4G/5G tariffs which come with a device may be regarded as bundles, we refer to them as standalone mobile broadband services as the device such as a modem is regarded as ‘equipment’, in line with our fixed broadband tariff methodology. The analysis presented in the current report only refers to ‘standalone mobile broadband’ tariffs.
- Data allowances: Some operators offer entry-level services with very low data caps. From
Q1 2017, the minimum data allowance we include is 1GB per month. In most cases, however, these limits are generous enough for a typical user and, in some cases, even comparable to those offered by fixed broadband providers. An increasing number of tariffs are offered with ‘unlimited’ data usage. To make it possible to include these tariffs in our calculations, we assigned 600GB per month to the unlimited data tariffs. - Downstream and upstream speeds: Some operators do not report mobile broadband speeds, not least because they are so variable. Others do, and where this is the case we record the theoretical maximum speed. In reality, the actual average speed can be lower up to 10 times or more. This should be taken into account when comparing 4G LTE services with fixed broadband, for example.
References:
http://point-topic.com/free-analysis/4g-5g-tariffs-in-q2-2020/
Point Topic Analysis of Fixed Broadband Tariffs from 300 Operators in 90 Countries
|
|
|
|
|


Point Topic: China leads FTTH adoption with 80% of net adds through 1Q-2018
|
|
|
Point Topic: 931.6M Fixed Broadband Connections at end of Q4-2017; VDSL Growth but Copper Connections Continue Decline
|
|

|
PointTopic: Fiber & cable make up 3/4 of global fixed broadband subscriptions
Fiber and cable networks are dominating the global broadband market, with the technologies now servicing 77% of fixed subscriptions, new figures from Point Topic have revealed.
According to the Global Broadband Statistics, which take into account subscriptions up to the end of 2017, more than 50% of people in more than 40 countries, including Singapore (97%), China (89%), United States (87%), and the UK (55%), are connected via full-fiber, fiber-fed copper or cable.
Point Topic Research Director Dr Jolanta Stanke told the Broadband Forum:
“We are finding that customers across most global regions increasingly prefer faster broadband services delivered over fiber and cable platforms, as opposed to ADSL. This trend will continue as more bandwidth-hungry young consumers become paying decision makers, even though superfast 4G LTE and 5G mobile broadband services will compete for their wallets.”
Fiber-fed subscriptions – including Fiber-to-the-Home (FTTH), Fiber-to-the-Building (FTTB), Fiber-to-the-Cabinet (FTTC), Very High Bitrate Digital Subscriber Line (VDSL), VDSL2 and G.fast – accounted for 57% of broadband subscriptions, with more than 530 million connections. Stanke agreed VDSL and Gfast were together largely responsible for the growth that fiber has seen, with more than 30 operators across all continents deploying or trialing G.fast.
“G.fast gives operators a more cost-effective variant of fiber that will be used by operators who want to upgrade their existing networks quicker and more easily,” she added. “This could enable them to serve more customers in less densely populated areas, where direct fiber investment is less economically feasible.”
In total, cable, including hybrid fiber-coaxial, accounted for 20% of all fixed broadband connections. According to the report, the latest standard of this technology is currently deployed across several markets, being especially popular in North America, and can deliver gigabit download speeds.
Broadband Forum CEO Robin Mersh said the figures reflect the fact that new technologies that let operators deploy fiber deep into the network without having to enter buildings themselves are quickly moving from trials to mass deployment.
“If operators want to deliver competitive broadband services, maximizing their investments through the use of technologies like G.fast is vital,” said Mersh. “Expanding the footprint of their existing fiber networks in this way is cost-effective and delivers the gigabit speeds consumers crave. The growing trend towards fiber, whether its fiber-fed copper or full fiber, and cable deployments highlighted by Point Topic’s report confirms that the Forum’s work on interoperability and management of ‘fiber-extending’ technologies is vitally important.”
The voracious demand for connectivity is evident in the increased demand for fiber, cable and coax despite the parallel growth of LTE and MAYBE (?) “5G.”
Though “5G” is in currently proprietary to each wireless network operator, huge investments in fiber, coax and copper are being made because strategic planners expect 5G to be mainstream in the next several years (we think NOT until late 2021 at the earliest when IMT 2020 recommendations are finalized and implemented in base stations and endpoint devices.
Last month, Broadbandtrends’ Global Service Provider G.fast Deployment Strategies surveyed 33 incumbent and competitive broadband operators from across the globe. The market research firm found that four in five service providers have G.fast plans for this year and that 27% are in active deployments. AT&T is a huge supporter of G.fast while Verizon is not.
About the Broadband Forum
Broadband Forum, a non-profit industry organization, is focused on engineering smarter and faster broadband networks. The Forum’s flagship TR-069 CPE WAN Management Protocol has now exceeded 800 million installations worldwide.
