

Broadband Access Subscriber Growth
Dell’Oro: Broadband Equipment Spending to exceed $120B from 2022 to 2027
Dell’Oro Group predicts the broadband equipment market will surpass $120 billion in cumulative spending between 2022 and 2027. The market research firm says sales of PON equipment for fiber-to-the-home deployments, cable broadband access equipment, and fixed wireless CPE will show a 0.2% Compounded Annual Growth Rate (CAGR) from 2022 to 2027. Service providers continue to expand their fiber and DOCSIS 3.1/4.0 networks, while also increasing the reliability and sustainability of their broadband access networks.
“After three consecutive years of tremendous broadband network expansions and upgrades, 2023 is expected to show a return to normalized levels of spending,” said Jeff Heynen, Vice President of Broadband Access and Home Networking research at Dell’Oro Group. “After 2023, spending is expected to increase through 2026 and 2027, driven by 25 Gbps and 50 Gbps PON, Fixed Wireless CPE, as well as DAA and DOCSIS 4.0 deployments.”
Labor markets are “still being challenged” and a number of fiber based network operators (AT&T, Altice USA, Frontier) have reduced their expansion plans and homes passed targets. “To close out 2022 we did see a significant uptake in equipment purchases, and what happened there was supply chains appeased. A lot of orders that had been on the books for a long time have been fulfilled.”
Network equipment vendors are working through that inventory they had built up while taking on “additional equipment purchases.
Additional highlights from the Broadband Access & Home Networking 5-Year July 2023 Forecast Report:
- PON equipment revenue is expected to grow from $11.8 B in 2022 to $13.3 B in 2027, driven largely by XGS-PON deployments in North America, EMEA, and CALA.
- Revenue for Cable Distributed Access Equipment (Virtual CCAP, Remote PHY Devices, Remote MACPHY Devices, and Remote OLTs) is expected to reach $1.6 B by 2027, as operators ramp their DOCSIS 4.0 and fiber deployments.
- Revenue for Fixed Wireless CPE is expected to reach $2.7 B by 2027, led by shipments of 5G sub-6GHz and 5G Millimeter Wave units.
- Revenue for Residential Wi-Fi Routers will surpass $5.2 B in 2027, owing to massive shipments of Wi-Fi 7 units.
“Which isn’t going to float to manufacturers until you know, late 2024, really into 2025,” he said. “I think in the interim, XGS-PON in the European market is certainly going to catch up. We’re also seeing considerable growth in XGS-PON deployments now in China.”
In Dell’Oro’s five-year forecast published in January, Heynen expected fixed wireless subscriber growth, particularly in North America, would “start to moderate” beginning in 2024, due to factors like “capacity issues and fiber expansion.”
Heynen has increased his revenue predictions for the fixed wireless CPE market – which he previously tipped would hit $2.2 billion in five years – and now predicts subscriber growth to continue into 2025.
“Part of that is because of the net reduction in homes passed for fiber,” he said. “In the meantime, fixed wireless will be able to cover more ground while the operators who are building out fiber kind of extend their overall deployment plans.”
Further, operators like T-Mobile and Verizon “are seeing fixed wireless as a way to secure broadband subscribers away from cable operators. The U.S. market is really dynamic in terms of how services can be marketed.”
The Dell’Oro Group Broadband Access & Home Networking 5-Year Forecast Report provides a complete overview of the Broadband Access market with tables covering manufacturers’ revenue, average selling prices, and port/unit shipments for PON, Cable, Fixed Wireless, and DSL equipment. Covered equipment includes Converged Cable Access Platforms (CCAP), Distributed Access Architectures (DAA), DSL Access Multiplexers (DSLAMs), PON Optical Line Terminals (OLTs), Customer Premises Equipment ([CPE] for Cable, DSL, PON, Fixed Wireless), along with Residential WLAN Equipment, including Wi-Fi 6E and Wi-Fi 7 Gateways and Routers. For more information about the report, please contact [email protected].
Dell’Oro Group is a market research firm that specializes in strategic competitive analysis in the telecommunications, security, enterprise networks, data center infrastructure markets. Our firm provides in-depth quantitative data and qualitative analysis to facilitate critical, fact-based business decisions. For more information, contact Dell’Oro Group at +1.650.622.9400 or visit www.delloro.com.
References:
https://www.fiercetelecom.com/telecom/broadband-equipment-market-eclipse-120b-2027-delloro
Dell’Oro: XGS, 25G, and Early 50G PON Rollouts to Fuel Broadband Spending
Dell’Oro: Bright Future for Campus Network As A Service (NaaS) and Public Cloud Managed LAN
Dell’Oro: FWA revenues on track to advance 35% in 2022 led by North America
Dell’Oro: PONs boost Broadband Access; Total Telecom & Enterprise Network Equipment Markets
Dell’Oro: U.S. suppliers ~20% of global telecom equipment market; struggling in RAN business
Futuriom and Dell’Oro weigh in on SD-WAN and SASE market: single vendor solutions prevail
AT&T, Verizon and Comcast all lost fixed broadband subscribers in 2Q-2023
The three most dominant broadband wireline ISPs in the U.S. all lost wireline subscribers in Q2-2023.
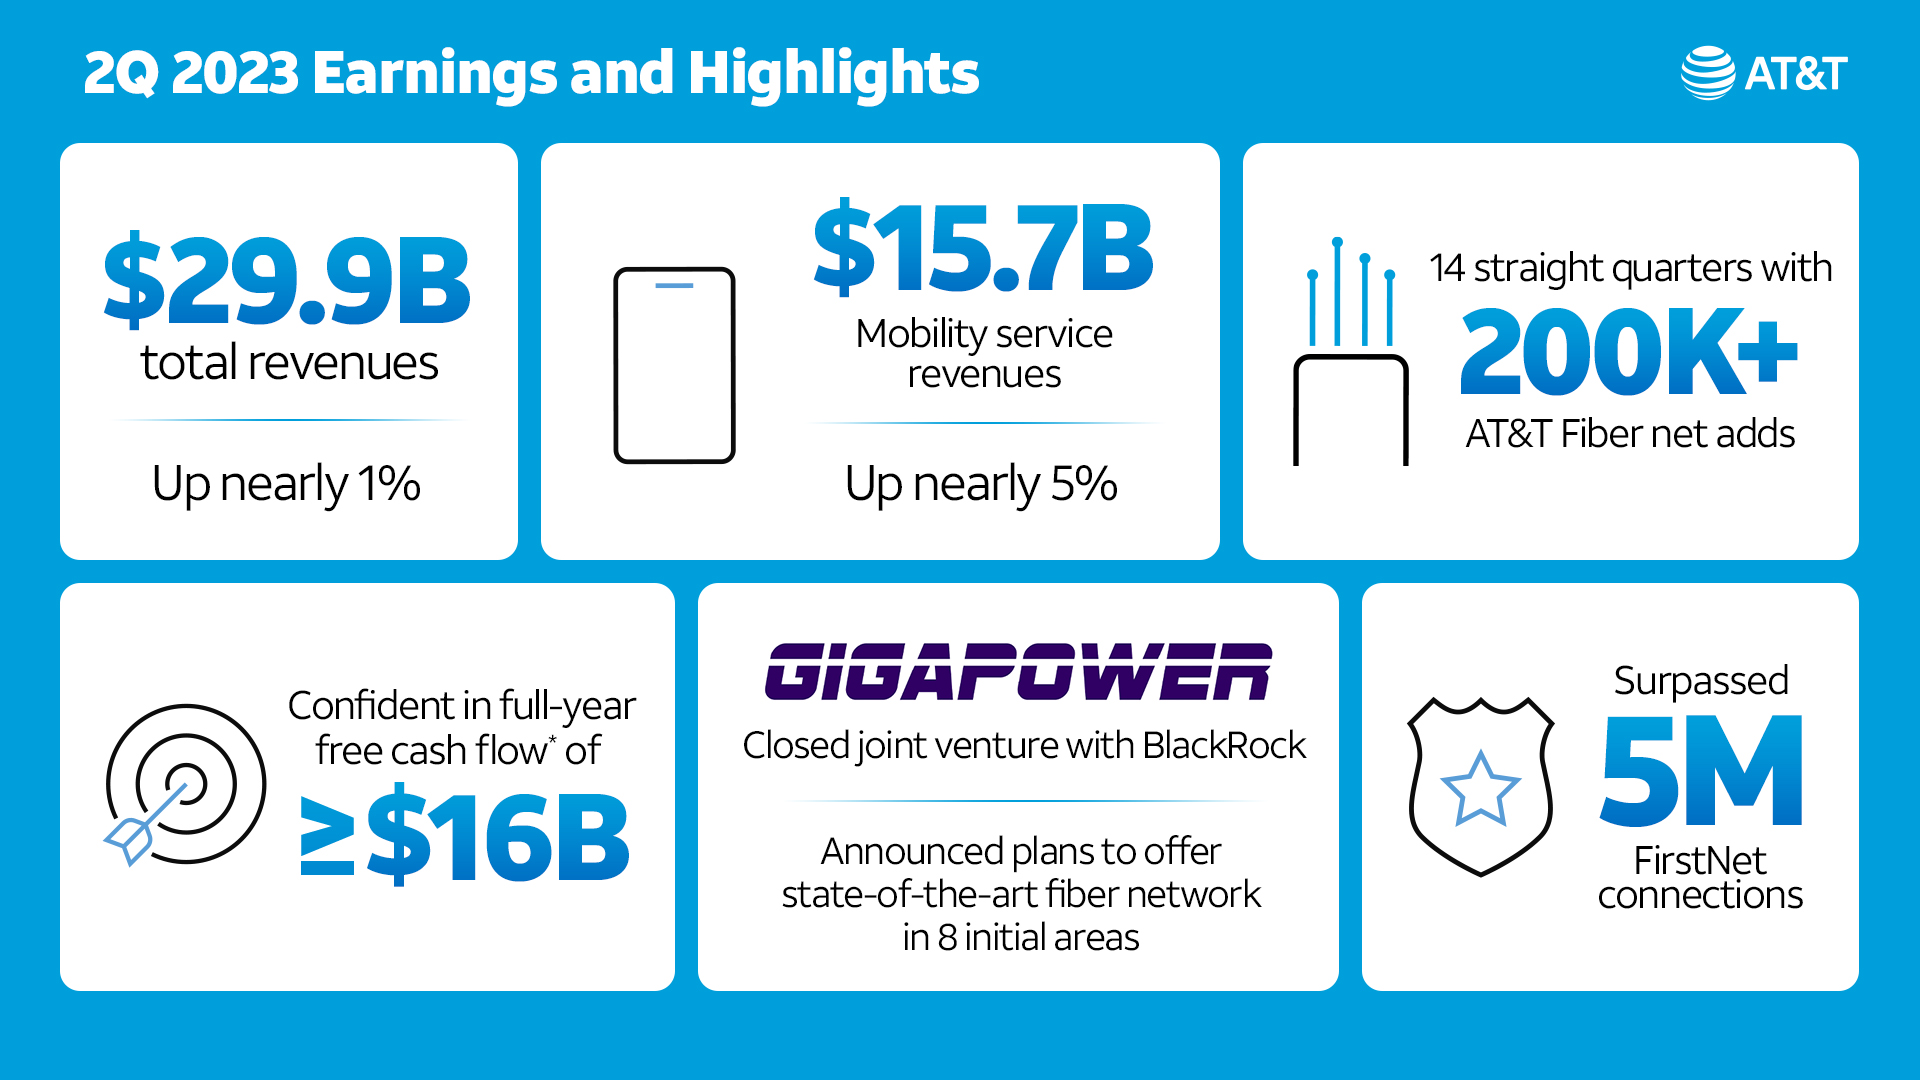
1. AT&T’s net total broadband access showed a loss of 35,000 subscribers in Q2-2023, which widened from a loss of -25,000 in the year-ago quarter. AT&T ended Q2 with 15.3 million broadband connections (including DSL), down 1.3% from 15.5 million a year earlier.
AT&T continued to add new fiber subscribers, but the pace of that growth slowed. AT&T added 251,000 fiber subs in Q2, down from +316,000 in the year-ago quarter and down from +272,000 in the prior quarter.
AT&T ended the period with 7.73 million fiber subs. Fiber average revenue per user (ARPU) was $62.26, up from $57.64 in the year-ago period.
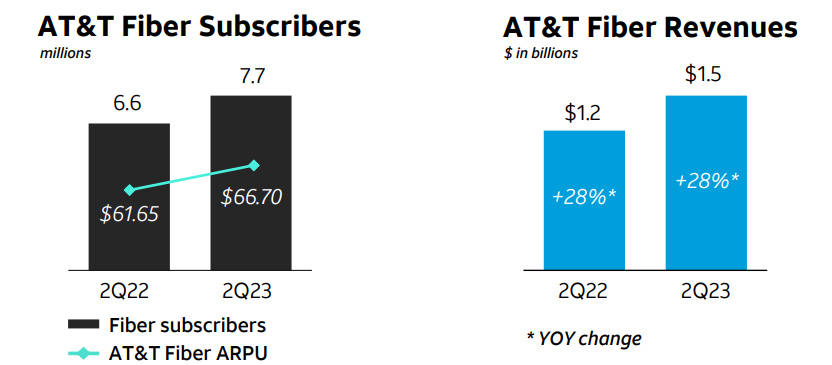
(Source: AT&T Q2 2023 earnings presentation)
AT&T added about 500,000 fiber locations during the quarter, ending Q2 with 20.2 million. CEO Stankey said AT&T remains on track to build fiber-to-the-premises (FTTP) tech to 30 million locations by 2025.
AT&T’s average fiber penetration rate is hovering at 38%. “Everywhere we put fiber in the ground, we feel good about our ability to win with consumers,” Stankey said.
AT&T shed 286,000 non-fiber subscribers in the quarter, lowering that total to 5.95 million. AT&T also lost another 25,000 DSL subs in the quarter, ending the period with just 259,000.
Source: AT&T
…………………………………………………………………………………………………………………..
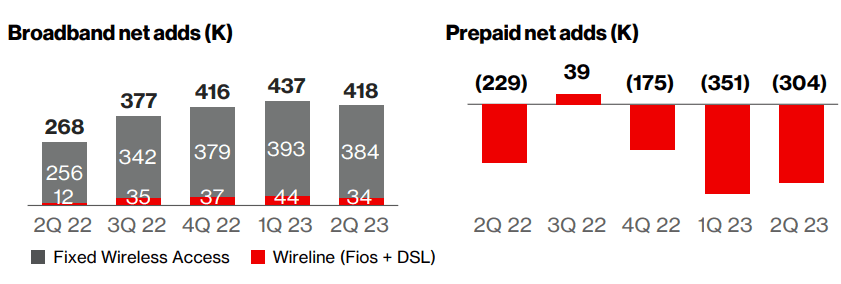
2. While Verizon added 54K FiOS internet subscribers in 2Q-2023 (51K FiOS net adds from Consumer, 3K from Business customers), it had a net loss of 304K wireline broadband subs when the loss of DSL subscribers was factored in.
From Verizon’s 2Q-2023 earnings call presentation:
Source: Verizon
Remarkably, Verizon added a net 384K fixed wireless subscribers, an increase from 256,000 fixed wireless net additions in second-quarter 2022. Verizon now has nearly 2.3 million subscribers on its fixed wireless service.
Due to FWA growth, Verizon reported total broadband net additions of 418,000 in 2Q-2023.
……………………………………………………………………………………………………………………………..
Comcast, the largest U.S. ISP, lost 20,000 residential broadband subscribers, lowering its total to 29.79 million. Comcast’s total broadband subscriber loss of 19,000 (including a gain of 1,000 business broadband customers), was better than the -74,000 expected by Wall Street analysts.
Comcast, which lost 10,000 residential broadband subs in the year-ago quarter, warned in April that it doesn’t expect to see much in the way of broadband subscriber growth gains in the near-term. The company also noted that it expected those numbers to be even lower in Q2 due to a slow housing move market paired with traditional “seasonality” driven by students and retirees returning for the summer.
Dave Watson, president and CEO of Comcast Cable, said on today’s earnings call that he expects Comcast to return to broadband subscriber growth “over time.” One way Comcast is pursuing subscriber growth is through network expansion and edge-outs that will total about 1 million locations in 2023. Comcast, which operates in 39 US states, also intends to participate in the Broadband Equity Access and Deployment (BEAD) program, which recently announced state-by-state funding allocations.
Comcast has cited average revenue per user (ARPU) growth as the key metric of its broadband business. And Comcast’s broadband ARPU grew 4.5% in the quarter, matching the ARPU growth rate it posted in the prior quarter.
……………………………………………………………………………………………………………………..
Here are the top 20 broadband wireline ISPs in the U.S.:
| # | Internet Service Provider | Type | States |
| 1 | Comcast | Cable | National |
| 2 | Charter Communications | Cable | National |
| 3 | AT&T | Fiber | National |
| 4 | Verizon | Fiber | Mid-Atlantic, Northeast |
| 5 | Cox Communications | Cable | National |
| 6 | Altice USA | Cable/Fiber | National |
| 7 | Lumen Technologies | Fiber | West, Florida |
| 8 | Frontier Communications | Fiber | National |
| 9 | Mediacom Communications | Cable | Midwest, Southeast |
| 10 | Astound Broadband | Cable/Fiber | National |
| 11 | Windstream Holdings | Fiber | South, Midwest, Northeast |
| 12 | Brightspeed | Fiber | Midwest, Southeast |
| 13 | Cable One | Cable | West, Midwest, South |
| 14 | Breezeline | Cable/Fiber | East Coast |
| 15 | WideOpenWest (WOW!) | Cable/Fiber | AL, FL, GA, MI, SC, TN |
| 16 | TDS Telecom | Cable/Fiber | National |
| 17 | Midco (Midcontinent Communications) | Cable | MN, ND, SD, WI, KS |
| 18 | Consolidated Communications | Fiber | National (22 states) |
| 19 | Google Fiber | Fiber | National (16 states) |
| 20 | Ziply Fiber | Fiber | WA, OR, ID, MT |
Source: https://dgtlinfra.com/top-internet-providers-us/
……………………………………………………………………………………………………………………………..
References:
https://about.att.com/story/2023/q2-earnings.html
SDFI: Denmark Achieves 94.5% Gigabit Broadband Internet Coverage
New data from the Broadband Mapping 2023 report by the Danish Agency for Data Supply and Efficiency (SDFI) reveals that 97.5% of homes and businesses in Denmark now have access to high-speed broadband internet access.
The latest report from the Styrelsen for Dataforsyning og Infrastruktur (SDFI) sheds light on Denmark’s regional broadband coverage rates. The Region North Jutland has almost reached a 100 percent coverage rate.
According to the report, the coverage rate in Northern Jutland stands at an impressive 98.9%. Central Jutland closely follows with 97.7% coverage, while Southern Denmark boasts a coverage rate of 98.3%t. Zealand, the country’s largest island, achieves a solid coverage rate of 98%.
Although the country has made progress in digital connectivity, according to SDFI, there are still regional disparities in coverage. The Capital Region of Hovedstaden lags behind the other regions with a coverage rate of 96.2% (compared to Northern Jutland with 98.9%). Further, 94.5% of all households in Denmark can access Gigabit speeds, an increase of 2.6 percentage points year-on-year.
The report highlights the ongoing efforts of telecommunications companies in deploying broadband across the country. According to SDFI, 97.5% of homes and businesses currently can access fast broadband with speeds of at least 100 Mbps download and 30 Mbps upload. Moreover, 94.5% of users have access to gigabit speeds, representing a 2.6 percent increase from last year.
The findings of the SDFI report demonstrate Denmark’s commitment to improving broadband infrastructure and connectivity nationwide. As the country continues to prioritize digital transformation, it will pave the way for a more connected and digitally empowered society.
References:
https://www.commsupdate.com/articles/2023/06/30/95-of-danish-households-covered-by-gigabit-speeds/
https://telecomtalk.info/denmark-achieves-945percent-gigabit-broadband-coverage-sdfi/727153/
https://digital-strategy.ec.europa.eu/en/node/9828/printable/pdf
MoffettNathanson: 87.4% of available U.S. homes have broadband; Leichtman Research: 90% of U.S. homes have internet
When the FCC announced the November 18th release date for their long-awaited broadband mapping update, reflecting location-specific broadband availability as of June 2022, analysts at MoffettNathanson thought it would contain information on how many of U.S. homes have access to broadband and how many are too rural and are therefore unserved. However, that FCC release didn’t offer the numbers they needed, and the market research fim didn’t
have the necessary information to calculate it themselves.
In the underlying FCC datasets, which are provided for public download, each location served by a given technology or provider is a separate entry. One location is equivalent to one street address. But many street addresses in the U.S. correspond to multiple living units, and the number of units per location is not publicly available (the location fabric used by the FCC was contracted to a third party, CostQuest Associates, and that fabric is provided only to the FCC, broadband providers, state/local government entities, and select other interested parties). With approximately 31% of residences in multifamily homes, according to a 2019 survey by the Census Bureau, the number of units per location was, as of the November 18th release, a crucial missing piece for any meaningful coverage analysis we could do on our own.
Principal Analyst Craig Moffett wrote:
The FCC’s new maps of broadband availability can tell us coverage for residential locations or business locations, but not the combined total. The companies we cover sometimes break out residential and commercial, but not always. [As an aside, about half of small businesses in the U.S. are actually operated out of peoples’ homes, but hopefully this, at least, doesn’t introduce further distortion, since we are presumably still seeing just one subscription for one location]. So we’ll do our best to make sure we’re matching numerator and denominator by specifying whether we’re looking at all locations or residential locations only.
The FCC’s coverage data also doesn’t distinguish between occupied and vacant units. For our calculation of penetration, we’d want to exclude most vacant units, since vacant units don’t need broadband. Excluding all vacant units likely understates the denominator, though; for example, some second homes (which are treated as vacant) may have year-round broadband subscriptions. The best we can do is assume the coverage of total units is the same as the coverage of occupied units, and that vacant units with broadband subscriptions are negligible.
The FCC does report service coverage for satellite and fixed wireless. But some of those FWA subscribers are in areas where there’s no access to wired broadband, while others are in areas where wired broadband is available. Naturally, the companies won’t tell us how many of each there are. So we’ll just have to leave them all out. We’ll focus just on the availability of wired broadband.
Editor’s Note: The FCC broadband map for my address show a Licensed Fixed Wireless operator serves my condo. It’s California Internet with symmetrical 1G upstream/1G downstream. Also, there are two Satellite providers – Hughes Network Systems, LLC 25M/3M and Space X 350M/40M. Wired internet is available from AT&T and Comcast.
We’d really want to know how many DSL subscribers are in each of those different cohorts. But the
companies we cover don’t report how many of their DSL subscribers are in areas where there is
also a cable or fiber operator, and how many are in areas where DSL is the only option. The first
group is at risk. The second group is not. So, we’ll just have to include all DSL.
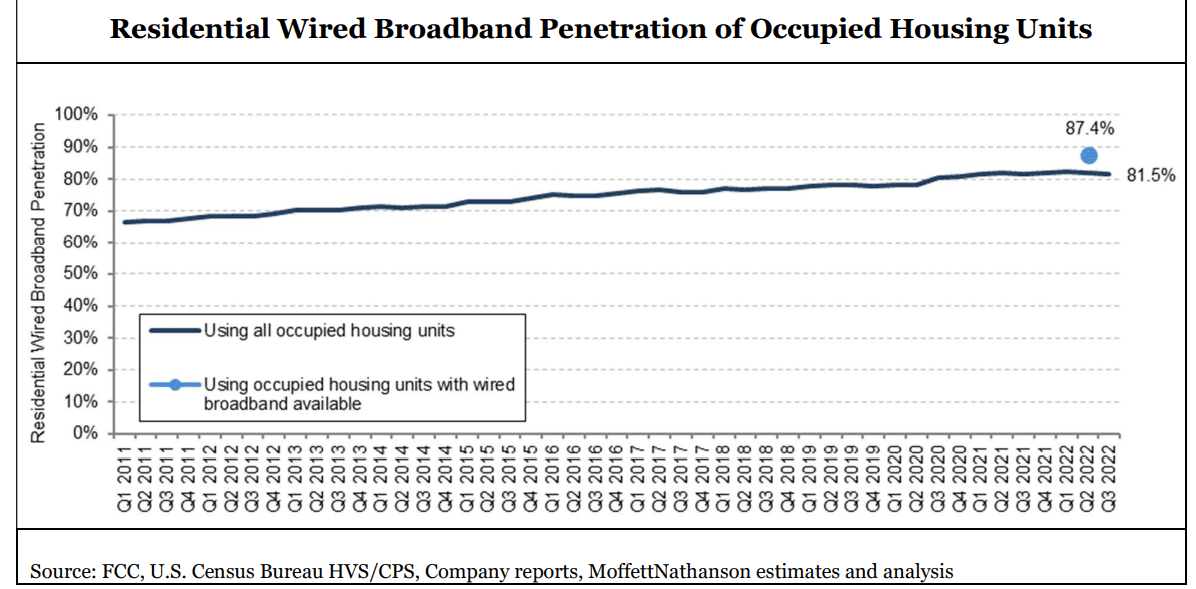
According to the FCC’s current estimates, wired broadband (defined as anything over 200 kbps downstream and 200 kbps upstream) was available to 93.7% of residential units in America as of June 30, 2022. Again, we don’t know the percentage of occupied housing units with wired broadband available, but let’s assume it’s the same. And we don’t know the number of residential units in the location fabric, so we’ll use the Census Bureau’s estimate of 128.1M occupied housing units in the U.S. Given these assumptions, we estimate wired broadband was available to around 120.0M occupied housing units as of June 30, 2022. With, by our count, an estimated 104.9M residential wired broadband subscriptions in America in Q2 2022 – again, including DSL, and sometimes including commercial as well as residential subscribers – that translates into penetration of 87.4% of broadband-available homes. We estimate that 81.5% of all households subscribe to wired broadband.
Craig’s Conclusions:
The goal for the FCC is to create maps that are not frozen in time but instead become living and breathing reflections of a dynamic marketplace. The new maps are subject to a public challenge process, enabling interested parties, including operators, local governments, and even individual would-be subscribers, to dispute reported availability. Challenges will eventually be part of a routine updating process. Indeed, the maps released in November were the product of what had already been a months-long initial challenge process. The maps are, again, a critical input to distribution of $42.5 billion of funds earmarked for rural broadband by the JOBS/Infrastructure Act. The National Telecommunications and Information Administration (NTIA) is required by law to use the FCC’s new map to distribute those funds in what is referred to as the Broadband Equity, Access, and Deployment (BEAD) Program, something they have committed to do by June 2023. They are likely to begin that process almost immediately, based on the number of unserved locations in each state, although NTIA chief Alan Davidson has said they will wait for the FCC to release the second version of its coverage map, later this year, before they actually begin to disburse those funds.
The network operators themselves, including the cable operators in particular, will in our view be major participants in the BEAD process, bidding aggressively to bring broadband to unserved census blocks on the periphery of their current franchise areas.
…………………………………………………………………………………………………………………………………………………………………………….
Meanwhile, Leichtman Research Group indicates that 90 per cent of U.S. households get an Internet service at home, compared to 84 per cent in 2017, and 74 per cent in 2007. Broadband accounts for 99 per cent of households with an Internet service at home, and 89 per cent of all households get a broadband Internet service – an increase from 82 per cent in 2017, and 53 per cent in 2007.
These findings are based on a survey of 1,910 households from throughout the United States and are part of a new LRG study, Broadband Internet in the U.S. 2022. This is LRG’s twentieth annual study on this topic.
Other related findings include:
- Individuals ages 65+ account for 34% of those that do not get an Internet service at home
- 56% of broadband subscribers are very satisfied (8-10 on a 1-10 scale) with their Internet service at home, while 6% are not satisfied (1-3).
- 44% of broadband subscribers do not know the download speed of their service – compared to 60% in 2017
- 61% reporting Internet speeds of >100 Mbps are very satisfied with their service, compared to 41% with speeds <50 Mbps, and 57% that do not know their speed
- 40% of broadband households get a bundle of services from a single provider – compared to 64% in 2017, and 78% in 2012
- 59% of adults with an Internet service at home watch video online daily – compared to 59% in 2020, 43% in 2017, and 17% in 2012
“The percentage of households getting an Internet service at home, including high-speed broadband, is higher than in any previous year,” said Bruce Leichtman, president and principal analyst for Leichtman Research Group, Inc. “Computer usage and knowledge remain the foundation for Internet services in the home. Among those that do not get an Internet service at home, 58% also do not use a computer at home..”
References:
https://broadbandmap.fcc.gov/home
https://www.leichtmanresearch.com/90-of-u-s-households-get-an-internet-service-at-home/
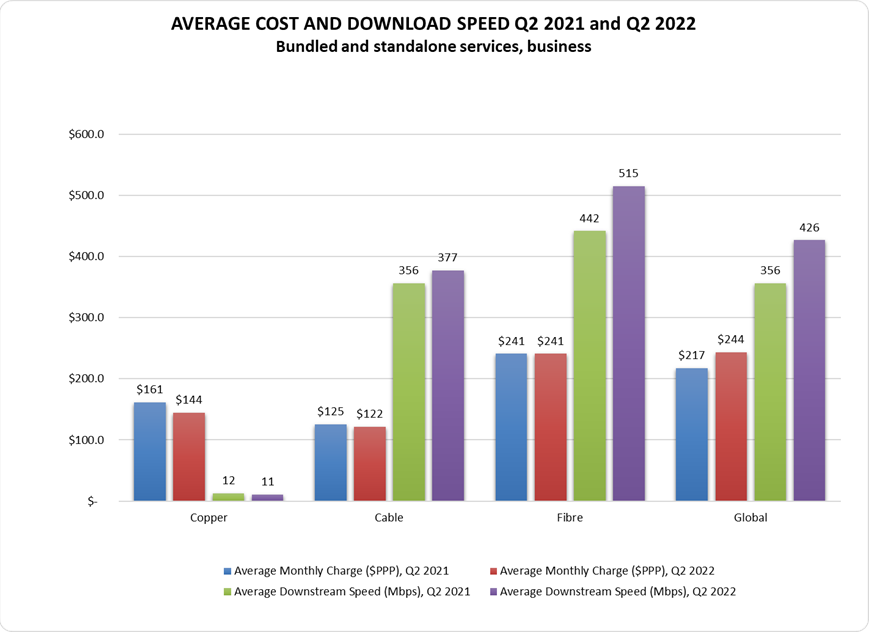
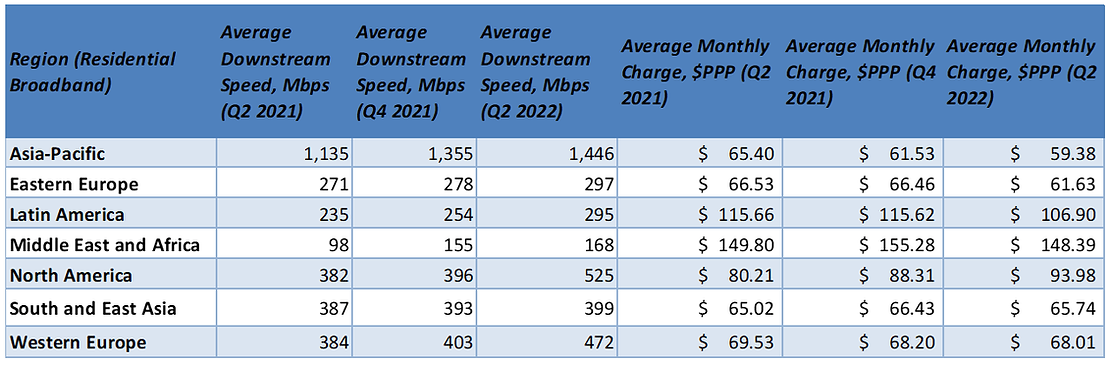
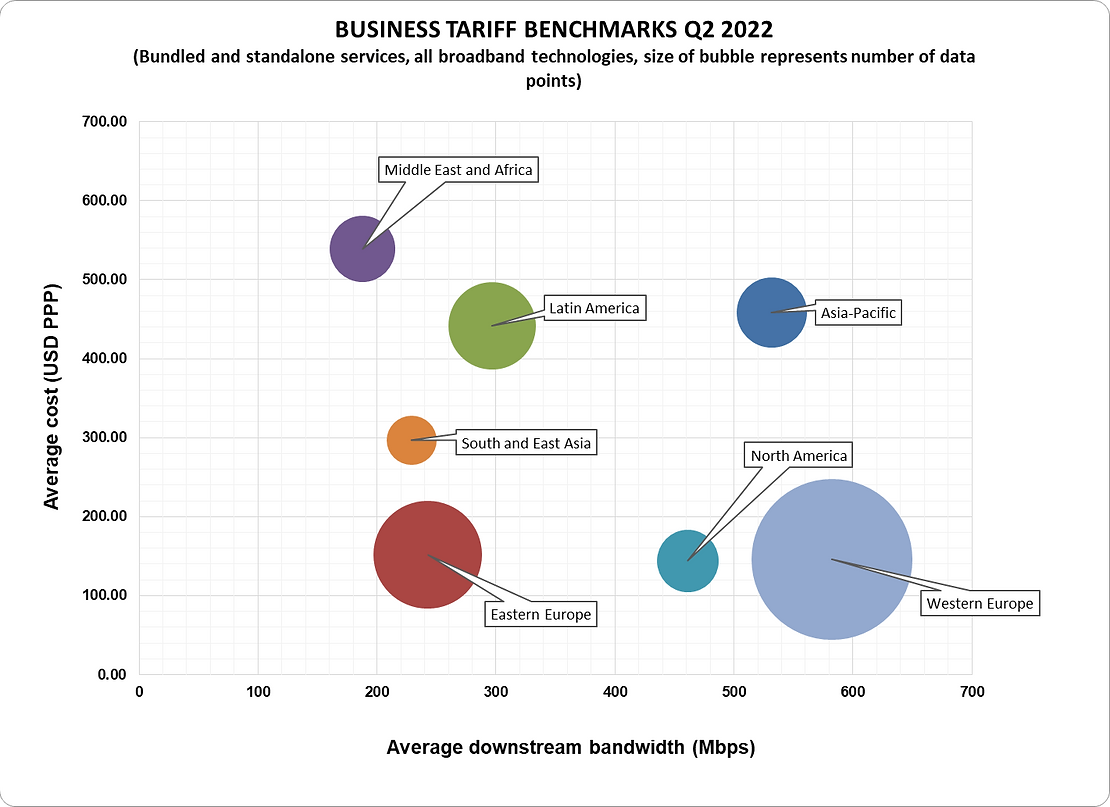
Point Topic: Global Broadband Tariff Benchmark Report- 2Q-2022
In the twelve months to the close of Q2 2022, global residential fixed line broadband subscribers saw their average monthly charges decrease by 4% on copper, cable and fiber-based tariffs. Across the three technologies the average bandwidth increased by 22% year-on-year (y-o-y), due to the increased innovation and proliferation of fiber-based networks globally. Business subscribers continued to struggle with rising monthly charges, with the average monthly charge increasing by 12% and the average downstream speed standing at 426 Mbps compared to residential tariff averages of 464 Mbps.
The Asia-Pacific region retained its dominant bandwidth position with average speeds of 1,146 Mbps, up from 1,355 Mbps in Q4 2021 and 1,135 Mbps y-o-y, followed by North America, Western Europe, and Southeast Asia with the three regions reaching a combined average of around 465 Mbps.
Qatar, Switzerland and Southeast Asian countries still remain at the top of the league by average bandwidth along Italy, France and Bulgaria; these countries all rank in the top ten cheapest for residential broadband in terms of average cost per Mbps being less than $0.10 PPP.


In Q2 2022, the combined average download bandwidth grew by 20% compared to Q2 2021 and stood at 426 Mbps. This was caused by the boost in the average speed over cable and especially fibre, 14% and 22% respectively. Copper maintained largely the same average download speed compared to the previous quarter. However, the overall global average monthly cost across the three technologies has increased by just over 12% from $217 PPP to $244 PPP at the close of Q2 2022


References:
Global Broadband Tariff Benchmark Report, Q2 2022 (point-topic.com)
Point Topic: Global fixed broadband connections up 1.7% in 1Q-2022, FTTH at 58% market share
Global fixed access broadband subscribers reached nearly 1.3 billion at the end of Q1 2022, up by 1.7 percent from the previous quarter, according to the latest figures from Point Topic. The market research firm said the number of connections increased in 90 percent of the 131 countries researched, including the 20 largest markets. The global growth rate remains slightly less than a year ago.
For the first time ever, Fiber to the Home (FTTH) connections were more than half of all fixed broadband connections. Indeed, the share of FTTH in the total fixed broadband subscriptions continued to increase to 58 percent at the end of March 2022. Cable broadband connections were the next most common technology with a 17 percent share, while connections over all other technologies lost market shares to fibre. Compared to the end of 2021, FTTH connections increased 13.5 percent, while copper broadband lines were down 9.8 percent.
Main trends in Q1 2022:
-
Fixed broadband subscriber numbers grew in 90 per cent of the 131 countries covered in this report.
-
The share of FTTH in the total fixed broadband subscriptions continued to increase and stood at 58 per cent. Superfast and ultrafast cable broadband connections followed with an 17 per cent share. Connections over all other technologies lost market shares to fibre.
-
Between Q1 2022 and Q4 2021, the number of copper lines fell by 9.8 per cent, while FTTH connections increased by 13.5 per cent.
-
China added 14 million, Brazil 1.1 million and France a million fibre broadband subscriptions.

In Q1 2022, the quarterly fixed broadband subscriber growth rate stood at 1.7 per cent, with the number of connections reaching 1.3 bn (Figures 1 and 2). Similarly to Q4 2021, the growth rate was slightly lower than in the respective quarter a year ago.


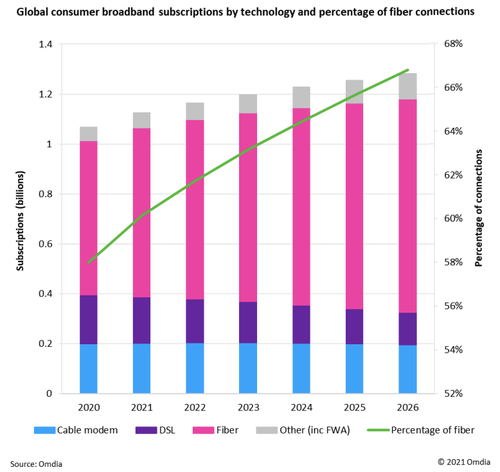
Omdia: Big increase in Gig internet subscribers in 2022; Top 25 countries ranked by Cable
Global gigabit internet subscriptions are expected to increase to 50 million in 2022, more than doubling from 24 million at the end of 2020, according to a new report from market research firm Omdia (owned by Informa).
The Omdia report states that accelerated fiber deployments are helping to drive an increase in gigabit connectivity.
“Demand for reliable broadband is set to drive growth in gigabit services, with fiber playing a key role,” said Peter Boyland, principal analyst, broadband at Omdia.
“There were fewer than 620 million fiber subscriptions globally at the end of 2020, but we expect these to grow to 719 million in 2022, or 62% of total subscriptions.” The majority of fiber internet subscribers are expected to be in China.
However, Omdia warns that service providers must “carefully consider market demand” for their gigabit strategies and make targeted investments in fiber.
“Service providers need to carefully plan and execute gigabit network rollout, analyzing a number of factors, including infrastructure challenges, market competition, and expected demand,” writes Omdia. “But this does not stop with network rollout – operators need to continually monitor potential competitors and constantly innovate, refresh, and build service offerings so they stay ahead of rivals.”
The analysts also point out the opportunity for vendors in the market who can help service providers build “future proof” networks. “Vendors can offer long-term solutions such as monitoring and automation tools to extend the operator/vendor relationship beyond network rollouts,” the report recommends.
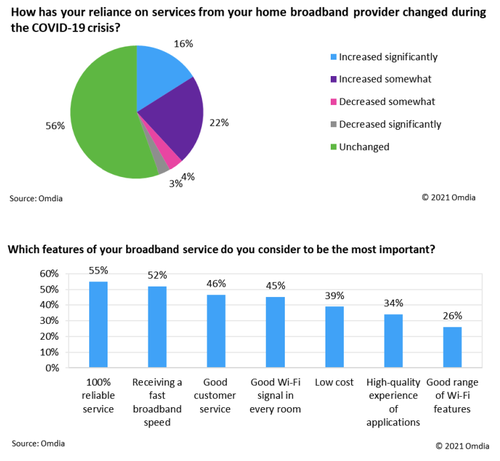
Of course, what matters most to consumers is reliable service. According to Omdia’s Digital Consumer Insights survey, 36% of respondents said they were more reliant on broadband services during COVID-19, and 55% of respondents said reliability ranked top among the most important home broadband features.
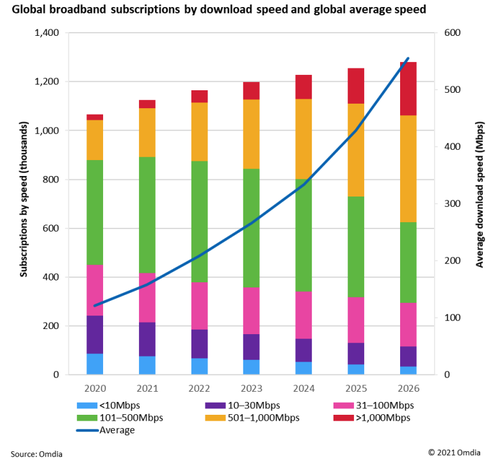
All of this gigabit and fiber growth will impact broadband speeds for years to come. According to Omdia:
“In 2020, just 2% of broadband subscriptions were more than 1Gbps, but this is expected to double to 4% in 2022.”
–>See table below for the 25 countries with the fastest AVERAGE internet speeds, ranked by Cable. Note that none of them is close to 1Gbps.
The report says that subscribers with access to 500 Mbit/s-1 Gbit/s will increase from 15% in 2020 to 21% in 202, with 17% of broadband subscriptions projected to reach speeds over 1 Gbit/s by 2026.
While high-bandwidth entertainment like augmented and virtual reality (AR/VR) and gaming were thought to be the main drivers for ever-faster home broadband speeds in pre-pandemic times, Omdia’s report doesn’t think they are significantly important for gigabit Internet growth, referring to them just once as “other drivers.”
……………………………………………………………………………………………
Internet comparison site Cable has ranked the countries with the fastest broadband internet in the world based on over 1.1 billion speed tests across 224 countries and territories.
“The acceleration of the fastest countries in the world has finally plateaued this year as they reach FTTP pure fibre saturation. Increases in speed among the elite performers, then, can be attributed in greater part to uptake in many cases than to network upgrades. Meanwhile, though the countries occupying the bottom end of the table still suffer from extremely poor speeds, 2021’s figures do indicate that the situation is improving,” said Dan Howdle of Cable.
Here are the 25 countries with the fastest download speeds:
| 1 | Jersey | JE | WESTERN EUROPE | 274.27 |
| 2 | Liechtenstein | LI | WESTERN EUROPE | 211.26 |
| 3 | Iceland | IS | WESTERN EUROPE | 191.83 |
| 4 | Andorra | AD | WESTERN EUROPE | 164.66 |
| 5 | Gibraltar | GI | WESTERN EUROPE | 151.34 |
| 6 | Monaco | MC | WESTERN EUROPE | 144.29 |
| 7 | Macau | MO | ASIA (EX. NEAR EAST) | 128.56 |
| 8 | Luxembourg | LU | WESTERN EUROPE | 107.94 |
| 9 | Netherlands | NL | WESTERN EUROPE | 107.30 |
| 10 | Hungary | HU | EASTERN EUROPE | 104.07 |
| 11 | Singapore | SG | ASIA (EX. NEAR EAST) | 97.61 |
| 12 | Bermuda | BM | NORTHERN AMERICA | 96.54 |
| 13 | Japan | JP | ASIA (EX. NEAR EAST) | 96.36 |
| 14 | United States | US | NORTHERN AMERICA | 92.42 |
| 15 | Hong Kong | HK | ASIA (EX. NEAR EAST) | 91.04 |
| 16 | Spain | ES | WESTERN EUROPE | 89.59 |
| 17 | Sweden | SE | WESTERN EUROPE | 88.98 |
| 18 | Norway | NO | WESTERN EUROPE | 88.67 |
| 19 | France | FR | WESTERN EUROPE | 85.96 |
| 20 | New Zealand | NZ | OCEANIA | 85.95 |
| 21 | Malta | MT | WESTERN EUROPE | 85.20 |
| 22 | Estonia | EE | BALTICS | 84.72 |
| 23 | Aland Islands | AX | WESTERN EUROPE | 81.31 |
| 24 | Canada | CA | NORTHERN AMERICA | 79.96 |
| 25 | Belgium | BE | WESTERN EUROPE | 78.46 |
It is the fourth year of the assessment and the latest ranking uses data collected in the 12 months up to 30th June 2021 to evaluate internet speed by country.
References:
https://www.cable.co.uk/broadband/speed/worldwide-speed-league/
Dell’Oro: PON ONT spending +15% Year over Year
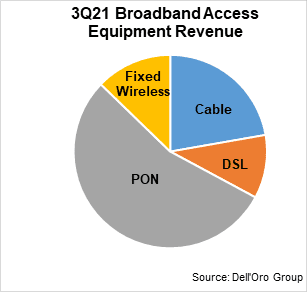
According to a newly published report by Dell’Oro Group, total global revenue for the Broadband Access equipment market increased to $3.9 B in 3Q 2021, up 7% year-over-year (Y/Y). Growth came from spending on both PON infrastructure and fixed wireless CPE. Please see chart below.
“5G fixed wireless deployments joined fiber as the primary drivers for spending this quarter,” noted Jeff Heynen, Vice President, Broadband Access and Home Networking at Dell’Oro Group. “Despite supply chain constraints and increased costs, operators continue to focus on expanding broadband connectivity,” explained Heynen.
Additional highlights from the 3Q 2021 Broadband Access and Home Networking quarterly report:
- Total cable access concentrator revenue decreased 27 percent Y/Y to $257 M. There was a clear mix shift this quarter to remote PHY and remote MACPHY devices, both of which saw Y/Y revenue increases.
- Total PON ONT unit shipments reached 32 M units, marking the fourth quarter in row-unit shipments have exceeded 30 M globally.
- Component shortages are clearly impacting cable CPE and home networking device sales, with unit shipments down markedly Y/Y.
The Dell’Oro Group Broadband Access and Home Networking Quarterly Report provides a complete overview of the Broadband Access market with tables covering manufacturers’ revenue, average selling prices, and port/unit shipments for Cable, DSL, and PON equipment. Covered equipment includes Converged Cable Access Platforms (CCAP) and Distributed Access Architectures (DAA); Digital Subscriber Line Access Multiplexers ([DSLAMs] by technology ADSL/ADSL2+, G.SHDSL, VDSL, VDSL Profile 35b, and G.FAST); PON Optical Line Terminals (OLTs), Cable, DSL, and PON CPE (Customer Premises Equipment); and SOHO WLAN Equipment, including Mesh Routers. For more information about the report, please contact [email protected].
Separately, Dell’Oro reports that the worldwide Campus Switch market revenue reached a record level in 3Q 2021. Growth was mostly propelled by 1 Gbps, which reached a record level in shipments during the quarter, while Ethernet NBase-T ports were down Y/Y.
“We have been predicting the demand in the market to remain strong, but what surprised us is the level of shipments and revenues that vendors were able to achieve during the quarter, despite ongoing supply challenges,” said Sameh Boujelbene, Senior Director at Dell’Oro Group. “It appears, however, that these supply challenges are impacting the newer technologies more than the older ones, due to a less diversified ecosystem, and in some cases, a less mature supply chain,” added Boujelbene.
Additional highlights from the 3Q 2021 Ethernet Switch – Campus Report:
- Extreme, HPE, and Juniper each gained more than one point of revenue share in Europe, Middle East and Africa (EMEA)
- H3C outperformed the market and captured the revenue leading position in China
- Power-over-Ethernet (PoE) ports up strong double-digits and comprised 30 percent of the total ports
The Dell’Oro Group Ethernet Switch – Campus Quarterly Report offers a detailed view of Ethernet switches built and optimized for deployment outside the data center, to connect users and things to the Local Area Networks. The report contains in-depth market and vendor-level information on manufacturers’ revenue, ports shipped and average selling prices for both Modular and Fixed, and Fixed Managed and Unmanaged Ethernet Switches (100 Mbps, 1, 2.5, 5, 10, 25, 40, 50, 100 Gbps), Power-over-Ethernet, plus regional breakouts as well as split by customer size (Enterprise vs. SMB) and vertical segments. To purchase these reports, please contact us by email at [email protected].
About Dell’Oro Group
Dell’Oro Group is a market research firm that specializes in strategic competitive analysis in the telecommunications, networks, and data center IT markets. Our firm provides in-depth quantitative data and qualitative analysis to facilitate critical, fact-based business decisions. For more information, contact Dell’Oro Group at +1.650.622.9400 or visit www.delloro.com.
References:
Leichtman Research Group: U.S. broadband growth returns to pre-pandemic levels in Q3-2021
Leichtman Research Group, Inc. (LRG) found that the largest cable and wireline phone providers in the U.S. – representing about 96% of the market – acquired about 630,000 net additional broadband Internet subscribers in 3Q 2021, compared to a pro forma gain of about 1,525,000 subscribers in 3Q 2020, about 615,000 in 3Q 2019, and about 600,000 in 3Q 2018.
These top broadband providers now account for about 107.9 million subscribers, with top cable companies having about 75.2 million broadband subscribers, and top wireline phone companies having about 32.7 million subscribers.
Findings for the 3rd /quarter include:
- Overall, broadband additions in 3Q 2021 were 41% of those in 3Q 2020
- The top cable companies added about 590,000 subscribers in 3Q 2021 – 45% of the net additions for the top cable companies in 3Q 2020
- The top wireline phone companies added about 40,000 total broadband subscribers in 3Q 2021 – compared to about 200,000 net adds in 3Q 2020. Telcos had about 475,000 net adds via fiber in 3Q 2021, and about 435,000 non-fiber net losses
“Broadband additions returned to pre-pandemic levels in the third quarter of 2021,” said Bruce Leichtman, president and principal analyst for Leichtman Research Group, Inc. “The top broadband providers added significantly fewer subscribers than in last year’s third quarter, but had a similar number of net adds as in 3Q 2019 and 3Q 2018.”
| Broadband Providers/ | Subscribers at end of 3Q 2021// | Net Adds in 3Q 2021/ |
| Cable Companies | ||
| Comcast | 31,688,000 | 300,000 |
| Charter | 29,899,000 | 265,000 |
| Cox* | 5,510,000 | 25,000 |
| Altice | 4,388,100 | (13,200) |
| Mediacom | 1,466,000 | (2,000) |
| Cable One | 1,030,000 | 13,000 |
| Atlantic Broadband^ | 717,000 | 3,000 |
| WOW (WideOpenWest)^ | 509,500 | 1,600 |
| Total Top Cable | 75,207,600 | 592,400 |
| Wireline Phone Companies | ||
| AT&T | 15,510,000 | 29,000 |
| Verizon^^ | 7,337,000 | 74,000 |
| CenturyLink/Lumen | 4,589,000 | (77,000) |
| Frontier | 2,789,000 | (9,000) |
| Windstream | 1,147,000 | 15,200 |
| TDS | 522,800 | 9,200 |
| Cincinnati Bell* | 439,000 | 1,200 |
| Consolidated | 390,661 | (2,819) |
| Total Top Telco | 32,724,461 | 39,781 |
References:
Cable broadband subscriber growth slows while FTTx and FWA gain ground
Cable network operators (cablecos or MSOs) are losing ground to FTTP/FTTx (fiber to the premises/ cabinet/ home) and FWA (fixed wireless access).
- Bloomberg reports that cable broadband growth is sputtering and no one knows why.
- GlobalData agrees, but forecasts a solid increase in U.S. fixed-broadband lines.
Broadband internet subscriber growth at Comcast Corp. and Charter Communications Inc has decreased, raising concerns about an end to what has been a huge growth business, with explanations ranging from a slowdown in consumer spending to competition from phone giants.
Charter on Friday reported 25% fewer new broadband subscribers than analysts estimated and said the overall number of new customers would fall back to 2018 levels. Charter had 1.27 million new broadband customers in 2018 compared with 2.2 million last year. Analysts predict it will add 1.4 million subscribers this year, according to estimates compiled by Bloomberg.
Comcast, which had earlier cut its subscriber forecast, reported 300,000 new internet customers Thursday, less than half the number added a year ago.
Analysts were expecting some slowdown in demand coming off 2020, a year when broadband sign-ups spiked as the pandemic shifted people to working and schooling from home. Still, with Charter echoing Comcast’s gloomy picture from Thursday, suddenly there’s a chill on the cable broadband front, which became the most prized segment of the business as consumers cut traditional TV service.
Charter’s shortfall raises “questions about whether this is the beginning of the end of the cable broadband story,” said Geetha Ranganathan, an industry analyst at Bloomberg Intelligence.
GlobalData forecasts that cable’s share of total U.S. fixed broadband subscriptions will decline to 67.1% by the end of 2026, from 68% in 2021, as other technologies such as fiber and fixed wireless expand their presence. Total U.S. fixed-broadband lines, including fiber, fixed wireless and cable, will increase from 103.1 million in 2021 to 112.3 million by 2026 says the market research firm.
No one has been able to identify the exact reason why the wind has gone out of the sails for big cable. Both Charter and Comcast blamed a slower new home market for some of the slack in demand, leaving the companies to try and squeeze more business out of their saturated markets. Other factors could include a drop off in lower-paying customers as government assisted broadband funds dry up.
Even as Comcast and Charter deploy new faster network technology to attract more lucrative customers, cable’s share of the market is starting to shrink, according to Tammy Parker, a senior analyst with GlobalData.
Total U.S. broadband lines will increase to 112.3 million by the end of 2026 from 103.1 million in 2021, including new wireless internet customers, the market research firm predicts.
The number of U.S. fiber lines will grow at a CAGR of 10.8% to reach 28.2 million lines by the end of 2026. This growth will be due to rising demand for high-speed internet services in the nation, and efforts by the government and operators to expand FTTx networks.
References:
https://www.telecomlead.com/broadband/number-of-us-fiber-lines-to-reach-28-2-mn-by-2026-102290
