LightCounting
LightCounting: Q1 2024 Optical Network Equipment market split between telecoms (-) and hyperscalers (+)
As has been the trend for the past several quarters, Q1 2024 results for the optical communications market were sharply split between very weak sales in the telecom segment (Communications Service Providers or CSPs) and continued strong demand by the hyperscalers (cloud giants). The combined capex of the Top 15 CSPs declined year-over-year for the sixth quarter in a row, while the Top 15 ICPs spending grew for the second quarter in a row, paced by Alphabet (+91%) and Microsoft (+66%). Chinese ICPs spending also increased dramatically, suggesting the AI boom is hitting China too.
LightCounting: Silicon Photonics chip market to hit $3 billion in 2029

Highlights of LightCounting’s December 2023 Quarterly Market Update on Optical Networking
LightCounting’s Quarterly Market Update report [1.] for Q3 2023 revealed that the optical communications industry financial results were disappointing.
Every financial market indicator that the market research firm tracks – ICP (Integrated Communications Provider) and CSP (Communications Service Provider) capex, datacom and networking equipment, and semiconductor (x-Nvidia) and optical components sales – all had negative growth compared to Q3 2022.
Note 1. LightCounting’s Quarter Market Update reports are designed to provide an easy-to-digest snapshot of optical transceiver growth trends, backed up by detailed quarter-by-quarter sales data collected via LightCounting’s proprietary vendor survey. Performance metrics and commentary for top-tier telecom and internet service providers, network and datacom equipment makers, and optical component and semiconductor vendors are also included to provide an understanding of what drives sales trends at the transceiver level.
- Alphabet and Microsoft had record capital expenditures.
- Arista, Broadcom, Calix, Innolight, and Nvidia all reported record revenues.
LightCounting is projecting, based on its current analysis, that sales increased in Q3 and will increase further in Q4, to a new record high, as shown in the figure below. This data includes estimates for 400G and 800G transceivers manufactured by Nvidia internally.
The expectation of growth in Q4 carries over to 2024 as well and is consistent with the guidance given by several companies ranging from Alphabet and Amazon to Coherent and Lumentum. The big caveat is that growth in 2024 will be tightly focused on AI-related infrastructure, and growth in demand for those products is expected to far outstrip demand in other segments like traditional telco and enterprise networks. Most of the growth in the optical components and modules market will come from sales of 800G transceivers.
References:
https://www.lightcounting.com/report/december-2023-quarterly-market-update-199
LightCounting: Will Network Transformation resolve telecom’s paradox?
Industry Analysts: Important Optical Networking Trends for 2023
MTN Group and NEC XON deploy Africa’s first 400G optical transponder using TIP’s Phoenix
LightCounting: Wireless infrastructure market down in 2Q-23 (no surprise)
| Historical data accounts for sales of the following vendors: | |||
| Vendor | Segments | Source of Information | |
| Altran | vRAN | Estimates | |
| Amdocs | 5GC | Estimates | |
| ASOCS | vRAN (DU) | None, supplies other RAN/vRAN vendors | |
| Baicell | RAN (RU) | None, supplies other RAN/vRAN vendors | |
| Benetel | Open RAN (RU) | None, supplies other RAN/vRAN vendors | |
| Cisco | EPC, vEPC, 5GC | Survey data and estimates | |
| China Information and Communication Technologies Group (CICT) | RAN | Estimates | |
| Comba Telecom | RAN/vRAN (RU) | None, supplies other RAN/vRAN vendors | |
| CommScope (acquired Phluido vRAN patents, October 2020) | vRAN (RU, DU) | Estimates | |
| Corning | vRAN | Estimates | |
| Dell | vRAN (DU) | None, supplies other RAN/vRAN vendors | |
| Enea | 5GC | Estimates | |
| Ericsson | RAN, vRAN, 2/3G Core, EPC, vEPC, 5GC | Estimates | |
| Fairwaves | RAN/vRAN (RU) | None, supplies other RAN/vRAN vendors | |
| Fujitsu | RAN | Survey data and estimates | |
| HPE | 2G/3G core, 5GC | Estimates | |
| Huawei | RAN, vRAN, 2/3G Core, EPC, vEPC, 5GC | Survey data and estimates | |
| JMA Wireless | vRAN | Estimates | |
| KMW | RAN/vRAN (RU) | None, supplies other RAN/vRAN vendors | |
| Kontron | vRAN (DU) | None, supplies other RAN/vRAN vendors | |
| Mavenir (acquired ip.access, September 2020) | vEPC, vRAN, 5GC | Survey data and estimates | |
| Microsoft (acquired Metaswitch and Affirmed Networks, 2020) | 5GC, vEPC and 2G/3G core | Estimates | |
| Movandi | RAN/vRAN (RU/repeater) | Estimates | |
| MTI Mobile | vRAN (RU) | None, supplies other RAN/vRAN vendors | |
| Node-H | vRAN (small cells) | Estimates | |
| Nokia | RAN, vRAN, 2/3G Core, EPC, vEPC, 5GC | Survey data and estimates | |
| NEC (including Blue Danube Systems, January 2022) | RAN, vRAN (RU), EPC, 5GC | Survey data and estimates | |
| Oracle | 5GC | Estimates | |
| Parallel Wireless | vRAN (CU, DU) | Estimates | |
| Pivotal | RAN/vRAN (RU/mmWave repeater) | Estimates | |
| Quanta Cloud Technology (QCT) | vRAN (DU) | None, supplies other RAN/vRAN vendors | |
| Qucell | RAN, vRAN | Estimates | |
| Rakuten Symphony (acquired Altiostar, August 2021) | vRAN (CU, DU) | Estimates | |
| Ribbon Communications | 2G/3G core | Survey data and estimates | |
| Samsung | RAN, vRAN, vEPC, 5GC | Estimates | |
| Silicom | Open RAN (DU) | None, supplies other RAN/vRAN vendors | |
| SuperMicro Computer | vRAN (DU) | None, supplies other RAN/vRAN vendors | |
| Verana Networks | RAN/vRAN (RU/mmWave) | Estimates | |
| ZTE | RAN, vRAN, 2/3G Core, EPC, vEPC, 5GC | Survey data and estimates | |
LightCounting: Will Network Transformation resolve telecom’s paradox?
|
Christel Heydemann, the CEO of Orange, used her MWC ’23 keynote to highlight the paradox of the telecom market: telecom is a critical enabler of our digital future, yet a 2022 PwC report stated that nearly half (46%) of the global telecom CEOs surveyed thought their companies won’t survive another decade (the average figure for all industries surveyed was 39%). PwC cited the reason as telecoms’ poor record making money from technology.
Telecoms is a profitable business, yet competition and regulation are hampering its growth. Telecoms spends eye-watering amounts in investment – European CSPs alone are estimated to have spent $650 billion on technology in the last decade – yet the industry is one of the worse at getting a return on the investment.
|
 |
|
Much of the spend has been on implementing the 5G wireless standard. 5G may be much vaunted by the CSPs but its impact is yet to be felt. That is because the wireless standard as envisaged is still to be implemented. What has been rolled out since 2019 is 5G non-standalone (NSA): a 4G networking/ 5G radio hybrid. It is 5G Standalone (5G SA) that delivers the tools other industries can benefit from: low latency wireless networking and clever network segmentation in the form of slicing.
Overall, some 40 CSPs had deployed 5G SA by the start of 2023, a small fraction of overall 5G deployments. Yet if 5G SA is what will grow revenues via the digitalization programs of different sectors, should there not be a greater urgency to deploy it?
The CSPs also must transform their businesses, their organizations, their staff development, address sustainability, and embrace a development that promises huge returns; artificial intelligence (AI).
Telecoms is built on the engineering disciplines of communications and computing and the CSPs have strong engineering teams. How can CSPs, that want to serve other industries in their digital transformation journeys, be so far behind when it comes to AI? Another paradox.
Network transformation’s impact on the future of the CSPsWhat will be the impact of network transformation and transformation in general on the future of the CSPs?
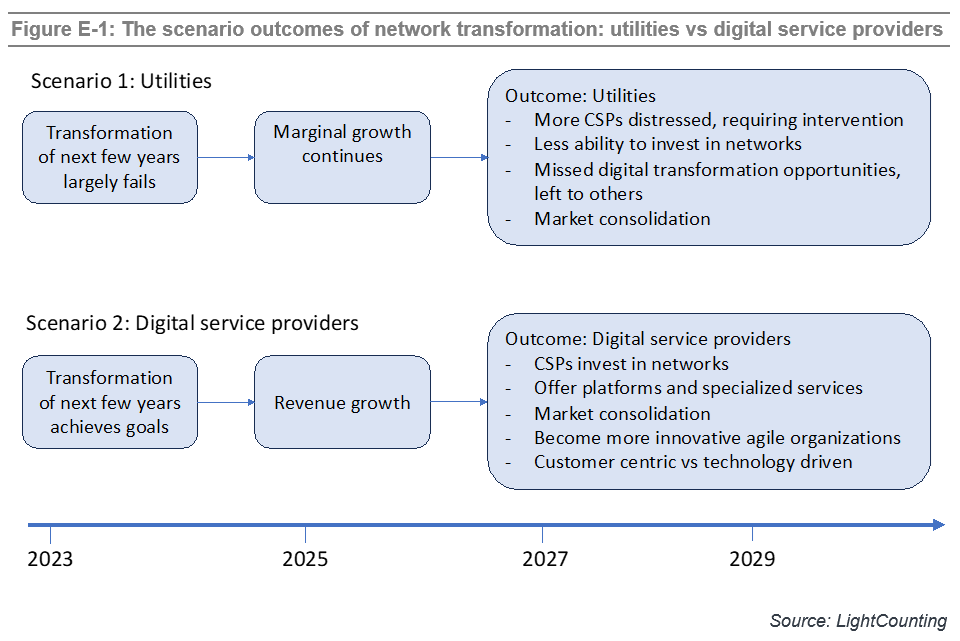
In the latest Network Transformation report, LightCounting defines two scenarios that bound the possible outcomes: Scenario 1 is where CSPs become utilities while Scenario 2 sees CSPs transform into Digital Service Providers.
In Scenario 1, dubbed Utilities, the transformation efforts fail to create the revenue growth needed nor enable the CSPs long-term aspirations to become digital service providers. The CSPs continue as businesses but are consigned to the infrastructure provider layer delivering connectivity services, limiting their ability to invest in their networks. They may still be ongoing businesses but will miss the digitalization opportunities thus bounding their business prospects.
Scenario 2, dubbed Digital Service Providers, is that network transformation achieves its goals. Successful network transformation will allow CSPs to play not only as infrastructure/ connectivity players but as platform providers and specialists addressing vertical markets.
LightCounting believes that some CSPs will be successful and become digital service providers. They will be able to acquire their less successful competitors, further improving scale of their business. Large scale will be very critical for the success of CSPs and their ability to compete with ICPs in offering new services.
Anti-monopoly regulators will have to find the right balance to limit the scale of CSPs, while letting them prosper. It is the huge success of ICPs which attracts attention of the regulators now. It is long overdue. Curbing the scale of ICP monopolies will also help CSPs to sustain their business, but they still need to transform themselves. The recent revelation that Amazon wants to bundle a phone service offering as part of Amazon Prime shows how vulnerable the CSPs are.
LightCounting defined this period as pivotal for the CSPs in last year’s network transformation report. One year on, this remains the case although what is at stake is clearer. We see more determination among CSPs to transform into digital service providers of the future. There is no viable alternative.
More information about the report is available at: Network Transformation
References:
|
LightCounting: Wireless infrastructure market dropped both YoY and sequentially in 1Q23
In the 1stQ2023, the global wireless infrastructure market declined 3% YoY and 17% sequentially, according to LightCounting. Starting a new year with a sequential decline is typical but a YoY drop is abnormal and suggests a declining pattern is in the making. This trend confirms that we have entered the post-peak era.
While the U.S. market posted its steepest drop, the strong 5G rollouts in India and a 5G rebound in Japan, along with stable and sustained activity in EMEA and China, respectively, were not enough to keep the wireless infrastructure market out of the decline. On the open vRAN front, DISH in the U.S., Rakuten Mobile in Japan, and a few Rakuten Symphony customers kept the market flat YoY and produced double digit sequential growth.
Despite a weak quarter, Huawei retook its lead at the expense of Ericsson, which reported weak 1Q23 results that led to a market share loss. In the meantime, Nokia benefited from the 2 leaders’ market share loss and gained 1% point. ZTE also gained share at the expense of Huawei and Ericsson while Samsung’s share remained stable.
“We have passed the 5G peak and have entered the second year of a disinvestment cycle. The 5G investment cycle that started in 2019 and ended in 2021 was driven by hundreds of communications service providers (CSPs), including the world’s largest cellular footprints (i.e., China). At the moment, India’s massive 5G rollout is preventing the situation from getting worse but this will end soon,” said Stéphane Téral, Chief Analyst at LightCounting Market Research.
As a result, this year, LightCounting expects the wireless infrastructure market to slightly decline in 2023 (compared to 2022) with India in the lead. In the long run, our service provider 20-year wireless infrastructure footprint pattern analysis points to a 2022-2028 CAGR of -3% characterized by low single-digit declines through 2027, which appears to be the bottom leading to flatness or slight growth in 2028. In fact, we expect 5G to slightly pick up in 2027, driven by upgrades needed to prepare networks for 6G. Given the ongoing 6G activity, we believe something labeled 6G will be deployed in 2028.
Highlights from Dell’Oro’s 1Q 2023 RAN report:
- Top 5 RAN 1Q 2023 RAN suppliers include Huawei, Ericsson, Nokia, ZTE, and Samsung.
- Top 4 RAN 1Q 2023 RAN suppliers outside of China include Ericsson, Nokia, Huawei, and Samsung.
- Nokia recorded the highest growth rate among the top 5 suppliers, while Ericsson and Samsung both lost some ground in the first quarter.
- The report also shows that Nokia’s RAN revenue share outside of China has been trending upward over the past five quarters.
- The Asia Pacific RAN market has been revised upward to reflect the higher baseline in India.
Open RAN and vRAN highlights from Dell’Oro’s 1Q 2023 RAN report:
- After more than doubling in 2022, Open RAN revenue growth was in the 10 to 20 percent range in the first quarter while the vRAN market advanced 20 to 30 percent.
- Positive developments in the Asia Pacific region were dragged down by more challenging comparisons in the North America region.
- Short-term projections remain unchanged – Open RAN is still projected to account for 6 to 10 percent of the 2023 RAN market.
- Top 5 Open RAN suppliers by revenue for the 2Q 2022 to 1Q 2023 period include Samsung, NEC, Fujitsu, Rakuten Symphony, and Mavenir.
| Historical data accounts for sales of the following vendors: | ||
| Vendor | Segments | Source of Information |
| Affirmed Networks (acquired by Microsoft, April 2020) | vEPC, 5GC | Estimates |
| Altran | vRAN | Estimates |
| Altiostar | vRAN (CU, DU) | Estimates |
| Amdocs | 5GC | Estimates |
| ASOCS | vRAN (DU) | None, supplies other RAN/vRAN vendors |
| Baicell | RAN (RU) | None, supplies other RAN/vRAN vendors |
| Benetel | Open RAN (RU) | None, supplies other RAN/vRAN vendors |
| Cisco | EPC, vEPC, 5GC | Survey data and estimates |
| China Information and Communication Technologies Group (CICT) | RAN | Estimates |
| Comba Telecom | RAN/vRAN (RU) | None, supplies other RAN/vRAN vendors |
| CommScope (acquired Phluido vRAN patents, October 2020) | vRAN (RU, DU) | Estimates |
| Corning | vRAN | Estimates |
| Dell | vRAN (DU) | None, supplies other RAN/vRAN vendors |
| Enea | 5GC | Estimates |
| Ericsson | RAN, vRAN, 2/3G Core, EPC, vEPC, 5GC | Estimates |
| Fairwaves | RAN/vRAN (RU) | None, supplies other RAN/vRAN vendors |
| Fujitsu | RAN | Survey data and estimates |
| HPE | 2G/3G core, 5GC | Estimates |
| Huawei | RAN, vRAN, 2/3G Core, EPC, vEPC, 5GC | Survey data and estimates |
| JMA Wireless | vRAN | Estimates |
| KMW | RAN/vRAN (RU) | None, supplies other RAN/vRAN vendors |
| Kontron | vRAN (DU) | None, supplies other RAN/vRAN vendors |
| Mavenir (acquired ip.access, September 2020) | vEPC, vRAN, 5GC | Survey data and estimates |
| Metaswitch (acquired by Microsoft, May 2020) | 5GC, vEPC and 2G/3G core | Estimates |
| Movandi | RAN/vRAN (RU/repeater) | Estimates |
| MTI Mobile | vRAN (RU) | None, supplies other RAN/vRAN vendors |
| Node-H | vRAN (small cells) | Estimates |
| Nokia | RAN, vRAN, 2/3G Core, EPC, vEPC, 5GC | Survey data and estimates |
| NEC (including Blue Danube) | RAN, vRAN (RU), EPC, 5GC | Survey data and estimates |
| Oracle | 5GC | Estimates |
| Parallel Wireless | vRAN (CU, DU) | Estimates |
| Pivotal | RAN/vRAN (RU/mmWave repeater) | Estimates |
| Quanta Cloud Technology (QCT) | vRAN (DU) | None, supplies other RAN/vRAN vendors |
| Qucell | RAN, vRAN | Estimates |
| Ribbon Communications | 2G/3G core | Survey data and estimates |
| Samsung | RAN, vRAN, vEPC, 5GC | Estimates |
| Silicom | Open RAN (DU) | None, supplies other RAN/vRAN vendors |
| SuperMicro Computer | vRAN (DU) | None, supplies other RAN/vRAN vendors |
| Verana Networks | RAN/vRAN (RU/mmWave) | Estimates |
| ZTE | RAN, vRAN, 2/3G Core, EPC, vEPC, 5GC | Survey data and estimates |
LightCounting: Sales of Optical Transceivers will decline in 2023
|
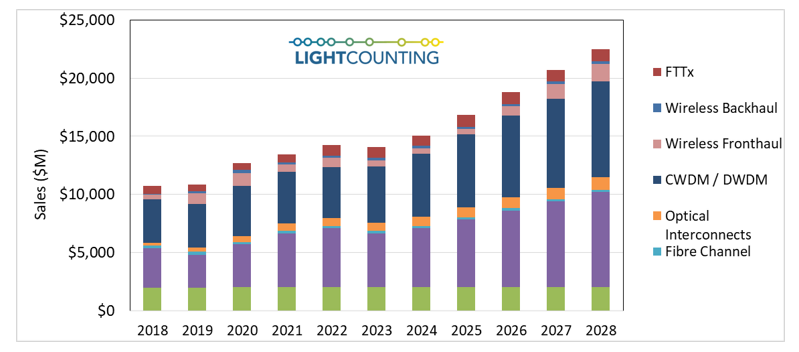
The optical communications industry entered 2020 with very strong momentum. Demand for DWDM, Ethernet, and wireless fronthaul connectivity surged at the end of 2019, and major shifts to work-at-home and school-at-home in 2020 and 2021 due to the COVID-19 pandemic created even stronger demand for faster, more ubiquitous, higher reliability networks. While supply chain disruptions continued, the industry was able to largely overcome them, and the market for optical components and modules saw strong growth in 2020-2022, as shown the figure in below.
We believe the optical transceiver market will be down slightly (1% or so) in 2023 due to declines in the sales of Ethernet and wireless fronthaul transceivers of 10% and 30%, respectively, offsetting growth in all other market segments in 2023.
|
 |
|
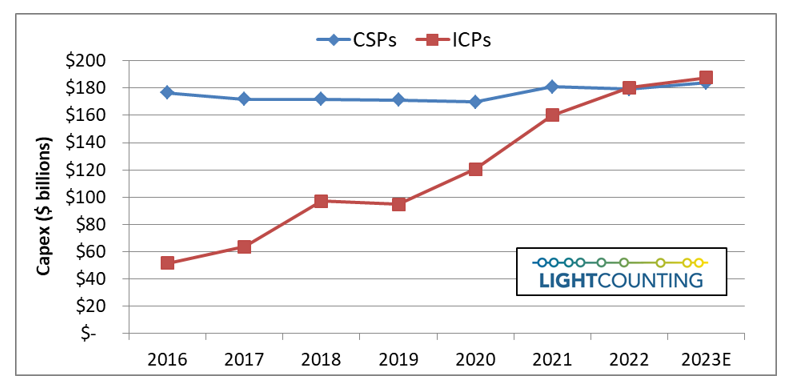
Amazon and other cloud companies plan to moderate their investments in 2023 and beyond, even if there is no economic recession. The Cloud companies benefited from the COVID-19 pandemic, but they were forced to reassess their plans at the end of 2022, as growth slowed. Their capex almost doubled between 2019 and 2022 but future investments will be more conservative. We expect the Top 15 ICP’s capex to be up only 4% in 2023, essentially flat, after several years of double-digit growth. Investments in AI infrastructure will remain a priority.
Telecom service providers plan to reduce their capex in 2023 also but they will continue to upgrade access networks. Connecting business and consumers to the Cloud is a priority now. Their customers are willing to pay more for secure and low-latency broadband services and it is a great opportunity for revenue growth. Telecom service providers plan to digitize their operations and offer Network-as-a-Service (NaaS) to an increasing number of end users, not just a few of their largest customers.
|
 |
|
Despite a slower than expected growth in revenues of the leading Cloud companies, AI infrastructure remains a priority. This new focus will sustain the market for high bandwidth and low latency Ethernet and InfiniBand switches in the next 5 years. We also expect the deployments of optical circuit switches in AI clusters to expand beyond Google’s datacenters.
Other notable forecast changes include increased sales of 50G and 100G fronthaul transceivers in the 2026-2028 timeframe, as we believe they will be needed for early 6G deployments, and increased sales of PON optics as deployments of FTTx are increasing due to government stimulus in the US and elsewhere.
LightCounting’s Market Forecast Report presents our forecast for optical transceivers used in the telecom and datacom sectors, and includes chapters reviewing the health and spending outlook for both CSPs and ICPs, as well as explanations of forecast drivers and assumptions for each of the six product segments covered: Ethernet, WDM, Fronthaul, Backhaul, FTTX, and Optical Interconnects. The accompanying Excel database includes unit and sales forecasts for over 200 product categories.
More information on the report is available at ttps://www.lightcounting.com
|
LightCounting: 1H-2022 Wireless Infrastructure softness lingered in 3Q-2022
by Stéphane Téral, Chief Analyst at LightCounting Market Research
3Q22 was almost a carbon copy of 2Q22, which signals that the 5G-driven wireless infrastructure market is reaching its peak as the first wave of 5G rollouts wane.
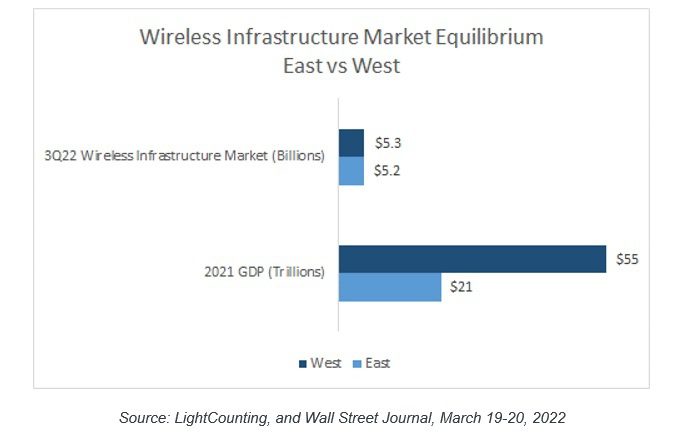
Global uncertainties, lingering supply chain constraints, and forex headwinds contributed to another soft 3Q22 that followed an already sluggish 1H22. In the meantime, the wireless infrastructure market continued to operate at its equilibrium reached in 2021: the 2 opposite spheres of influence, the East led by China versus the West defined as the U.S. and its allies, are becoming more balanced.
We found that the West accounted for 50.5% of the global wireless infrastructure market while the East made up for the rest, with China accounting for more than 80% of the East.
| Historical data accounts for sales of the following vendors: | |||
| Vendor | Segments | Source of Information | |
| Affirmed Networks (acquired by Microsoft, April 2020) | vEPC, 5GC | Estimates | |
| Altran | vRAN | Estimates | |
| Altiostar | vRAN (CU, DU) | Estimates | |
| Amdocs | 5GC | Estimates | |
| ASOCS | vRAN (DU) | None, supplies other RAN/vRAN vendors | |
| Baicell | RAN (RU) | None, supplies other RAN/vRAN vendors | |
| Benetel | Open RAN (RU) | None, supplies other RAN/vRAN vendors | |
| Cisco | EPC, vEPC, 5GC | Survey data and estimates | |
| China Information and Communication Technologies Group (CICT) | RAN | Estimates | |
| Comba Telecom | RAN/vRAN (RU) | None, supplies other RAN/vRAN vendors | |
| CommScope (acquired Phluido vRAN patents, October 2020) | vRAN (RU, DU) | Estimates | |
| Corning | vRAN | Estimates | |
| Dell | vRAN (DU) | None, supplies other RAN/vRAN vendors | |
| Enea | 5GC | Estimates | |
| Ericsson | RAN, vRAN, 2/3G Core, EPC, vEPC, 5GC | Estimates | |
| Fairwaves | RAN/vRAN (RU) | None, supplies other RAN/vRAN vendors | |
| Fujitsu | RAN | Survey data and estimates | |
| HPE | 2G/3G core, 5GC | Estimates | |
| Huawei | RAN, vRAN, 2/3G Core, EPC, vEPC, 5GC | Survey data and estimates | |
| JMA Wireless | vRAN | Estimates | |
| KMW | RAN/vRAN (RU) | None, supplies other RAN/vRAN vendors | |
| Kontron | vRAN (DU) | None, supplies other RAN/vRAN vendors | |
| Mavenir (acquired ip.access, September 2020) | vEPC, vRAN, 5GC | Survey data and estimates | |
| Metaswitch (acquired by Microsoft, May 2020) | 5GC, vEPC and 2G/3G core | Estimates | |
| Movandi | RAN/vRAN (RU/repeater) | Estimates | |
| MTI Mobile | vRAN (RU) | None, supplies other RAN/vRAN vendors | |
| Node-H | vRAN (small cells) | Estimates | |
| Nokia | RAN, vRAN, 2/3G Core, EPC, vEPC, 5GC | Survey data and estimates | |
| NEC (including Blue Danube) | RAN, vRAN (RU), EPC, 5GC | Survey data and estimates | |
| Oracle | 5GC | Estimates | |
| Parallel Wireless | vRAN (CU, DU) | Estimates | |
| Pivotal | RAN/vRAN (RU/mmWave repeater) | Estimates | |
| Quanta Cloud Technology (QCT) | vRAN (DU) | None, supplies other RAN/vRAN vendors | |
| Qucell | RAN, vRAN | Estimates | |
| Ribbon Communications | 2G/3G core | Survey data and estimates | |
| Samsung | RAN, vRAN, vEPC, 5GC | Estimates | |
| Silicom | Open RAN (DU) | None, supplies other RAN/vRAN vendors | |
| SuperMicro Computer | vRAN (DU) | None, supplies other RAN/vRAN vendors | |
| Verana Networks | RAN/vRAN (RU/mmWave) | Estimates | |
| ZTE | RAN, vRAN, 2/3G Core, EPC, vEPC, 5GC | Survey data and estimates | |
References:
https://www.lightcounting.com/report/december-2022-wireless-infrastructure-3q22-177
LightCounting: Wireless Infrastructure Market to Grow at 5% in 2021; 8% in 2Q-2021
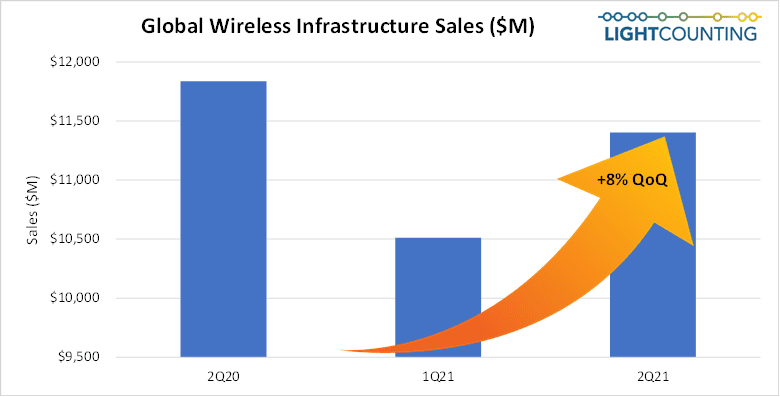
LightCounting says the 2nd quarter of 2021 was robust for the wireless infrastructure market, as a second quarter typically is, but below 2Q20 that was revved up by China’s 5G catch-up after a massive COVID-19 lockdown. The 5G rollout momentum seen in North America, and Northeast Asia reported in 2H-2020 and 1Q-2021 continued in 2Q-2021 and was augmented by strong activity in Europe, and 4G expansion in India.
As a result, the global wireless infrastructure market grew sequentially, driven by RAN, open vRAN—again mostly fueled by Rakuten Mobile’s 5G network buildout, and 5G and 4G core network elements.
“2Q21 was somewhat reminiscent of the golden GSM era and I could not find anyone malcontent as sales of all 4G and 5G network nodes performed magnificently. Regarding the vendors’ market shares, the gradual rise of Ericsson and Nokia was most immediately induced by the fall of Huawei.” said Stéphane Téral, Chief Analyst at LightCounting Market Research.
LightCounting once again had to increase their North American forecast to reflect a strong start in C-band activity and Ericsson’s 5-year $8B 5G contract with Verizon and decrease their Asia Pacific’s 5G forecast due to uncertainties in China and India. As a result, the global wireless infrastructure market’s growth stayed intact at 5% over 2020.
In the long run, factoring in the strong North American 5G activity which is expected to last until 2025 our model’s market peak has moved by a year to 2023. Our service-provider 20-year wireless infrastructure footprint pattern analysis points to a 2020-2026 CAGR of 1% characterized by low single-digit growth through 2023, followed by a 1% decline in 2024, flatness in 2025, and a 4% drop in 2026. This lumpy pattern reflects the differences in regional and national agendas.
About the report:
2Q21 Wireless Infrastructure Market Size, Share, and Forecast report analyzes the wireless infrastructure market worldwide and covers 2G, 3G, 4G and 5G radio access network (RAN) and core network nodes. It presents historical data from 2016 to 2020, quarterly market size and vendor market shares, and a detailed market forecast through 2026 for 2G/3G/4G/5G RAN, including open vRAN, and core networks (EPC, vEPC, and 5GC), in over 10 product categories for each region (North America, Europe, Middle East Africa, Asia Pacific, Caribbean Latin America). The historical data accounts for the sales of more than 30 wireless infrastructure vendors, including vendors that shared confidential sales data with LightCounting. The market forecast is based on a model correlating wireless infrastructure vendor sales with 20 years of service provider network rollout pattern analysis and upgrade and expansion plans.
More information on the report is available at:
https://www.lightcounting.com/report/august-2021-wireless-infrastructure-2q21-116


