

Wireless Industry Growth
TÉRAL Research: Sharp declines in Wireless Infrastructure Market 1Q-2024
The global wireless infrastructure market, including 2G/3G/4G/5G RAN and core networks, experienced significant declines both sequentially (-31%) and YoY (-26%) in 1Q-2024. However, these declines are not unprecedented.
“Such decline has happened before in 2002 and 2003 due to a sharp decrease in TDMA and PDC systems shipments, as well as in the post-LTE peak era from 2016 to 2019, when each year’s first quarter posted a 20%+ YoY decline. And that’s not all, looking at bellwether Ericsson’s networks sales historical data, 1Q was also down 20%+ sequentially during the 5G boom,” said Stéphane Téral, Founder and Chief Analyst at TÉRAL RESEARCH.
Huawei continues to be the largest wireless network infrastructure vendor, Nokia and ZTE Corporation’s lost market share, while Samsung Networks position was steady.
Téral states that 2024 marks the third consecutive year of a wireless disinvestment cycle yet the market is poised for a slight rebound in 2H2024 driven by open RAN and 5G upgrades.
………………………………………………………………………………………………………………..
Stéphane attended Oracle’s Applications & Industries Analyst Summit at the Oracle Conference Center in Redwood Shores, California. This two-day event showcased how Oracle is integrating Generative AI into its Fusion Data Intelligence Platform, enhancing ERP, EPM, SCM, HCM, and CX applications with AI-powered updates. Oracle’s industry verticals, particularly their 5G CSP monetization and digital experience strategies, promise to end the 5G monetization drought. With Oracle migrating databases to its cloud and leveraging AI, CSPs can expect increased efficiency and growth.
References:
https://www.linkedin.com/pulse/whats-new-t%C3%A9ral-research-t-ral-research-qsmec/
https://www.teralresearch.com/resources
Dell’Oro: RAN revenues declined sharply in 2023 and will remain challenging in 2024; top 8 RAN vendors own the market
Dell’Oro & Omdia: Global RAN market declined in 2023 and again in 2024
Dell’Oro: Optical Transport, Mobile Core Network & Cable CPE shipments all declined in 1Q-2024
Global 5G Market Snapshot; Dell’Oro and GSA Updates on 5G SA networks and devices
Dell’Oro: Mobile Core Network market has lowest growth rate since 4Q 2017
What is 5G Advanced and is it ready for deployment any time soon?
Analysys Mason & Light Reading: cellular data traffic growth rates are decreasing
According to Analysys Mason, the telecoms industry is fixated on the idea of a constant and dramatic increase in data consumption by cellular network users. However, the growth rates are no longer increasing. The annual growth in cellular data traffic slowed, worldwide, from more than 90% in 2018 to 34% in 2021 and again to around 22% in 2022.
These figures include a surge in cellular data traffic generated by customers with fixed–wireless access (FWA) services. FWA customers (due to time spent watching TV and video streaming) often generated more than 200–500GB per month which is 16 times more than an average mobile cellular data customer, in 2022.
This means there is an even steeper decline in the growth of data traffic generated by mobile handsets, decreasing from an annual rate of 104% in 2018 to 21% in 2022.
Figure 1: Cellular data traffic growth rates by region, 2017–2022
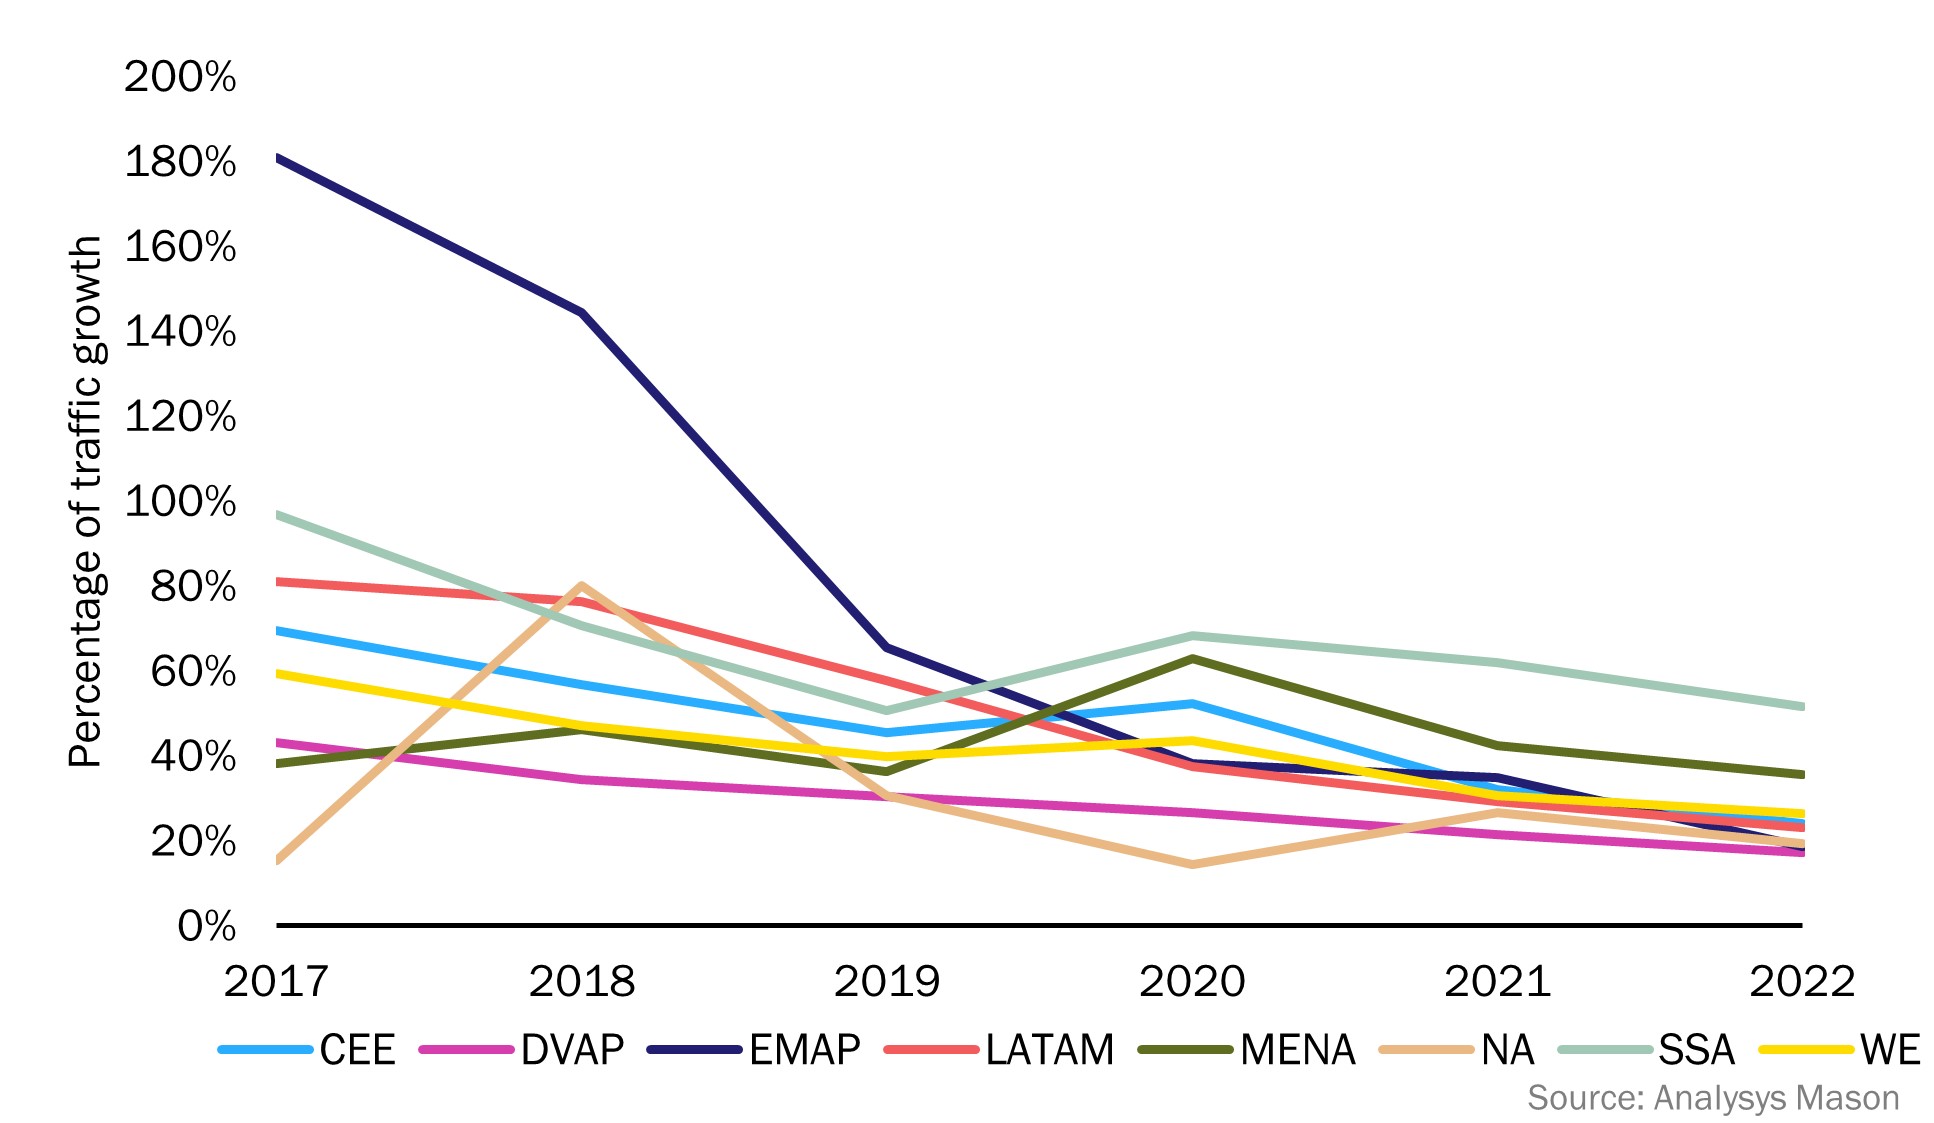
CEE = Central and Eastern Europe, DVAP = Developed Asia–Pacific, EMAP = Emerging Asia–Pacific, LATAM = Latin America, MENA = Middle East and North Africa, NA =North America, SSA = Sub-Saharan Africa, WE = Western Europe
……………………………………………………………………………………………………………
From Light Reading:
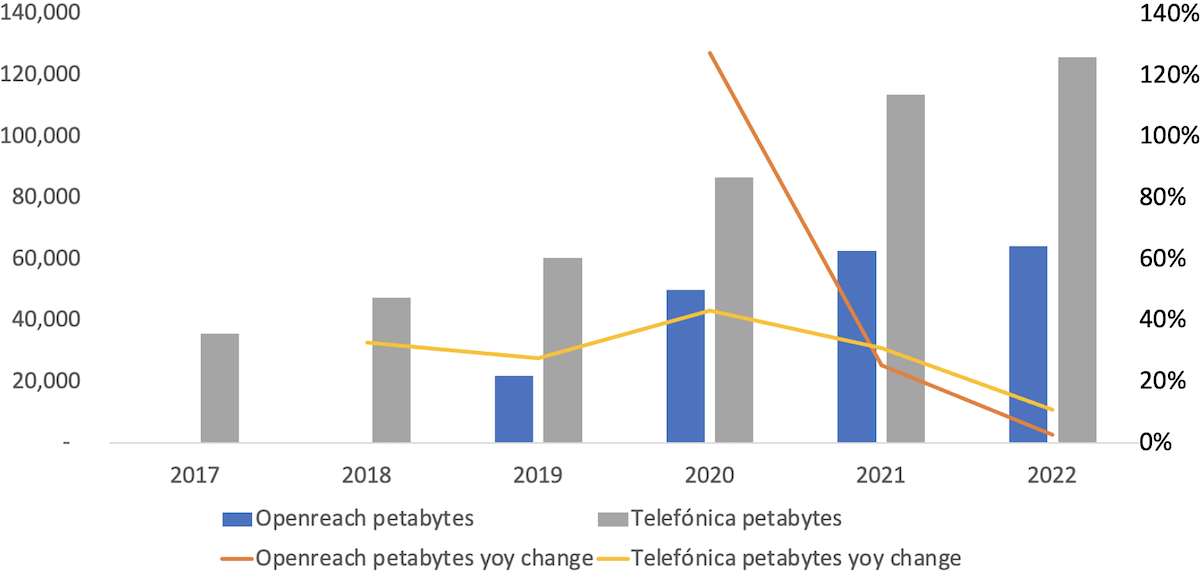
- Data traffic on Openreach, the UK’s main broadband network, grew just 3% last year after rising 25% in 2021 and 127% in 2020 (the year of mass pandemic induced lockdowns).
- A similar trend is observable across the various fixed and mobile networks operated by Spain’s Telefónica. Traffic surged 43% in 2020, but the rate of increase dipped to 11% last year. If the trend persists, the petabytes will soon be dropping.
……………………………………………………………………………………………………………………………….
5G was expected to propel cellular data usage onto a new growth trajectory. However, this is not taking place at all.
Following the launch of 5G services, operators reported very high initial 5G data usage rates. This was primarily caused by the heaviest LTE users upgrading to 5G handsets and services. This migration simultaneously caused a decline in the average traffic generated by users with LTE handsets. The impact of the early adopters was subsequently diluted as less-intensive users upgrade to 5G handsets and services. Then, organic growth in usage started to mask some of the effects of the migration. Over time, though, we can look at whether the total growth in usage across all handset types is sustained. South Korea is a good example to look to. In South Korea, there was an initial surge in data usage the year 5G was introduced, but this effect was short-lived. Average data use by subscribers with 5G handsets fell from its high starting point, became flat and then started to rise once more but only at a low single-digit rate. Average usage by LTE handset owners has been steadily decreasing. Overall, average data traffic growth across all handset types has slowed for 3 years in a row.
Figure 2: Cellular network data traffic growth, South Korea, December 2018–December 2022
| Monthly usage (MB) | December 2018 | December 2019 | December 2020 | December 2021 | December 2022 |
| 4G smartphone traffic per subscriber | 8177 | 9753 | 9650 | 8619 | 7591 |
| 5G smartphone traffic per subscriber | 27 282 | 26 744 | 26 834 | 27 589 | |
| 4G smartphone usage growth | 21% | 19% | –1% | –11% | –12% |
| 5G smartphone usage growth | –2% | 0% | 3% | ||
| Average growth (2G, 3G, 4G and 5G handsets) | 23% | 38% | 18% | 15% | 10% |
Source: Analysys Mason
Operators are currently using FWA to fill the gap between capacity and demand in their 5G networks, but the revenue per megabyte that they generate from FWA services is much lower than that for mobile cellular data services. Relying on FWA traffic to fill 5G networks will not satisfy mobile operators’ investors in the long run. Some operators will also need to limit FWA availability because without the careful management of FWA traffic on 5G networks, there could be negative impacts on the quality of service for non-FWA users.
Only new applications and services will unlock future annual growth rates of 30% or more. However, it is unlikely that the types of services that could significantly accelerate cellular data traffic growth will have a substantial near-term impact.
- Higher definition video and TV services could potentially drive a new wave of data usage. Device capability is an obstacle to this possibility, as most mobile handsets are either not capable of displaying high-definition content or the screen size is too small for users to see the difference. A surge in the use of tablets to view TV on mobile networks could change this – although tablet users tend to use Wi-Fi as their primary means of connectivity. A few mobile operators have introduced mobile cellular data packages that include subscriptions to on-demand TV. This has the potential to drive up data traffic, but there are limits to the amount of time people can spend watching TV when they are away from their homes. Lack of time is likely to prevent excessive mobile TV consumption away from the home. Within the home – even when they have unlimited mobile data packages – users don’t tend to switch to their mobile networks. They typically continue to use devices connected to their home fixed broadband and Wi-Fi for extended TV viewing.
- Connected cars have been regarded as a potential source of high-volume data traffic. But this will likely not happen soon. Most new cars equipped with a mobile connection still only have LTE capabilities, and most of those are only used for telematics. Some original equipment manufacturers (OEMs), as well as operators, have introduced service packages to encourage in-car use of services (based on embedded and aftermarket connections). Even still, usage volumes have been low even in luxury vehicles. Other potential drivers of traffic are C-V2X systems for intelligent transport networks and autonomous vehicles. But despite numerous tests and trials, C-V2X infrastructures are years away, and fully autonomous vehicles still have technical and regulatory hurdles to overcome before they are deployed in meaningful numbers.
- Metaverse services – including AR and VR, and services using haptics – have the potential to generate a high volume of data traffic. In the next 4 or 5 years, the number of users with AR and VR headsets is expected to reach 300–400 million , but faster take-up will be restricted by the cost of end-user equipment, and most image processing will be done using equipment within the home. Eventually, metaverse use cases could involve vast numbers of customers, with cloud processing of fully immersive environments and services requiring very low latency and very high bandwidth.
- However, most of the usage will take place indoors where a combination of fibre and Wi-Fi seems much more suited to the service requirements.
The volume of cellular data traffic is increasing in absolute terms, but the annual change measured in percentage terms is going to be much lower than what is has been historically. Analysys Mason’s new report Wireless network data traffic: worldwide trends and forecasts 2022–2028 evaluates the prospects for cellular data growth over the coming 5 years, with global cellular data traffic nearly tripling worldwide to 2.7ZB in 2028, with a limited metaverse uptick at the end of the period.
References:
https://www.analysysmason.com/research/content/articles/cellular-data-traffic-rdnt0/
LightCounting: Wireless infrastructure market dropped both YoY and sequentially in 1Q23
In the 1stQ2023, the global wireless infrastructure market declined 3% YoY and 17% sequentially, according to LightCounting. Starting a new year with a sequential decline is typical but a YoY drop is abnormal and suggests a declining pattern is in the making. This trend confirms that we have entered the post-peak era.
While the U.S. market posted its steepest drop, the strong 5G rollouts in India and a 5G rebound in Japan, along with stable and sustained activity in EMEA and China, respectively, were not enough to keep the wireless infrastructure market out of the decline. On the open vRAN front, DISH in the U.S., Rakuten Mobile in Japan, and a few Rakuten Symphony customers kept the market flat YoY and produced double digit sequential growth.
Despite a weak quarter, Huawei retook its lead at the expense of Ericsson, which reported weak 1Q23 results that led to a market share loss. In the meantime, Nokia benefited from the 2 leaders’ market share loss and gained 1% point. ZTE also gained share at the expense of Huawei and Ericsson while Samsung’s share remained stable.
“We have passed the 5G peak and have entered the second year of a disinvestment cycle. The 5G investment cycle that started in 2019 and ended in 2021 was driven by hundreds of communications service providers (CSPs), including the world’s largest cellular footprints (i.e., China). At the moment, India’s massive 5G rollout is preventing the situation from getting worse but this will end soon,” said Stéphane Téral, Chief Analyst at LightCounting Market Research.
As a result, this year, LightCounting expects the wireless infrastructure market to slightly decline in 2023 (compared to 2022) with India in the lead. In the long run, our service provider 20-year wireless infrastructure footprint pattern analysis points to a 2022-2028 CAGR of -3% characterized by low single-digit declines through 2027, which appears to be the bottom leading to flatness or slight growth in 2028. In fact, we expect 5G to slightly pick up in 2027, driven by upgrades needed to prepare networks for 6G. Given the ongoing 6G activity, we believe something labeled 6G will be deployed in 2028.
Highlights from Dell’Oro’s 1Q 2023 RAN report:
- Top 5 RAN 1Q 2023 RAN suppliers include Huawei, Ericsson, Nokia, ZTE, and Samsung.
- Top 4 RAN 1Q 2023 RAN suppliers outside of China include Ericsson, Nokia, Huawei, and Samsung.
- Nokia recorded the highest growth rate among the top 5 suppliers, while Ericsson and Samsung both lost some ground in the first quarter.
- The report also shows that Nokia’s RAN revenue share outside of China has been trending upward over the past five quarters.
- The Asia Pacific RAN market has been revised upward to reflect the higher baseline in India.
Open RAN and vRAN highlights from Dell’Oro’s 1Q 2023 RAN report:
- After more than doubling in 2022, Open RAN revenue growth was in the 10 to 20 percent range in the first quarter while the vRAN market advanced 20 to 30 percent.
- Positive developments in the Asia Pacific region were dragged down by more challenging comparisons in the North America region.
- Short-term projections remain unchanged – Open RAN is still projected to account for 6 to 10 percent of the 2023 RAN market.
- Top 5 Open RAN suppliers by revenue for the 2Q 2022 to 1Q 2023 period include Samsung, NEC, Fujitsu, Rakuten Symphony, and Mavenir.
| Historical data accounts for sales of the following vendors: | ||
| Vendor | Segments | Source of Information |
| Affirmed Networks (acquired by Microsoft, April 2020) | vEPC, 5GC | Estimates |
| Altran | vRAN | Estimates |
| Altiostar | vRAN (CU, DU) | Estimates |
| Amdocs | 5GC | Estimates |
| ASOCS | vRAN (DU) | None, supplies other RAN/vRAN vendors |
| Baicell | RAN (RU) | None, supplies other RAN/vRAN vendors |
| Benetel | Open RAN (RU) | None, supplies other RAN/vRAN vendors |
| Cisco | EPC, vEPC, 5GC | Survey data and estimates |
| China Information and Communication Technologies Group (CICT) | RAN | Estimates |
| Comba Telecom | RAN/vRAN (RU) | None, supplies other RAN/vRAN vendors |
| CommScope (acquired Phluido vRAN patents, October 2020) | vRAN (RU, DU) | Estimates |
| Corning | vRAN | Estimates |
| Dell | vRAN (DU) | None, supplies other RAN/vRAN vendors |
| Enea | 5GC | Estimates |
| Ericsson | RAN, vRAN, 2/3G Core, EPC, vEPC, 5GC | Estimates |
| Fairwaves | RAN/vRAN (RU) | None, supplies other RAN/vRAN vendors |
| Fujitsu | RAN | Survey data and estimates |
| HPE | 2G/3G core, 5GC | Estimates |
| Huawei | RAN, vRAN, 2/3G Core, EPC, vEPC, 5GC | Survey data and estimates |
| JMA Wireless | vRAN | Estimates |
| KMW | RAN/vRAN (RU) | None, supplies other RAN/vRAN vendors |
| Kontron | vRAN (DU) | None, supplies other RAN/vRAN vendors |
| Mavenir (acquired ip.access, September 2020) | vEPC, vRAN, 5GC | Survey data and estimates |
| Metaswitch (acquired by Microsoft, May 2020) | 5GC, vEPC and 2G/3G core | Estimates |
| Movandi | RAN/vRAN (RU/repeater) | Estimates |
| MTI Mobile | vRAN (RU) | None, supplies other RAN/vRAN vendors |
| Node-H | vRAN (small cells) | Estimates |
| Nokia | RAN, vRAN, 2/3G Core, EPC, vEPC, 5GC | Survey data and estimates |
| NEC (including Blue Danube) | RAN, vRAN (RU), EPC, 5GC | Survey data and estimates |
| Oracle | 5GC | Estimates |
| Parallel Wireless | vRAN (CU, DU) | Estimates |
| Pivotal | RAN/vRAN (RU/mmWave repeater) | Estimates |
| Quanta Cloud Technology (QCT) | vRAN (DU) | None, supplies other RAN/vRAN vendors |
| Qucell | RAN, vRAN | Estimates |
| Ribbon Communications | 2G/3G core | Survey data and estimates |
| Samsung | RAN, vRAN, vEPC, 5GC | Estimates |
| Silicom | Open RAN (DU) | None, supplies other RAN/vRAN vendors |
| SuperMicro Computer | vRAN (DU) | None, supplies other RAN/vRAN vendors |
| Verana Networks | RAN/vRAN (RU/mmWave) | Estimates |
| ZTE | RAN, vRAN, 2/3G Core, EPC, vEPC, 5GC | Survey data and estimates |
LightCounting: 1H-2022 Wireless Infrastructure softness lingered in 3Q-2022
by Stéphane Téral, Chief Analyst at LightCounting Market Research
3Q22 was almost a carbon copy of 2Q22, which signals that the 5G-driven wireless infrastructure market is reaching its peak as the first wave of 5G rollouts wane.
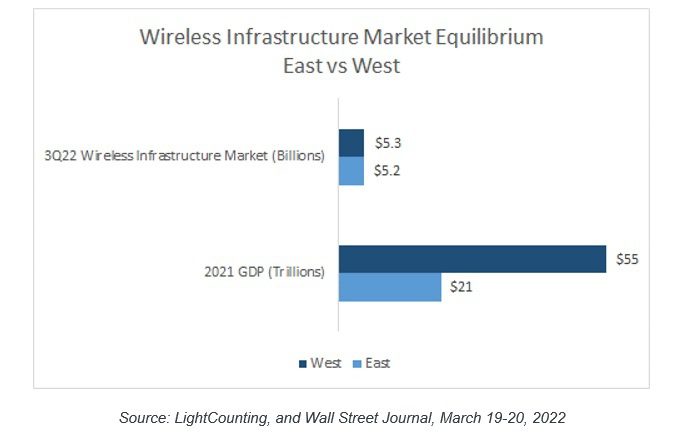
Global uncertainties, lingering supply chain constraints, and forex headwinds contributed to another soft 3Q22 that followed an already sluggish 1H22. In the meantime, the wireless infrastructure market continued to operate at its equilibrium reached in 2021: the 2 opposite spheres of influence, the East led by China versus the West defined as the U.S. and its allies, are becoming more balanced.
We found that the West accounted for 50.5% of the global wireless infrastructure market while the East made up for the rest, with China accounting for more than 80% of the East.
| Historical data accounts for sales of the following vendors: | |||
| Vendor | Segments | Source of Information | |
| Affirmed Networks (acquired by Microsoft, April 2020) | vEPC, 5GC | Estimates | |
| Altran | vRAN | Estimates | |
| Altiostar | vRAN (CU, DU) | Estimates | |
| Amdocs | 5GC | Estimates | |
| ASOCS | vRAN (DU) | None, supplies other RAN/vRAN vendors | |
| Baicell | RAN (RU) | None, supplies other RAN/vRAN vendors | |
| Benetel | Open RAN (RU) | None, supplies other RAN/vRAN vendors | |
| Cisco | EPC, vEPC, 5GC | Survey data and estimates | |
| China Information and Communication Technologies Group (CICT) | RAN | Estimates | |
| Comba Telecom | RAN/vRAN (RU) | None, supplies other RAN/vRAN vendors | |
| CommScope (acquired Phluido vRAN patents, October 2020) | vRAN (RU, DU) | Estimates | |
| Corning | vRAN | Estimates | |
| Dell | vRAN (DU) | None, supplies other RAN/vRAN vendors | |
| Enea | 5GC | Estimates | |
| Ericsson | RAN, vRAN, 2/3G Core, EPC, vEPC, 5GC | Estimates | |
| Fairwaves | RAN/vRAN (RU) | None, supplies other RAN/vRAN vendors | |
| Fujitsu | RAN | Survey data and estimates | |
| HPE | 2G/3G core, 5GC | Estimates | |
| Huawei | RAN, vRAN, 2/3G Core, EPC, vEPC, 5GC | Survey data and estimates | |
| JMA Wireless | vRAN | Estimates | |
| KMW | RAN/vRAN (RU) | None, supplies other RAN/vRAN vendors | |
| Kontron | vRAN (DU) | None, supplies other RAN/vRAN vendors | |
| Mavenir (acquired ip.access, September 2020) | vEPC, vRAN, 5GC | Survey data and estimates | |
| Metaswitch (acquired by Microsoft, May 2020) | 5GC, vEPC and 2G/3G core | Estimates | |
| Movandi | RAN/vRAN (RU/repeater) | Estimates | |
| MTI Mobile | vRAN (RU) | None, supplies other RAN/vRAN vendors | |
| Node-H | vRAN (small cells) | Estimates | |
| Nokia | RAN, vRAN, 2/3G Core, EPC, vEPC, 5GC | Survey data and estimates | |
| NEC (including Blue Danube) | RAN, vRAN (RU), EPC, 5GC | Survey data and estimates | |
| Oracle | 5GC | Estimates | |
| Parallel Wireless | vRAN (CU, DU) | Estimates | |
| Pivotal | RAN/vRAN (RU/mmWave repeater) | Estimates | |
| Quanta Cloud Technology (QCT) | vRAN (DU) | None, supplies other RAN/vRAN vendors | |
| Qucell | RAN, vRAN | Estimates | |
| Ribbon Communications | 2G/3G core | Survey data and estimates | |
| Samsung | RAN, vRAN, vEPC, 5GC | Estimates | |
| Silicom | Open RAN (DU) | None, supplies other RAN/vRAN vendors | |
| SuperMicro Computer | vRAN (DU) | None, supplies other RAN/vRAN vendors | |
| Verana Networks | RAN/vRAN (RU/mmWave) | Estimates | |
| ZTE | RAN, vRAN, 2/3G Core, EPC, vEPC, 5GC | Survey data and estimates | |
References:
https://www.lightcounting.com/report/december-2022-wireless-infrastructure-3q22-177
MoffettNathanson: accelerating rise of Cable Wireless; Business Wireline status; AT&T’s overlooked assets
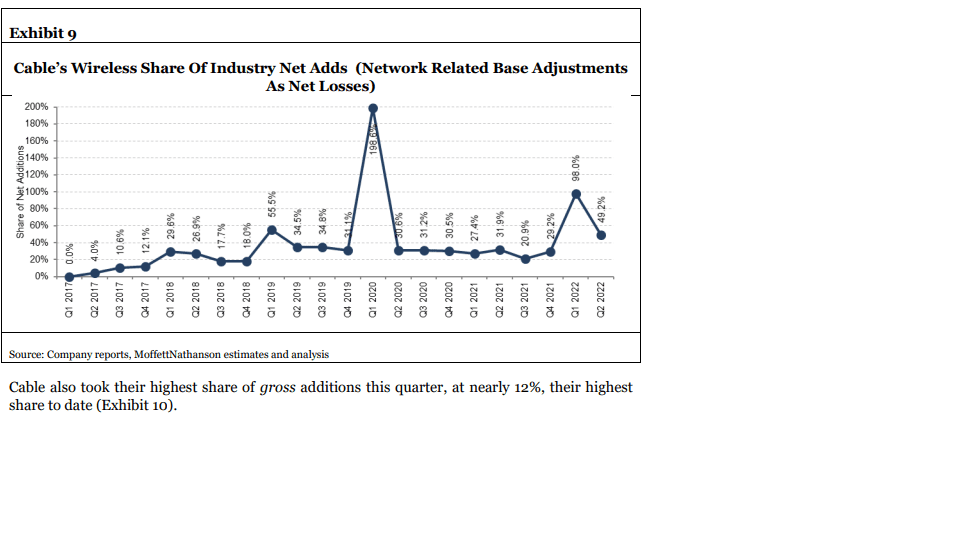
To the surprise of many, the Cable industry (Cablecos/MSOs) has captured an accelerating share of gross and net wireless subscriber additions, forcing incumbent wireless telcos (AT&T, Verizon, T-Mobile) to respond by offering lower priced alternatives. In the second quarter of the year, with cable taking nearly half (49.2%) of industry net additions in the period (after adjusting for 3G network shutdowns), according to MoffettNathanson’s latest report (subscription required) on the mobile sector. Cable’s Q2 2022 take was up from approximately 31.9% in the year-ago period.
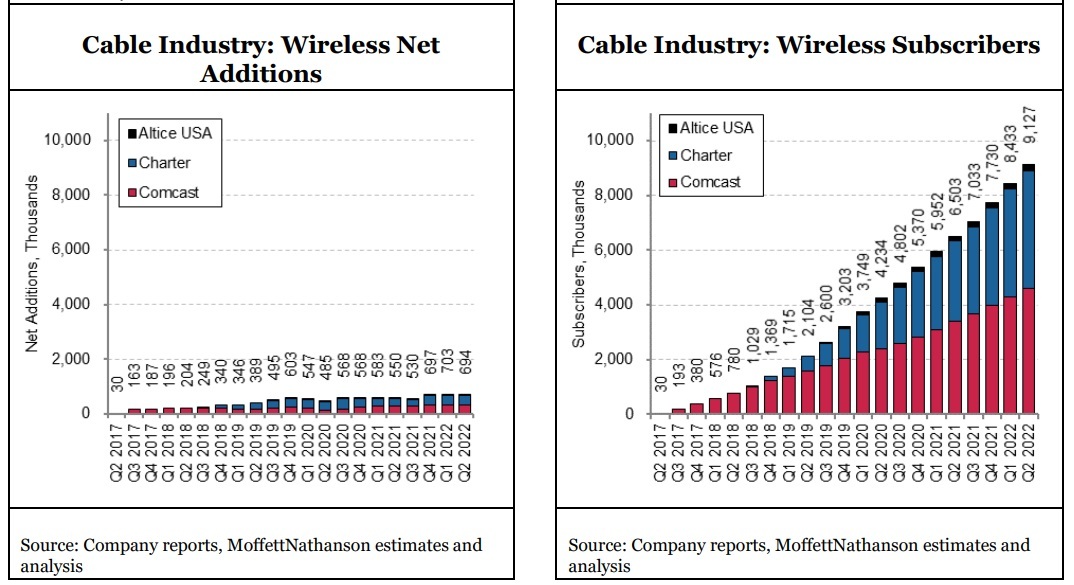
MoffettNathanson’s analysis also showed that cable took its highest share of gross mobile subscriber adds in Q2 2022, at 11.9%. That compared to T-Mobile (30.1%), AT&T (29%) and Verizon (27.8%). Comcast, Charter and Altice USA combined to add 694,000 mobile lines in the second quarter, ending the period with 9.12 million.
Comcast, Charter, and Altice collectively added 694K new subscribers in Q2, up more than 100K from the corresponding quarter last year. That takes Cable’s subscriber base beyond 9M, or still just ~3% of the U.S. industry as per the graph below.
- Comcast disclosed that wireless penetration of its residential broadband base has reached 7.9% (or about 2.4M homes), suggesting they’ve reached nearly 2 lines per home, up from ~1.6 lines per account just a year ago.
- Privately held Cox Communications is now in beta testing on its MVNO service, and we expect it will offer pricing similar to Comcast’s and Charter’s. That will only add to the pressure on the wireless telco incumbents.
“Cable Wireless offers have been more successful than anyone had expected when they were first introduced,” MoffettNathanson analyst Craig Moffett wrote. Of note, it appears that Comcast ‘s Xfinity Mobile service has reached nearly two lines per home per mobile sub, up from about 1.6 mobile lines per account just a year ago.
 Citing data from Navi, a firm that aggregates data on service plans and promos from major postpaid carriers, original equipment manufacturers and large retailers, Moffett says there’s a “clear and growing interest in Cable Wireless as a potential service provider.”
“Lower industry growth means a more challenging path forward for all carriers… particularly given the rapid share gains of the cable operators,” Craig wrote. “While Cable wireless collectively took nearly 700K net adds during the quarter, they would presumably have taken even more had the incumbents’ new basic entry plans not been introduced,” he added.
……………………………………………………………………………………………………………………………………………………………………
Business Wireline Status:
“While wireless is inarguably the core business for both Verizon and AT&T, the worsening conditions of the Business Wireline segment, which accounts for some 19% of revenues at AT&T and 11% at Verizon, cannot be ignored. Deterioration in the sector overall is bad enough, particularly in light of high prevailing inflation. Industry revenues are now shrinking by 3.7% per year. Excluding USF and IP sales, AT&T saw Business Wireline revenues fall by 7.6% YoY in Q2, and Verizon saw Business Wireline revenues fall by an estimated 8.2%,” wrote Craig Moffett.
AT&T’s Overlooked Assets:
MoffettNathanson is missing two key growing revenue streams for AT&T:
- Increasing fiber optic network sales to both business and residential customers: AT&T added 316,000 net AT&T Fiber subscribers during the second quarter of 2022, resulting in fiber penetration of nearly 37% with about 6.6 million total fiber subscribers. AT&T has already added nearly 2 million AT&T Fiber (brand name) locations this year. AT&T’s fast-growing fiber revenues now make up nearly half of our consumer wireline broadband revenues.”
- FirstNet network which covers more first responders than any other network. FirstNet now reaches more than 2.81 million square miles across the U.S. That is 50,000+ more square miles than the largest commercial networks (about the size of Alabama) – giving more first responders access to an entire ecosystem of innovative solutions to keep them mission ready.
References:
https://www.fiercetelecom.com/broadband/att-adds-316000-fiber-subs-q2-2022
https://about.att.com/story/2022/fn-covers-more-first-responders-than-any-network.html
LightShed Partners on 5G, Unsustainable Wireless Growth Bubble, Revenue Opportunities
Excerpts from LightShed Partners report – The Wireless Industry’s 5G Growth Problem, MAY 31, 2022 ~ by WALTER PIECYK AND JOE GALONE (Registration required):
Wireless operators in the United States committed to invest over $200 billion into 5G (spectrum licenses, network equipment and build out costs), but does anyone care? Consumers have shown little interest in switching between service providers because of 5G. They have also been slow to upgrade to higher-priced 5G rate plans with their existing provider.
5G has not been enough to attract wireless consumers to higher priced rate plans. The major telcos have enabled 5G on all of their unlimited post-paid rate plans. Verizon withholds its “Ultra-Wideband” 5G from entry level subscribers but includes this faster speed level on the rest of their rate plans. We are skeptical faster 5G is inducing many subscribers to upgrade.

Despite the macro headwinds, we expect 1.5-3.0% growth in post-paid phone subscribers going forward. That’s not terrible, but it implies that industry net adds will fall to 6.7 million this year from 9.4 million in 2021. That is 1.9 million (22%) below consensus. Our peers may be excluding ~950k of base “cleanups” and network shutdowns in their estimates. That is odd as this is churn of subs that are allegedly paying their bills. Even if we excluded this “clean-up” our estimate would still be 1 million below consensus in 2022.
So where can wireless operators find more revenue growth?
Our outlook for industry subscriber growth is clearly not enough to generate the higher sustainable revenue growth that many investors prefer unless a wireless operator is taking material share. It’s hard to make a long-term case for notable shifts in market share in the wireless industry. Network differentiation has tightened, churn rates are at record lows. Plus, any material change to pricing would have an unwanted impact to the free cash flow of their large subscriber bases. So then what?
Wireless operators can attempt to boost revenue growth with wireless home broadband (aka Fixed Wireless Access or FWA), wholesale and IoT. But post-paid phone revenue, which represents 75% of total service revenue, is still the primary driver of growth. We estimate that in 2022, post-paid phone revenue will contribute 260 basis points of the 3.4% industry growth that we forecast. And in 2023, we expect it to contribute 220 basis points of our 3.2% expected growth. Without post-paid phone revenue growth, these companies have major growth challenges.
We are skeptical that premium services like hotspot data or better video streaming quality are incentives to move up rate plans. We invite any company to offer data on why this will offer a tailwind of upgrades over the next five years.
How much extra growth does Home Broadband offer?
We expect wireless home broadband to add an incremental $1 billion of recurring revenue per year for the wireless industry. That represents about 40 basis points of our industry revenue growth estimate of 3-4%. The impact of home broadband on growth is meaningful to T-Mobile and Verizon, contributing 100 bps and 60 bps respectively to their total wireless service revenue growth. Our wireless home broadband estimates are below the guidance of these companies, and therefore also likely below consensus – as we highlighted on our recent initiation of Charter. (Link) AT&T prefers to pursue a fiber growth strategy.
Home broadband is enabled by spectrum depth not 5G:
5G proponents would note that home broadband is a 5G application that helps to justify the $200 billion industry investment. But if that money had been plowed into spectrum and capex for LTE, we believe there would be little difference in the resulting revenue generated by home broadband. The thick spectrum blocks that operators purchased or acquired help LTE speeds and capacity in largely the same way it enables 5G. In addition, we have yet to notice perceptible differences in latency between 5G and LTE as measured (perhaps incorrectly) by the ping on speed tests. Only Dish Networks appears to be taking the capabilities of 5G down a path that is materially superior than what can be achieved with LTE and traditional network design.
References:
