

xRAN Forum approves Fronthaul Interface Specification for NexGen Open RAN architecture
Executive Summary:
On April 12th, the xRAN Forum (xRAN.org) announced the public availability of the xRAN Fronthaul Specification Version 1.0 – the first specification made publicly available from xRAN since its launch in October 2016. The specification was said to permit “a wide range of vendors to develop innovative, best-of-breed RRUs (remote radio unit) and BBUs (base band units) for a wide range of deployment scenarios, which can be easily integrated with virtualized infrastructure and management systems using standardized data models.”
Why is a new RAN architecture needed?
Current RAN architectures result in sub-optimal use of scarce spectrum and radio resources as well as make it hard for operators to program them quickly to meet emerging customer needs. Amid exploding demand for bandwidth and intense demands from new services, carriers need an alternative approach to address the escalating capital and operational costs of the existing design as well as make the network more agile to deploy new services.
Why It’s Important:
The new specification was said to “deliver on important operator member requirements.” It defines open interfaces between the remote radio unit/head (RRU/RRH), the baseband unit (BBU) and the operation and management (OAM) interface to simplify interoperability between suppliers. It’s significant because traditionally, the RRU and BBU had to come from the same vendor. By complying with this spec, different vendors (best of breed?) could provide each of those pieces of equipment. The desired outcome is for a wireless network operator to buy an RRU from one vendor and a BBU from another vendor such that they’ll work together via a common interface. Some say it’s going to bust up the old “cartel” of RRU/BBU suppliers.
The xRAN Fronthaul spec was said to address several key operator-defined requirements, including:
• BBU – RU interoperability based on well specified control, user and management plane interfaces.
• Efficient bandwidth scaling as a function of user throughput and spatial layers to address
increasing bandwidth needs and Massive MIMO deployments.
• Support for LTE, NR, associated features, 2T – 8T RU products and Massive MIMO beamforming
antenna systems.
• Advanced receivers and co-ordination functions.
• Ethernet based transport layer solutions.
• Extensible data models for management functions to simplify integration.
The xRAN Forum Front Haul Working Group is chaired by Verizon. A spokeswoman for Verizon, told Lightreading in an email that the xRAN spec defines an “open Internet-based standard on which future RAN products will be built,” while ORAN is an effort to “ensure various proprietary CPRI-based systems can understand one another’s languages and operations.”
Note: CPRI (Common Public Radio Interface) defines the interface between Radio Equipment Controllers (REC) and Radio Equipment (RE) such that multiple vendors can provide different parts of a base station.
Selected Quotes:
“Our vision to develop, standardize and promote an open alternative to the traditionally closed, hardwarebased RAN architecture is becoming a reality,” said Dr. Sachin Katti, Professor at Stanford University and Director of the xRAN Forum. “Our operator members have been very focused and clear on requirements and our ecosystem of contributing members have risen to the challenge. The Fonthaul Specification is the first of several open interface specifications we expect to be released in 2018.”
“The release of the xRAN Fronthaul Specification is a groundbreaking advancement toward enabling an open RAN architecture to support next-generation products and services,” said Bill Stone, Vice President, Network Technology Development and Planning at Verizon. “xRAN compliant radios coupled with virtualized basebands provide much needed flexibility to support rapid development and deployment of RAN products. By adopting xRAN specifications, we will be able to speed innovation, increase collaboration, and be more agile to a quickly evolving market.”
“We are pleased to have worked with xRAN members in reaching the key milestone of delivering the first open xRAN fronthaul specification,” said Dr. Hiroshi Nakamura, EVP and CTO of NTT DOCOMO. “We believe that the completion and publication of this specification will contribute in further advancing the RAN and in expanding the ecosystem in the 5G era. DOCOMO will keep contributing to this activity with the experience we had in realizing multi-vendor interoperable RAN with our partners using common interfaces for our LTE network.”
“The xRAN Fronthaul Specification is a foundational component in the xRAN architectural vision and vital to accelerating the worldwide deployment of next-generation RAN infrastructure network operators demand,” said Alex Jinsung Choi, SVP Research & Technology Innovation, Deutsche Telekom. “Going forward, by connecting these specification activities to the broad architectural scope in ORAN, we can ensure the implementations across a wider community of suppliers to promote both innovation and open market competition.”
“xRAN’s release of this jointly-developed open specification creates the first wave of a positive sea change for our industry, transforming the way next-generation RAN infrastructure will be built, managed and optimized,” said Andre Fuetsch, CTO and President AT&T Labs. “Equipment that supports open specifications from xRAN (and ORAN in the future), combined with increasing RAN virtualization and data-driven intelligence, will allow carriers to reduce complexity, innovate more quickly and significantly reduce deployment and operational costs.”

The specification is designed to allow for a range of vendors to develop best-of-breed RRUs and BBUs for various deployment scenarios. (Pixabay)
About xRAN Forum:
The xRAN Forum was formed to develop, standardize and promote an open alternative to the traditionally closed, hardware-based RAN architecture. xRAN fundamentally advances RAN architecture in three areas – decouples the RAN control plane from the user plane, builds a modular eNB software stack that operates on common-off-the-shelf (COTS) hardware and publishes open north- and south-bound interfaces to the industry.
xRAN Forum operator members include: AT&T, Verizon and Deutsche Telekom, KDDI, NTT DoCoMo, SK Telecom and Telstra. The vendor and academic community is also represented in the xRAN Forum by AltioStar, Amdocs, Aricent, ASOCS, Blue Danube, Ciena, Cisco, CommScope, Fujitsu, Intel, Mavenir, NEC, Netsia, Nokia, Radisys, Samsung, Stanford University, Texas Instruments and University of Sydney.
References:
http://www.xran.org/resources/
Mozilla Foundation: Internet is NOT Healthy! FB Google, Amazon and Tencent Hold Too Much Power
The Mozilla Foundation has published its 2018 Internet Health Report, specifically citing consolidation of control as a concerning issue. Other areas of concern include web literacy, “digital inclusion,” openness, and personal privacy and security. “Fake news,” IoT security weakness and hacking are symptoms of larger problems.
Mozilla Foundation Executive Director Mark Surman explained the harm done by Facebook’s failure to enforce its privacy policy. In a blog post today, he described the process of creating the 2018 Internet Health Report. As Surman and foundation fellows were discussing how to examine the topic of “fake news,” he wrote, “I sketched out a list on a napkin to help order our thoughts:”
What the napkin said:
Collecting all our data
+ precision targeted ads
+ bots and fake accounts
+ FB dominates news distribution
+ not enough Web literacy
= fuel for fraud and abuse, and very bad real world outcomes
…………………………………………………………………………………………………….
Edited by Solana Larsen and written by Mozilla Foundation research fellows, the Internet Health report is an evaluation of “what’s helping and what’s hurting the Internet,” and it focuses on five broad areas of concern—personal privacy and security, decentralization, openness, “digital inclusion,” and general Web literacy. And Facebook’s part in the health of the Internet is writ large across the report.
Of particular concern were three issues:
- Consolidation of power over the Internet, particularly by Facebook, Google, Tencent, and Amazon.
- The spread of “fake news,” which the report attributes in part to the “broken online advertising economy” that provides financial incentive for fraud, misinformation, and abuse.
- The threat to privacy posed by the poor security of the Internet of Things.
The foundation’s report isn’t all bad news—it highlights progress in affordable access and the adoption of cryptography. But the cautionary notes outweigh the optimistic ones, especially on the topic of consolidation of control over Internet content and collection of personal data. While the data collected and transformed into intelligence by the big social media and e-commerce vendors is vast, the Mozilla Foundation report warns, “The network control of major Internet services is only part of the grip they hold on our lives. Through sheer size and diverse holdings, a few companies including Google, Facebook, and Amazon—or if you live in China, Baidu, Tencent and Alibaba—have become intertwined not only with our daily lives, but with all aspects of the global economy, civic discourse, and democracy itself… they are too big. Through monopolistic business practices that are specific to the digital age, they undermine privacy, openness, and competition on the Web.”
That impact extends into the realm of “fake news,” as the report points out, because “most people are getting at least some of their news from social media now.” This enabled the Russia-based Internet Research Agency’s efforts to distort reality by creating dozens of ‘fake’ Facebook pages, including “BlackMattersUS” and “Heart of Texas,” as the report cites—using the language of US political movements to attract followers and spread misinformation—as well as organizing actual protests, “and once even a protest and a counter protest at the same time,” the report notes.
At the same time, thousands of “fake news” stories were created entirely to generate revenue from advertising—many of them created by people in one town in Macedonia. Social media platforms allowed these fraudulent articles to generate hundreds of thousands of dollars in revenue for their creators.
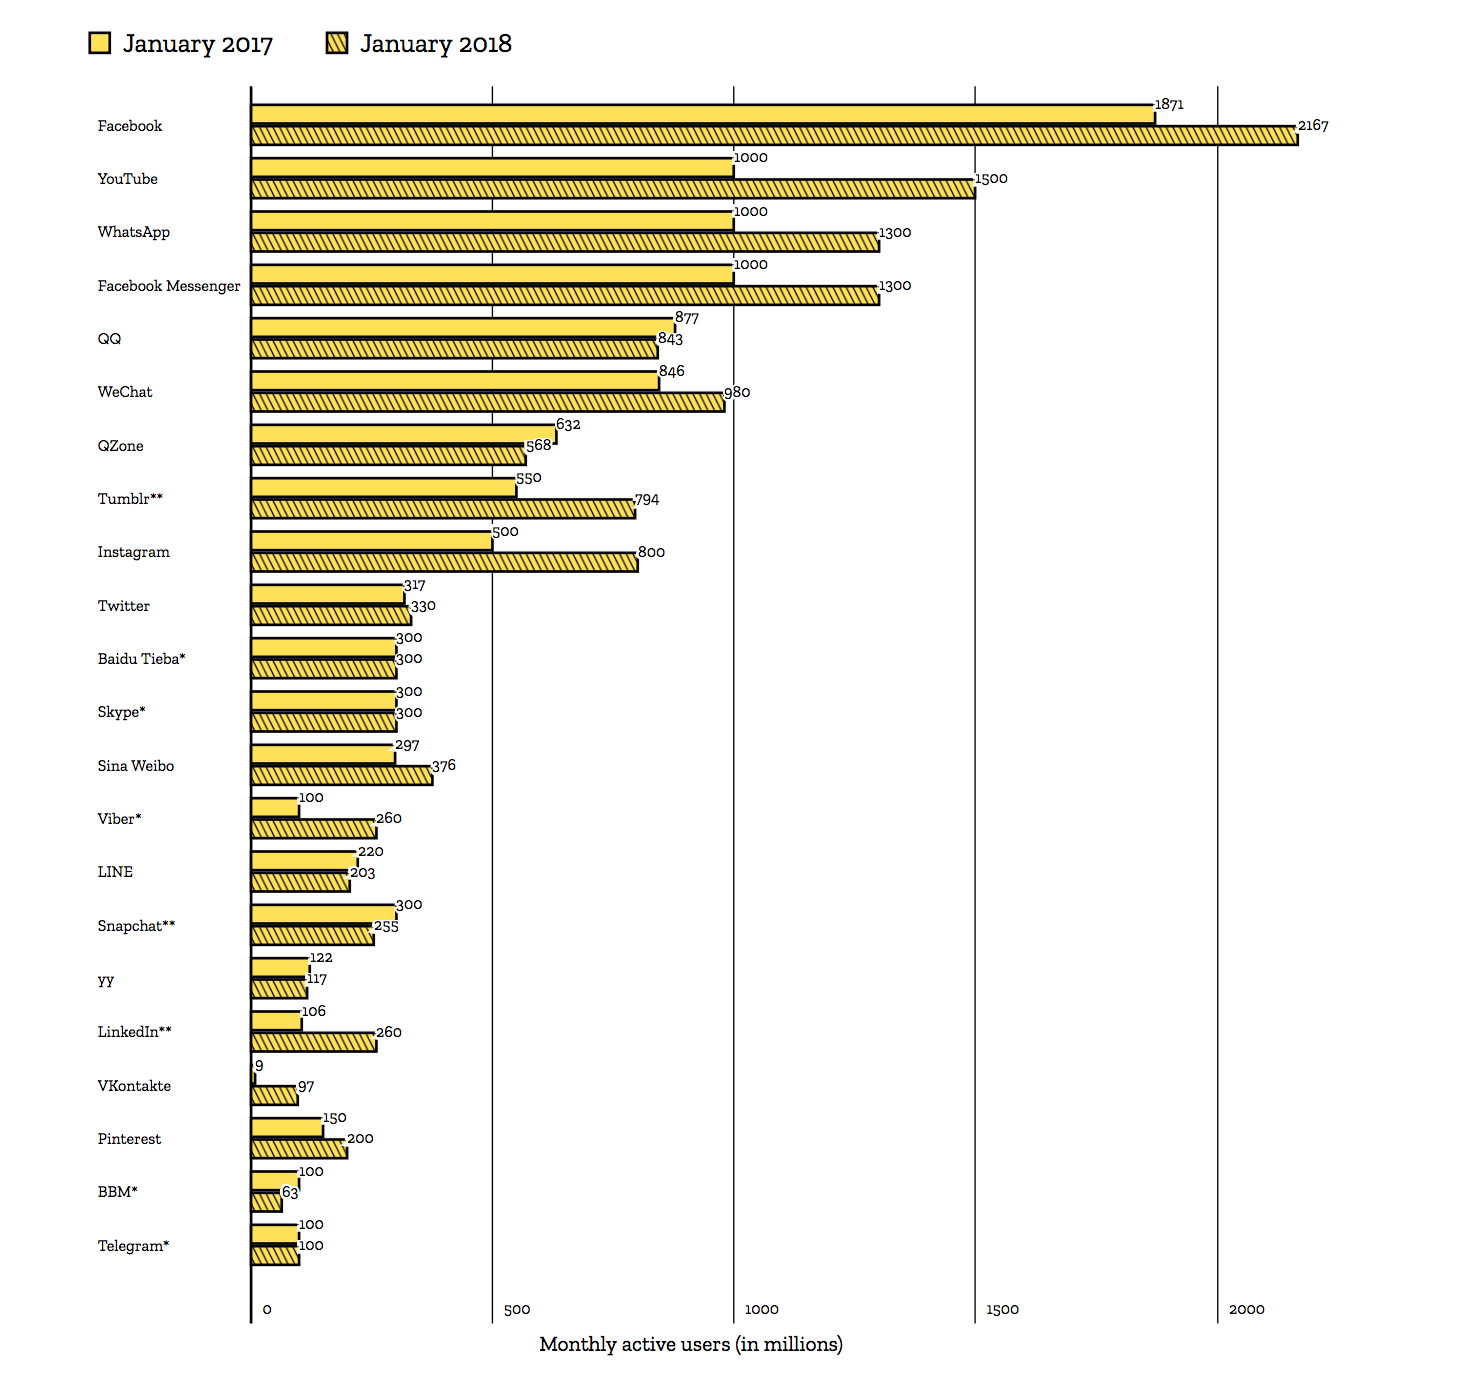
Social media sites are a natural platform for this sort of deception and fraud, because it’s where the eyeballs are. The reach of social media companies has continued to expand, as the report shows in this chart of monthly active users, in millions, for each social media platform. During 2017, Facebook managed to expand its monthly active user base from 1.87 billion to 2.17 billion, while expanding its reach into users’ lives as millions more adopted Facebook’s Messenger application and WhatsApp (each of which now has approximately 1.3 billion monthly active users).
The precision with which these platforms can be used to target particular types of users and to effectively distort their perception of the world around them makes the dominance of the Internet by Facebook and others even more dangerous, the researchers asserted.
The emerging Internet of Things poses its own sort of danger to the privacy and security of individuals. With 30 billion Internet-connected devices expected by 2020, the report’s authors expressed concern about both the privacy impact of those devices and the threat posed by malware like the Mirai botnet that struck the Internet last year. The report warns that “the risk of all these insecure ‘things’ still exists, and the scale grows bigger with every new connected device.”
………………………………………………………………………………………………………………………
Here’s the link to an excellent webinar that analyzes the crux of the Facebook/Cambridge Analytica fiasco. The bottom line is Facebook didn’t enforce its stated privacy policies and there was no regulatory oversight to hold them accountable. This author asked the first question towards the end of the webinar at 56:05. The presenter said “That’s a very weighty question but I’d appreciate it.”
Dell’Oro: Worldwide Capex Forecast to Rise 2017 – 2020 Despite Flat Carrier Revenues with only 2% from IoT
According to a recently published report from Dell’Oro Group, worldwide newtork operator capex is forecast to rise from 2017 through 2020 despite flat carrier revenues. The most notable increases come from AT&T, Sprint, Megafon, Orange, Etisalat, and Deutsche Telekom.
“We have adjusted our overall three-year CapEx expectations upward to reflect a more optimistic investment view than we had originally envisioned in both the US and Chinese markets,” Stefan Pongratz, a senior analyst at Delloro, said in a blog post online. The increase in global CapEx is being driven by increased spending in the US, as the country tries to position itself at the front of the queue for 5G deployment.
“After three consecutive years of declining capex, short-term and near-term market expectations have shifted up,” Pongratz said.
“Here in the US, we maintain the view that conditions are stabilizing and both capex and capital intensity will continue to trend upward. There are multiple factors that support our renewed optimism for capex in the US:
- We are seeing our first signs of US Federal tax reductions translating into increases in capex with a clear boost in AT&T’s 2018 capex projections.
- We see Sprint investing again
- FirstNet investments are set to commence in 2018
- Larger data plans are propelling capacity investments
And lastly, overall carrier revenue trends are stabilizing,” continued Pongratz.
However, total capex spending in China [Figure 1. below] is still expected to decline year-on-year in 2018 and stay flat in 2019 before returning to growth in 2020.

Currency adjusted operator revenues are projected to remain flat between 2017 and 2020, with operators expected to struggle to find new revenue streams to offset slower smartphone revenue growth.
While the IoT has long-term revenue generation possibilities, there is expected to be limited benefit over the next few years. Dell’Oro estimates that carrier IoT revenues will account for just 2% of total mobile revenues by 2020. Preliminary IoT connection pricing trends for 2017 are cause for concern, with downside risks to the IoT carrier revenue forecast, should price trends prevail. Please see Figure 2. below for Dell ‘Oro forecast of IoT Carrier revenue growth through 2020.

About the Report
The Dell’Oro Group Carrier Economics Report provides in-depth coverage of more than 50 carriers’ revenue, capital expenditure, and capital intensity trends. The report provides actual and forecast details by carrier, by region, by country (United States, Canada, China, India, Japan, and South Korea), and by technology (wireless/wireline). The report also discusses further capex accelerating factors such as preparation for 5G and inhibiting factors such as the flat revenue trend. The report assumes operators will struggle to identify new revenue streams.
To purchase this report, please contact Matt Dear at +1.650.622.9400 x223 or email [email protected].
About Dell’Oro Group
Dell’Oro Group is a market research firm that specializes in strategic competitive analysis in the telecommunications, networks, and data center IT markets. Our firm provides in-depth quantitative data and qualitative analysis to facilitate critical, fact-based business decisions. For more information, contact Dell’Oro Group at +1.650.622.9400 or visit www.delloro.com.
New FTTC technology to be deployed in Australia under NBN rollout
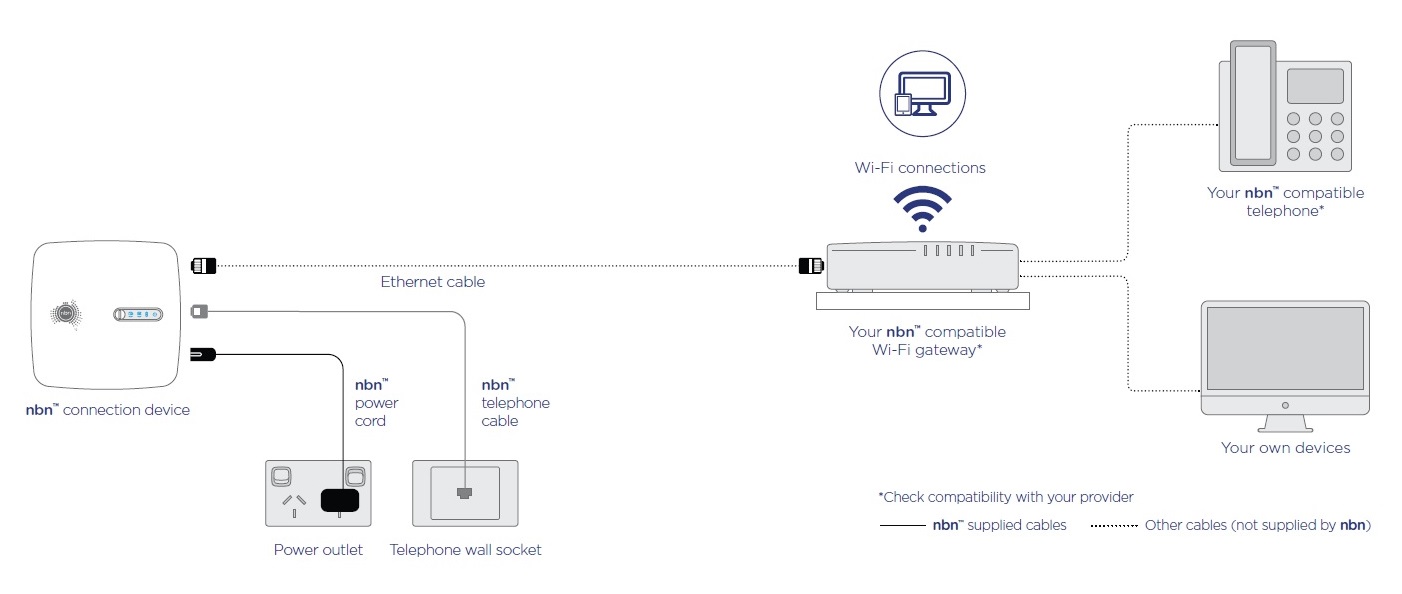
More than 1000 homes and businesses in North Melbourne and Sydney’s south will be the first to benefit from new technology under the NBN rollout that will deliver faster broadband speeds. NBN Co is providing a limited release of its fiber-to-the-curb (FTTC) technology that will connect to a telecom pit near a driveway outside a home or business rather than a junction box down the street, with a larger release due in the second half of this year. Fiber-optic cable is connected to the pit outside the home or business, with existing copper lines used to connect the Internet to the premise. [That’s the same topology used by AT&T’s U-verse in the U.S.]
NBN Co‘s chief network engineering officer Peter Ryan labelled the Australian-made technology a “breakthrough:”
“It allows us to deliver a lot of the benefits of fiber-to-the-premise (FTTP) without the inconvenience of digging front lawns of Australians,” he told reporters. “It allows us to deploy the NBN faster and at a lower cost and complete the network by 2020,” he added.
Testing has seen download speeds of over 100 Mbps and more than 40 Mbps uploads. That could reach a gigabit per second with the addition of new “copper acceleration technology”, which is planned in selected areas by the end of the year.
About one million premises are expected to be connected by 2020, Communications Minister Mitch Fifield said, although that could change. “This is really good news and a further development in the evolution of the NBN,” he told reporters alongside Treasurer Scott Morrison at the launch in Miranda, in Sydney’s south, on Sunday.
nbn™ Fibre to the Curb (FTTC) equipment
For more information, please visit: https://www.nbnco.com.au/learn-about-the-nbn/network-technology/fibre-to-the-curb-explained-fttc.html
………………………………………………………………………………………………………………………………………………………………………………………………………………………….
NBN Co will decide what other locations will get the FTTC broadband access, based on what technology “makes sense” in any given area, Mr. Fifield said. FTTC can deliver the same 100Mbps speeds as fiber-to-the-premise, but at a lower cost, in much less time and with far less disruption to people’s property, he added. Mr Fifield guaranteed all premises would get at least 25 Mbps, with 90 per cent above 50 and 72 per cent at 100 Mbps. “The Turnbull government is keeping broadband bills down and taxes lower by rollout the NBN sooner and more affordably,” he said.
NBN Co’s chief customer officer for residential, Brad Whitcomb, said new “copper acceleration technology” known as G.fast could deliver even faster speeds in selected areas by the end of the year.
Mr Whitcomb said NBN has been working closely with service providers to test the new FTTC over the past few months.
“As with the introduction of any new technology, we will continue to gain insights as we navigate the complexity of the build as well as potential issues which can arise when people connect to the network,” he said in a statement.
Mr. Fifield is confident the network will meet the speed needs of Australians once completed in 2020, but noted NBN Co would pursue upgrade options if needed. “I think the experience people are having today is, overwhelmingly, a good one,” he said.
https://thenewdaily.com.au/news/state/nsw/2018/04/08/nbn-fttc-sydney-melbourne/
CCS Insight: Europe will fall behind China & U.S. in 5G
Researchers at CCS Insight have released a report predicting that Europe will fall behind in the rollout of “5G.” The market research firm predicts the U.S. and China will lead the way in deploying the next generation of mobile technology known as “5G.” Initial commercial deployments in the U.S. are expected this year, but China is set to overtake in connection volume by 2020.
CCS Insight’s forecast of an initial U.S. lead corroborates with a report from the GSMA at the end of March 2018 — but the firms appear to disagree in the rest of their rankings in the period leading to 2025.
In the GSMA’s report, China falls to fourth place — behind Europe — by 2025 with 25 percent of mobile connections being 5G. Europe fares slightly better with 31 percent, Japan with 45 percent, and the United States leading with 49 percent.
This author believes China will be #1 in “5G” deployment, even if the network operators there use a pre-standard RAN/RIT for mobile access.
Kester Mann, Principal Analyst covering operators at CCS Insight, said in the firm’s report:
“The industry might be struggling to establish the business models for investment in 5G, but this isn’t stopping leading operators battling for bragging rights to launch the first networks. Competitive forces and the need for capacity are the leading drivers of early deployment, although we caution this could set unrealistic expectations for initial network capability.”
The chart below provides a summary of CCS Insight’s 5G forecast up to 2025:
 As per the above chart, CCS predicts adoption of 5G will not really start ramping up until 2021, which is what we’ve been saying for MANY YEARS!
“The industry might be struggling to establish the business models for investment in 5G, but this isn’t stopping leading operators battling for bragging rights to launch the first networks,” said Kester Mann of CCS Insight. “Competitive forces and the need for capacity are the leading drivers of early deployment, although we caution this could set unrealistic expectations for initial network capability.”
CCS forecasts that while the early launches might be in the US, Korea and Japan, China should storm to the front of the 5G pack. Estimates predict 5G in the country would hit 100 million connections in 2021 before passing 1 billion in 2025. Despite most other markets having launched commercial services by 2025, China will still account for nearly four in every 10 global 5G connections.
“We see the first 5G smartphones emerging in 2019, but these will be relatively few in number,” comments Marina Koytcheva, VP of Forecasting at CCS Insights. “The real ramp-up will come in 2021 when over 350 million 5G handsets will be sold worldwide.”
The bulk of adoption is not expected to be driven by innovative new technologies such as autonomous vehicles and remote healthcare, but rather by the need for higher speeds and bandwidth to support mobile video consumption. Even in 2025, mobile broadband is still predicted to represent 98 percent of all 5G connections.
References:
https://www.telecomstechnews.com/news/2018/apr/06/ccs-insight-europe-behind-5g/
https://www.digitaltveurope.com/2018/04/06/ccs-insight-5g-connections-to-reach-60m-in-2020/
http://telecoms.com/488905/research-paints-gloomy-5g-picture-for-europe/
https://www.ccsinsight.com/our-services/5g-networks/3300-quarterly-market-analysis-5g-networks
Vertical Systems Group: U.S. Business Fiber Availability Reaches 54.8%
The availability of optical fiber connectivity to large and medium size commercial buildings in the U.S. jumped to 54.8% in 2017, based on latest research from Vertical Systems Group. AT&T, Verizon and CenturyLink’s aggressive build-outs of fiber into commercial buildings have continued to increase the availability of fiber connectivity.
As a result, the U.S. Fiber Gap has dropped to less than fifty percent (45.2%) for the first time. This annual benchmark quantifies the scope of fiber lit buildings in the U.S. with twenty or more employees. Encompassing more than two million individual business establishments, this base of commercial buildings maps directly to the addressable market for higher speed Carrier Ethernet, Cloud, Data Center, Hybrid VPN and emerging SDN-enabled services.
“More commercial U.S. buildings were newly lit with fiber during 2017 than in any other year since we initiated this research in 2004…..
AT&T told investors that it reached 400,000 business buildings with its own lit fiber facilities. Due to AT&T’s aggressive build-out, the service provider now covers over 1.8 million U.S. business customer locations. The telco said it is “adding thousands more buildings each month.”
CenturyLink and Verizon took the M&A path to enhance their on-net fiber holdings.
In a huge M&A deal, CenturyLink’s purchase of Level 3 increased its on-net building reach by nearly 75% to approximately 100,000 buildings, including 10,000 buildings in EMEA and Latin America, which gives the #3 U.S. telco a larger footprint to deliver carrier Ethernet and software-defined network services.
Verizon’s purchase of XO Communications gave the telco additional metro fiber networks in 40 major U.S. markets with over 4,000 on-net buildings and 1.2 million fiber miles.
Consolidated Communications also enhanced its on-net fiber holdings via its acquisition of FairPoint. By acquiring FairPoint, Consolidated immediately established itself as the ninth largest fiber player with a presence in 24 states and 8,000 on-net buildings.
This greater density will enable Consolidated to pursue more dark fiber and lit Ethernet service opportunities with a larger mix of business and wholesale customers.
What was also notable about this year’s M&A on-net building rush was the presence of nontraditional players like Uniti Fiber, which acquired two regional fiber providers, Southern Light and Hunt Telecom. These two deals give the REIT more fiber to pursue a mix of wireless, E-Rate, military, enterprise and wholesale opportunities, including fiber-to-the-tower backhaul, small cell networks and dark fiber. The acquisition of Southern Light in particular gives Uniti access to an additional 4,500 on-net locations.
Fueling Ethernet, 5G deployments
Having more available on-net fiber is another factor that plays into service providers’ U.S. Ethernet service reach and 5G plans by creating pipes through which wireless operators can build small cell and distributed antenna systems (DAS) to improve wireless coverage in business buildings.
Encompassing more than 2 million individual business establishments, this base of commercial buildings maps directly to the addressable market for higher speed carrier Ethernet, cloud, data center, hybrid VPN and emerging SDN-enabled business services.
Several of the service providers that have high on-net fiber building counts represent some of the largest Ethernet providers in the U.S.
On the Ethernet end, AT&T, CenturyLink and Verizon continue to demand high spots in the Ethernet space. However, the effect of M&A clearly has altered the Ethernet landscape.
CenturyLink knocked AT&T from its nearly 13-year reign as the top domestic Ethernet provider in the U.S. by completing its acquisition of Level 3 Communications. The service provider’s move up the ranks of VSG’s year-end 2017 U.S. Ethernet Leaderboard was also a function of continued growth in Ethernet ports for both companies. Earlier, Level 3 ranked second to AT&T and CenturyLink ranked fifth on the Mid-2017 U.S. Ethernet Leaderboard.
But Ethernet is only one factor driving ongoing on-net fiber builds. Cochran noted in an e-mail to FierceTelecom that “larger providers larger providers are accelerating deployments” to position themselves for 5G.
Verizon, for example, acquired WideOpenWest’s fiber assets in Chicago, securing fiber to more than 500 macro-cell wireless sites and more than 500 small-cell wireless sites in the area.
Crown Castle advanced its fiber standing by acquiring Lightower—a deal that gave it greater fiber density to address businesses and its traditional wireless business customers deploying small cells in buildings. This acquisition gave Crown Castle rights to approximately 60,000 route miles of fiber, with a presence in all the top 10 and 23 of the top 25 metro markets.
As the expectations for higher speed Ethernet, cloud and in-building wireless coverages continues to ramp, service providers will continue to further narrow the fiber gap inside buildings. But unlike the speculative builds of the 1990s, these are focused on bandwidth hungry applications that are showing no signs of slowing.
Editor’s Note:
For this Vertical Systems Group analysis, a fiber lit building is defined as a commercial site or data center that has on-net optical fiber connectivity to a network provider’s infrastructure, plus active service termination equipment onsite. Excluded from this analysis are standalone cell towers, small cells not located in fiber lit buildings, near net buildings, buildings classified as coiled at curb or coiled in building, HFC-connected buildings, carrier central offices, residential buildings, and private or dark fiber installations.
References:
Telstra Launches 5G Enabled WiFi Hotspots without 5G Devices; 5G Connected Car Up Next
Australia’s Telstra has launched what it says are the first “5G-enabled” Wi-Fi hotspots in the world. The new hotspots on the Gold Coast in Queensland, Australia will provide locals and visitors with access to free broadband services during the evaluation period. While there are no 5G-enabled consumer devices available at this time, the Australian telco will connect 5G backhaul and infrastructure from an exchange to a Wi-Fi access point, so it can be used on existing 4G devices.
The open hotspots will provide up to 10GB of downloads per device per day. They will be managed by Telstra’s recently-launched 5G innovation center on the Gold Coast. Telstra has connected 5G backhaul and related infrastructure in the Southport Exchange in the city to allow connections to the 5G network over Wi-Fi on existing devices.
“Wi-Fi has limited throughput so a single hotspot alone cannot come close to reaching the limits of 5G at our Innovation Center,” Telstra group managing director for networks Mike Wright said. “By using multiple hotspots with potentially hundreds of smartphone users served through a single 5G device we are able to get closer to demonstrating 5G in a real world environment. Our 5G backhaul is capable of delivering download speeds of more than 3 Gbps,” he added.
Telstra is also using mmWave spectrum and its 5G innovation centre to put a connected car on the road using Intel’s 5G automotive trial platform.
“Working with global technology companies Ericsson and Intel, we have put Australia’s first 5G connected car on the road. We are in the very early stages of development and are achieving download speeds approaching 1 Gbps inside the car and the vehicle is also equipped with a Wi-Fi access point,” Wright said.
The executive also highlighted the evolution of the telco’s 5G prototype during the first months of the year. “At the start of the year our 5G prototype device was the size of a bar fridge and weighed more than 200 kilograms. Now, in collaboration with Intel and Ericsson, we have one that has been shrunk down to the size of a personal computer and can be installed in a car.”
The 5G center is central to a $58 million investment Telstra has made to upgrade infrastructure on the Gold Coast to support growing demand and major events in the area. Telstra will run extensive 5G trials on the Gold Coast during the Commonwealth Games in April this year.
Telstra previously said that said that it would work with Ericsson on key 5G technologies including massive multiple-input, multiple-output (Massive MIMO), adaptive beamforming and beam tracking, and OFDM-based waveforms in its Gold Coast center.
Reference:
https://www.telstra.com.au/aboutus/media/media-releases/Telstra-offers-Australias-first-taste-of-5G
…………………………………………………………………………………………………………………………………………………………………
Telstra will have competition. Australian telecom operator Optus said it plans to roll out a fixed-wireless 5G service in key metro areas by early 2019. The announcement comes after the launch of an outdoor trial of 5G New Radio (NR), which showed 2Gbps download speeds for a fixed wireless service in homes and businesses, the Singtel subsidiary said.
The trial, conducted at its headquarters in Macquarie Park in Sydney in January, used dual-band 5G NR equipment and commercial grade CPEs for both C-band and millimeter wave band frequencies. C-band is within the same spectrum range of Optus’ 3.5GHz, which has been earmarked for 5G deployment, the operator said. The mmWave band 5G network has the capability to reach peak data speeds of 15Gbps to a single user, which is 15x what 4.5G is capable of today.
“Everyone has heard of concepts like self-driving cars, smart homes, AI and virtual reality however their full potential will require a fast and reliable network to deliver,” said Optus managing director of networks Dennis Wong.
“Seeing 5G data speeds through our trial that are up to 15x faster than current technologies allows us to show the potential of this transformative technology to support a new ecosystem of connected devices in the home, the office, the paddock and in the wider community.”
Optus will also be hosting a 5G technology showcase during the 2018 Commonwealth Games, which will be held on the Gold Coast in Queensland from April 4 to 15 (this week and next).
Reference:
https://www.telecomasia.net/content/optus-launch-fixed-wireless-5g-service-2019
FCC Acts to Speed Deployment of Next-Gen Wireless Infrastructure; Interview with FCC Chair Ajit Pai
Accelerating Wireless Broadband Deployment by Removing Barriers to Infrastructure Investment, Second Report and Order
The Federal Communications Commission (FCC) recently adopted new rules streamlining the wireless infrastructure siting review process to facilitate the
deployment of next-generation wireless facilities. The FCC Order focuses on ensuring the Commission’s rules properly address the differences
between large and small wireless facilities, and clarifies the treatment of small cell deployments.
Specifically, the Order:
Excludes small wireless facilities deployed on non-Tribal lands from National Historic Preservation Act (NHPA) and National Environmental Policy Act (NEPA) review, concluding that these facilities are not “undertakings” or “major federal actions.”
Small wireless facilities deployments continue to be subject to currently applicable state and local government approval requirements.
Clarifies and makes improvements to the process for Tribal participation in Section 106 historic preservation reviews for large wireless facilities where NHPA/NEPA review is still required.
Removes the requirement that applicants file Environmental Assessments solely due to the location of a proposed facility in a floodplain, as long as certain conditions are met.
Establishes timeframes for the Commission to act on Environmental Assessments.
The FCC said that those actions will reduce regulatory impediments to deploying small cells needed for 5G and help to expand the reach of 5G for faster, more reliable wireless service and other advanced wireless technologies to more Americans.
Statement by FCC Chairman Ajit Pai:
Re: Accelerating Wireless Broadband Deployment by Removing Barriers to Infrastructure Investment, WT Docket No. 17-79
If the United States is going to lead the world in 5G, we need to modernize our wireless infrastructure regulations. Our efforts to unleash spectrum for consumer use are necessary, but they aren’t sufficient to secure our 5G future. In fact, they’ll be pointless if carriers can’t deploy the physical infrastructure needed to bring next-generation services to the American people.
And unfortunately, our current wireless infrastructure rules are a poor fit for the 5G networks of the future. They were designed with 200-foot towers in mind, not the highly-densified networks of small cells that will be common in the 5G world.
That’s why today’s Order is so important. We take a giant leap forward in updating our wireless infrastructure rules. By cutting unnecessary red tape, we’ll make it substantially easier for carriers to build next-generation wireless networks throughout the United States. That means faster and more reliable wireless services for American consumers and businesses. That means more wireless innovation, such as novel applications based on the Internet of Things. And ultimately, that means American leadership in 5G.
Specifically, we clarify today that small cells are inherently different from large towers. So they shouldn’t face identical regulatory review under the National Historic Preservation Act and National Environmental Policy Act. We also streamline the process for Tribal review notifications through our Tower Construction Notification System……………………..
* * *
Lately, there’s been a lot of talk about American leadership in 5G. But talk is cheap; action is what actually matters. And now is the time for action. A vote for this Order is a vote for concrete action that will help toohe United States lead the world in 5G. It’s a vote for better, faster, and cheaper mobile broadband for the American people. It’s a vote for making the United States the best home for wireless innovation and investment. And it’s a vote to extend digital opportunity to more of our citizens. That future is a bright one, and it’s one I’m determined to deliver by supporting this Order.
Read more at: https://transition.fcc.gov/Daily_Releases/Daily_Business/2018/db0330/FCC-18-30A2.pdf
Related: Ken Pyle’s interview with FCC Chair Pai on Digital Opportunities through Grassroots Efforts
and this article: Will the FCC Amend Rules for Small Cells….
…………………………………………………………………………………………………………………………………………………………………………………….
Addendum:
According to Lightreading, AT&T has applied to the FCC for an experimental radio license to hold “5G” related tests in Burbank, CA using 28GHz base stations and terminals, connecting within 100 meters of the base station.
FCC approves SpaceX plan for low orbit broadband satellite network
On Thursday the FCC gave formal approval to a plan by SpaceX to build a global broadband satellite network using low-Earth orbit satellites. The FCC order approving SpaceX’s application came with some conditions, like avoiding collisions with orbital debris in space. Some of the other conditions imposed by the FCC relate to signal power levels and preventing interference with other communications systems in various frequency bands.
SpaceX intends to start launching operational satellites as early as 2019, with the goal of reaching the full capacity of 4,425 satellites in 2024. The FCC approval just requires SpaceX to launch 50 percent of the satellites by March 2024, and all of them by March 2027. SpaceX has been granted authority to use frequencies in the Ka (20/30 GHz) and Ku (11/14 GHz) bands.
“This is the first approval of a U.S.-licensed satellite constellation to provide broadband services using a new generation of low-Earth orbit satellite technologies,” the Federal Communications Commission said in a statement.
The Federal Aviation Administration said on Wednesday that SpaceX plans to launch a Falcon 9 rocket on April 2 at Cape Canaveral, Florida. “The rocket will carry a communications satellite,” the FAA said.
FCC Chairman Ajit Pai in February had endorsed the SpaceX effort, saying: “Satellite technology can help reach Americans who live in rural or hard-to-serve places where fiber optic cables and cell towers do not reach.”
About 14 million rural Americans and 1.2 million Americans on tribal lands lack mobile broadband even at relatively slow speeds.
FCC Commissioner Jessica Rosenworcel, a Democrat, said on Thursday that the agency needs “to prepare for the proliferation of satellites in our higher altitudes.” She highlighted the issue of orbital debris and said the FCC “must coordinate more closely with other federal actors to figure out what our national policies are for this jumble of new space activity.”

SpaceX’s network (known as “Starlink”) will need separate approval from the International Telecommunication Union (ITU). The FCC said its approval is conditioned on “SpaceX receiving a favorable or ‘qualified favorable’ rating of its EPFD [equivalent power flux-density limits] demonstration by the ITU prior to initiation of service.” SpaceX will also have to follow other ITU rules.
Like other operators, SpaceX will have to comply with FCC spectrum-sharing requirements. Outside the US, coexistence between SpaceX operations and other companies’ systems “are governed only by the ITU Radio Regulations as well as the regulations of the country where the earth station is located,” the FCC said.
SpaceX and several other companies are planning satellite broadband networks with much higher speeds and much lower latencies than existing satellite Internet services. SpaceX satellites are planned to orbit at altitudes of 1,110km to 1,325km, whereas the existing HughesNet satellite network has an altitude of about 35,400km.
SpaceX has said it will offer speeds of up to a gigabit per second, with latencies between 25ms and 35ms. Those latencies would make SpaceX’s service comparable to cable and fiber, while existing satellite broadband services have latencies of 600ms or more, according to FCC measurements.
“SpaceX states that once fully deployed, the SpaceX system… will provide full-time coverage to virtually the entire planet,” the FCC order said.
The FCC previously approved requests from OneWeb, Space Norway, and Telesat to offer broadband in the US from low-Earth orbit satellites. SpaceX is the first US-based operator to get FCC approval for such a system, the FCC said in an announcement.
“These approvals are the first of their kind for a new generation of large, non-geostationary satellite orbit [NGSO], fixed-satellite service [FSS] systems, and the Commission continues to process other, similar requests,” the FCC said.
SpaceX launched the first demonstration satellites for its broadband project last month. In addition to the 4,425 satellites approved by the FCC, SpaceX has also proposed an additional 7,500 satellites operating even closer to the ground, saying that this will boost capacity and reduce latency in heavily populated areas. It’s not clear when those satellites will launch.
Space debris
FCC approval of SpaceX’s application was unanimous. But the commission still has work to do in preventing all the new satellites from crashing into each other, FCC Commissioner Jessica Rosenworcel said.
“The FCC has to tackle the growing challenge posed by orbital debris. Today, the risk of debris-generating collisions is reasonably low,” Rosenworcel said. “But they’ve already happened—and as more actors participate in the space industry and as more satellites of smaller size that are harder to track are launched, the frequency of these accidents is bound to increase. Unchecked, growing debris in orbit could make some regions of space unusable for decades to come. That is why we need to develop a comprehensive policy to mitigate collision risks and ensure space sustainability.”
FCC rules on satellite operations were originally “designed for a time when going to space was astronomically expensive and limited to the prowess of our political superpowers,” Rosenworcel said. “No one imagined commercial tourism taking hold, no one believed crowd-funded satellites were possible, and no one could have conceived of the sheer popularity of space entrepreneurship.”
SpaceX still needs to provide an updated debris prevention plan as part of a condition the FCC imposed on its approval.
The commission order said:
Although we appreciate the level of detail and analysis that SpaceX has provided for its orbital debris mitigation and end-of-life disposal plans, we agree with NASA that the unprecedented number of satellites proposed by SpaceX and the other NGSO FSS systems in this processing round will necessitate a further assessment of the appropriate reliability standards of these spacecraft, as well as the reliability of these systems’ methods for de-orbiting the spacecraft. Pending further study, it would be premature to grant SpaceX’s application based on its current orbital debris mitigation plan. Accordingly, we believe it is appropriate to condition grant of SpaceX’s application on the Commission’s approval of an updated description of the orbital debris mitigation plans for its system.
The approval of SpaceX’s application is conditioned on the outcome of future FCC rulemaking proceedings, so SpaceX would have to follow any new orbital debris rules passed by the FCC. We detailed the potential space debris problem in a previous article. Today, there are more than 1,700 operational satellites orbiting the Earth, among more than 4,600 overall, including those that are no longer operating.
SpaceX’s plan alone would nearly double the total number of orbiting satellites. SpaceX told the FCC that it has plans “for the orderly de-orbit of satellites nearing the end of their useful lives (roughly five to seven years) at a rate far faster than is required under international standards.”
Opposition from competitors
SpaceX’s application drew opposition from other satellite operators, who raised concerns about interference with other systems and debris. The FCC dismissed some of the complaints. For example, OneWeb wanted an unreasonably large buffer zone between its own satellites and SpaceX’s, the FCC said:
[T]he scope of OneWeb’s request is unclear and could be interpreted to request a buffer zone that spans altitudes between 1,015 and 1,385 kilometers. Imposition of such a zone could effectively preclude the proposed operation of SpaceX’s system, and OneWeb has not provided legal or technical justification for a buffer zone of this size. While we are concerned about the risk of collisions between the space stations of NGSO systems operating at similar orbital altitudes, we think that these concerns are best addressed in the first instance through inter-operator coordination.
If operators fail to agree on a coordination plan in the future, “the Commission may intervene as appropriate,” the FCC said.
JEDEC Forum: AI/Deep Learning, New IT Requirements for Edge Computing & MIPI Alliance for Mobile and IoT- Part II.
Introduction:
In this second of two articles on the JEDEC Mobile & IOT Forum we summarize three tutorials on I. AI/Deep Learning; II. Edge Computing requirements for the IoT and other latency sensitive or high bandwidth applications; and III. the MIPI Alliance for Mobile and IoT applications. The first article can be read here.
I. Making Sense of Artificial Intelligence – A Practical Guide:
This keynote presentation by Young Paik of Samsung was the clearest one I’ve ever heard on Artificial Intelligence (AI) – one of the most hyped and fudged technologies today. Although it has existed in many forms for decades (this author took a grad course in AI in 1969), recent advances in Deep Learning (DL) and neural net processors have finally made it marketable. According to Young, there is real promise for AI and DL, but there are also real limitations. His talk provided an introductory overview of how AI and DL works today and some insights into different deployment scenarios.
DL has enabled AI to approach human level accuracy, as per this illustration:
A high level AI functional flow (but not implementation) and the Circle of Deep Learning (DL) Life are shown in the two graphics below.
In the second slide below, note that DL models need to be constantly fed data. A home thermostat is used as an example:

………………………………………………………………………………………………………………………………………………………………………………………..

Mr. Paik’s said there are three takeaways from his talk:
1. Data is King: The more data => greater the accuracy.
2. Deep Learning is hard. Best to leave it to the professionals.
3. You don’t have to use one AI: Many, smaller AIs are better than one big one.
…………………………………………………………………………………………………………………………………………………………………
The following illustration proposes functional blocks for implementing mobile speech recognition:

…………………………………………………………………………………………………………………………………………………………………………………………………
Two ways to improve DL are: Transfer Learning (take a pre-trained DL model and retrain it with new data) and Model Compressions (selectively remove weights and nodes which may not be important). Those “tricks” would permit you to remove several functional blocks in the previous illustration (above).
……………………………………………………………………………………………………………………………………………………………………………………………….
Finding new ways of using old tech and making use of multiple types of AI are shown in the following two figures:

…………………………………………………………………………………………………………………………………………………………………………………………………
Four different use cases or applications of AI are shown in this slide:

……………………………………………………………………………………………………………………………………………………………………………………………….
In conclusion Young suggested the following:
• AI is still early in its development.
• Design of AI systems is evolving.
• You may find new uses for old ideas.
…………………………………………………………………………………………………………………………………………………………………………………………
II. A Distributed World – the New IT Requirements of Edge Computing:
The number of distributed, connected data sources throughout the world has been multiplying rapidly and are creating tremendous amounts of data. IoT has now given rise to a new trend of aggregating, computing, and leveraging data closer to where it is generated – at the IT “Edge” – between the Cloud and the IoT endpoint device. This presentation by Jonathan Hinkle of Lenovo provided insights into the new IT requirements for edge computing systems and models for how they are and will be used.
Jonathan asked: How do we leverage our IT resources to unlock the value of all the data now being generated?
Ideally, we should be able to gain many things from analyzing “big data” which includes: Business Insights, Optimize Services, Recognize Behaviors, and Identify Problems (when they occur).
IoT Architecture Components include:
- Software: Analytics, Applications, Platforms
- Security, Networking, Management
- IoT Endpoint devices (“things”)
- Edge IT (especially for low latency applications)
- Core network and cloud IT
The functions required from the IoT endpoints to the cloud are: Generate Data /Automate / Control / Pre-process / Aggregate / Analyze / Store / Share the data. Observations:
- It costs time, money, and power to move data.
- Best practice: move data when useful or necessary
- Reduce data set required to be forwarded to each stage
Keeping data local (instead of backhauling it to the cloud for processing/analysis) requires:
- Store data nearer to sources (IoT endpoints) whenever possible. This is accomplished by filtering data at the edge such that less data (to be analyzed by powerful compute servers) are sent upstream to the cloud.
- Maintain fast action on time-sensitive data by doing computation immediately instead of moving the data first.
In conclusion, Mr. Hinkle said that data growth will continue as the sources multiply – both from computing sources (e.g. smart phones, tablets, other handheld gadgets) and IoT endpoints which produce digital data to represent our analog world. “Edge IT infrastructure will enable us to scale with that data growth and unlock its inherent value.”
Author’s Note: Mr. Hinkle did not touch on how much, if any, AI/DL would be implemented in the “Edge IT infrastructure.” Unfortunately, the moderator didn’t permit time for questions like that one to be addressed.
……………………………………………………………………………………………………………………………………………………………………………………..
III. MIPI Alliance – How Mobile Specifications are Driving IOT:
Peter Lefkin, Managing Director of MIPI Alliance, provided an overview of the MIPI Alliance and Specifications. Additional context, background and a a look ahead at the implementation of MIPI Specifications in mobile influenced industries such as IoT and automotive was also described.
MIPI Alliance specifications are developed for mobile devices as the primary target though MIPI Alliance members have leveraged and evolved their investments in mobile to other platforms including automotive and IoT.
For in IoT devices, MIPI specifications are implemented for various applications such as: augmented and virtual reality, wearables, and other low power and sensor connected devices.
Within automotive, automobiles have become a new platform for innovation and manufacturers are implementing MIPI specifications to develop applications for infotainment, advanced driver assistance systems (ADAS), and safety. Interconnected components for these applications include high-performance cameras and imaging sensors, infotainment and dashboard displays, telematics hubs among others.
Automotive and IoT platforms are heavily reliant on sensors and MIPI specifications will play a key role enabling sensor-based applications and connected devices.
Backgrounder:
MIPI is a global, collaborative organization founded in 2003 that comprises 312 member companies spanning the mobile and mobile ecosystems, including the Internet of Things IoT).
MIPI’s mission: To provide the hardware and software interface specifications device vendors need to create state-of-the-art, innovative mobile-connected devices while accelerating time-to-market and reducing costs.
In particular, the MIPI Alliance:
- Defines and promotes specifications focusing on the mobile interface but applicable to IoT, Auto, etc.
- Complements official standards bodies through collaboration.
- Provides members with access to licenses as needed to implement and market specified technologies.
The MIPI membership list is at: https://mipi.org/membership/member-directory
MIPI Alliance for Mobile and IoT:
The MIPI Alliance serves the mobile industry and the ecosystem of mobile-influenced industries that are developing connected devices for vertical markets and the IoT..
MIPI specifications are crafted such that compliant devices have: high-bandwidth performance, low power consumption, and low electromagnetic interference (EMI). Here’s a MIPI Alliance mobile systems diagram:

https://www.mipi.org/sites/default/files/MIPI_SystemDiagram_Oct17..jpg
………………………………………………………………………………………………………………………………………………………………
Other Presentations:
Here are a few abstracts of presentations that may be of interest to IEEE techblog readers:
Comprehensive ARM Solutions for Innovative ML & AI Applications:
With the advent of AI and the explosion of ML/CV applications, there is greater demand for system solutions to enable vendors to get to market quickly. ARM is working on holistic system enablement, while allowing the flexibility and scope to incorporate additional hardware and software optimizations into customer platforms. This talk will discuss the work ARM has been doing in these areas to provide options for a stable and efficient software and hardware architecture.
Presenter: Ray Hwang, ARM
……………………………………………………………………………………………………………
Watts the Difference?
The challenge of designing to mobile and internet of things (IoT) markets is always the same question: How do you deliver a solution with the right combination of operating power, standby power, and environmental tolerance and yet provide memory capacity and performance? Hybrid combinations of DRAM, NAND, and NOR technologies have traditionally been used to balance these factors with varying degrees of success. Carbon nanotube memory (NRAM) allows designers to simplify the formula with a high capacity non-volatile memory device boasting DRAM-class performance and a high tolerance for heat.
Presenter: Bill Gervasi, Nantero
…………………………………………………………………………………………………………..
Flash Storage and Sensor Interfaces for Mobile and IoT SoCs:
Storage devices are a vital component of an electronic system for a variety of applications, and with today’s demand for faster boot-up and data transfer, choosing an optimized storage device has become a challenge for designers. For example, for mainstream smartphones, embedded technologies like eMMC has become the de facto storage device of choice due to its high-speed connectivity up to 400MB/s and cost-effectiveness. On the other hand, for high-end smartphones, UFS has become a robust option due to its unique high-performance, low-power and scalability advantages. Today, the use of such mobile storage devices extends into new applications like automotive and IoT. This presentation will describe each mobile storage specification and illustrate their unique use-cases and features such as command queuing, inline encryption and high bandwidth for mobile applications and beyond.
Presenter: Licinio Sousa, Synopsys
…………………………………………………………………………………………………….
