

Broadband Status
Ookla Ranks Internet Performance in the World’s Largest Cities: China is #1
Internet connectivity benchmarking firm Ookla, which maintains the popular Speedtest.net service, has updated their ranking of broadband performance in countries around the world to include internet speed rankings for some of the “world’s largest cities.” Ookla’s new list ranks median internet download speeds in nearly 200 cities all over the world.
Overall, China topped the list with Shanghai as the fastest city on their list for mobile broadband with a median download speed of 158.63Mbps (24.32Mbps upload and 17ms latency), while Beijing was fastest for fixed broadband during September 2022 at 238.86Mbps (37.75Mbps upload and 7ms latency).
Beijing (China) and Valparaiso (Chile) were ranked highest in the fixed broadband category, with average speeds of 239 Mbps and 223 Mbps, respectively, followed by Shanghai (222 Mbps), New York (218 Mbps), Bangkok (217 Mbps) and Madrid (197 Mbps).
Fastest Broadband Speeds for the World’s Largest Cities 2022
| Fastest Cities for Mobile (Mbps) | Fastest Cities for Fixed Broadband (Mbps) | ||
| Shanghai, China | 158.63 | Beijing, China | 238.86 |
| Copenhagen, Denmark | 157.54 | Valparaíso, Chile | 222.67 |
| Oslo, Norway | 155.19 | Shanghai, China | 221.85 |
| Busan, South Korea | 147.55 | New York, United States | 218.04 |
| Beijing, China | 145.76 | Bangkok, Thailand | 217.19 |
| Sofia, Bulgaria | 145.28 | Madrid, Spain | 196.7 |
| Ar-Rayyan, Qatar | 140.69 | Bucharest, Romania | 195.6 |
| Abu Dhabi, United Arab Emirates | 137.48 | Lyon, France | 193.34 |
| Dubai, United Arab Emirates | 135.52 | Chon Buri, Thailand | 188.25 |
| Riyadh, Saudi Arabia | 133.65 | Tokyo, Japan | 185.04 |
| Stockholm, Sweden | 126.4 | Los Angeles, United States | 184.15 |
| Antwerp, Belgium | 121.33 | Geneva, Switzerland | 182.84 |
| Gothenburg, Sweden | 120.71 | Abu Dhabi, United Arab Emirates | 178.17 |
| Doha, Qatar | 114 | Zürich, Switzerland | 177.6 |
| Seoul, South Korea | 113.36 | Santiago, Chile | 176.58 |
| Melbourne (Greater), Australia | 111.78 | Copenhagen, Denmark | 175.31 |
| Sydney, Australia | 108.04 | Barcelona, Spain | 173.71 |
| New York, United States | 106.57 | Osaka, Japan | 169.18 |
| Rotterdam, Netherlands | 100.85 | Toronto, Canada | 164.93 |
| Skopje, North Macedonia | 99.02 | Paris, France | 155.24 |
| Toronto, Canada | 98.29 | Auckland, New Zealand | 149.22 |
| Amsterdam, Netherlands | 96.79 | Budapest, Hungary | 147.82 |
| Los Angeles, United States | 95.4 | Taipei, Taiwan | 144.35 |
| Zürich, Switzerland | 89.17 | Kraków, Poland | 138.75 |
| Montreal, Canada | 84.25 | Warsaw, Poland | 138.64 |
| Helsinki, Finland | 83.57 | São Paulo, Brazil | 124.05 |
| Zagreb, Croatia | 82.36 | Dubai, United Arab Emirates | 118.99 |
| Muscat, Oman | 79.66 | New Taipei, Taiwan | 115.36 |
| Auckland, New Zealand | 77.91 | Gothenburg, Sweden | 111.29 |
| Lisbon, Portugal | 76.23 | Porto, Portugal | 110.91 |
| Manama, Bahrain | 72.72 | Stockholm, Sweden | 109.59 |
| Kuwait City, Kuwait | 72.61 | Haifa, Israel | 108.46 |
| Porto, Portugal | 72.16 | Seoul, South Korea | 106.48 |
| Paris, France | 72.12 | Chisinau, Moldova | 105.05 |
| Jeddah, Saudi Arabia | 71.92 | Panama City, Panama | 104.25 |
| Geneva, Switzerland | 70.88 | Oslo, Norway | 102.76 |
| Berlin, Germany | 70.02 | Montevideo, Uruguay | 102.57 |
| Vilnius, Lithuania | 67.7 | Rio de Janeiro, Brazil | 100.49 |
| Manchester, United Kingdom | 67.07 | Amsterdam, Netherlands | 99.66 |
| London, United Kingdom | 66.36 | Milan, Italy | 98.57 |
| Taipei, Taiwan | 65.18 | Rotterdam, Netherlands | 95.39 |
| Vienna, Austria | 65.08 | Kuwait City, Kuwait | 94.65 |
| New Taipei, Taiwan | 64.69 | Medellín, Colombia | 94.48 |
| Brussels, Belgium | 58.78 | Busan, South Korea | 94.43 |
| Rio de Janeiro, Brazil | 58.64 | Bogotá, Colombia | 94.38 |
| Athens, Greece | 57.23 | Vilnius, Lithuania | 94.28 |
| Hamburg, Germany | 56.77 | Ar-Rayyan, Qatar | 94.16 |
| São Paulo, Brazil | 56.58 | Riyadh, Saudi Arabia | 93.71 |
| Thessaloniki, Greece | 56.57 | Lisbon, Portugal | 93.13 |
| Lyon, France | 56.08 | Dublin, Ireland | 91.63 |
| Prague, Czechia | 55.25 | Moscow, Russia | 91.26 |
| Belgrade, Serbia | 53.27 | Riga, Latvia | 91.14 |
| Bucharest, Romania | 52.03 | Montreal, Canada | 90.06 |
| Osaka, Japan | 51.53 | Kuala Lumpur, Malaysia | 89.38 |
| Milan, Italy | 51.27 | Vienna, Austria | 88.05 |
| Budapest, Hungary | 49.88 | Belgrade, Serbia | 87.88 |
| Tokyo, Japan | 49.86 | Antwerp, Belgium | 87.17 |
| Riga, Latvia | 45.88 | Berlin, Germany | 86.65 |
| Kraków, Poland | 44.42 | Doha, Qatar | 86.62 |
| Warsaw, Poland | 43.48 | Hamburg, Germany | 85.35 |
| Barcelona, Spain | 42.88 | Johor Bahru, Malaysia | 85.03 |
| Rabat, Morocco | 41.98 | Tel Aviv-Yafo, Israel | 84.96 |
| Madrid, Spain | 40.78 | Ho Chi Minh City, Vietnam | 84.32 |
| Johannesburg, South Africa | 40.38 | Helsinki, Finland | 84.11 |
| Hanoi, Vietnam | 40.01 | Saint Petersburg, Russia | 83.33 |
| Rome, Italy | 40 | Amman, Jordan | 80.37 |
| Dublin, Ireland | 39.96 | Kiev, Ukraine | 77.42 |
| Bangkok, Thailand | 39.3 | Jeddah, Saudi Arabia | 76.81 |
| Haifa, Israel | 39.05 | Davao City, Philippines | 75.23 |
| Chon Buri, Thailand | 39.03 | Asuncion, Paraguay | 74.18 |
| Baku, Azerbaijan | 37.12 | London, United Kingdom | 73.93 |
| Tbilisi, Georgia | 37.08 | Hanoi, Vietnam | 73.67 |
| Chisinau, Moldova | 36.3 | Sofia, Bulgaria | 73.66 |
| Ho Chi Minh City, Vietnam | 36.09 | Manila, Philippines | 73.47 |
| Johor Bahru, Malaysia | 35.67 | Manchester, United Kingdom | 73.43 |
| Cape Town, South Africa | 35.42 | Port of Spain, Trinidad and Tobago | 73.2 |
| Ankara, Turkey | 35.27 | Brussels, Belgium | 71.71 |
| Montevideo, Uruguay | 34.82 | Buenos Aires, Argentina | 71.41 |
| Istanbul, Turkey | 34.7 | Muscat, Oman | 69.46 |
| Tehran, Iran | 34.24 | Az-Zarqa, Jordan | 67.53 |
| Guadalajara, Mexico | 32.77 | Kharkiv, Ukraine | 67.05 |
| Mashhad, Iran | 32.71 | Rome, Italy | 64.92 |
| Beirut, Lebanon | 32.35 | Zagreb, Croatia | 63.92 |
| Tel Aviv-Yafo, Israel | 31.69 | Delhi, India | 63.2 |
| Kharkiv, Ukraine | 31.06 | San José, Costa Rica | 61.44 |
| Yangon, Myanmar (Burma) | 30.98 | Prague, Czechia | 60.67 |
| Casablanca, Morocco | 30.84 | Mexico City, Mexico | 59.56 |
| Mosul, Iraq | 30.77 | Minsk, Belarus | 59.14 |
| Sfax, Tunisia | 30.74 | Maracaibo, Venezuela | 57.31 |
| Kuala Lumpur, Malaysia | 30.1 | Guadalajara, Mexico | 55.63 |
| Kingston, Jamaica | 29.89 | Lima, Peru | 53.68 |
| Moscow, Russia | 29.74 | Sydney, Australia | 53.64 |
| Baghdad, Iraq | 29.62 | Melbourne (Greater), Australia | 53.45 |
| Mexico City, Mexico | 28.28 | Arequipa, Peru | 53.4 |
| Mandalay, Myanmar (Burma) | 28.21 | Gomel, Belarus | 52.91 |
| Samarkand, Uzbekistan | 28.2 | Ulaanbaatar, Mongolia | 52.79 |
| Vientiane, Laos | 28.15 | Kathmandu, Nepal | 52.68 |
| Kiev, Ukraine | 28.15 | Guayaquil, Ecuador | 51.87 |
| Guatemala City, Guatemala | 27.89 | Johannesburg, South Africa | 51.79 |
| Buenos Aires, Argentina | 26.49 | Córdoba, Argentina | 51.67 |
| Almaty, Kazakhstan | 26.44 | Alexandria, Egypt | 51.07 |
| Manila, Philippines | 26.16 | Nur-Sultan, Kazakhstan | 50.05 |
| Tunis, Tunisia | 25.87 | Skopje, North Macedonia | 48.09 |
| Córdoba, Argentina | 25.3 | Bishkek, Kyrgyzstan | 47.85 |
| Valparaíso, Chile | 24.16 | Manama, Bahrain | 47.69 |
| Yerevan, Armenia | 23.98 | Quito, Ecuador | 47.36 |
| Tegucigalpa, Honduras | 23.93 | Almaty, Kazakhstan | 47.21 |
| Luanda, Angola | 23.93 | Tashkent, Uzbekistan | 46.27 |
| San Pedro Sula, Honduras | 23.83 | Kingston, Jamaica | 45.75 |
| Santo Domingo, Dominican Republic | 23.81 | Thessaloniki, Greece | 44.35 |
| Santiago De Los Caballeros, Dominican Republic | 23.64 | Mumbai, India | 43.56 |
| Saint Petersburg, Russia | 21.19 | Ouagadougou, Burkina Faso | 43.14 |
| San Salvador, El Salvador | 20.58 | Managua, Nicaragua | 42.68 |
| Alexandria, Egypt | 20.46 | Dhaka, Bangladesh | 40.38 |
| Cairo, Egypt | 20.43 | Yerevan, Armenia | 40.34 |
| Az-Zarqa, Jordan | 20.4 | Athens, Greece | 40 |
| Davao City, Philippines | 20.35 | Cape Town, South Africa | 39.5 |
| Amman, Jordan | 20.13 | Abidjan, Côte d’Ivoire | 38.44 |
| Kampala, Uganda | 20.01 | Ankara, Turkey | 37.42 |
| Santiago, Chile | 19.87 | Istanbul, Turkey | 36.75 |
| Nur-Sultan, Kazakhstan | 19.79 | Libreville, Gabon | 36.13 |
| Phnom Penh, Cambodia | 18.94 | Tegucigalpa, Honduras | 33.55 |
| Quito, Ecuador | 18.89 | Antananarivo, Madagascar | 33.34 |
| Lagos, Nigeria | 18.85 | Chittagong, Bangladesh | 33.02 |
| Managua, Nicaragua | 18.64 | Lome, Togo | 31.97 |
| Bishkek, Kyrgyzstan | 18.37 | Samarkand, Uzbekistan | 31.58 |
| Addis Ababa, Ethiopia | 17.29 | San Pedro Sula, Honduras | 31.53 |
| Abidjan, Côte d’Ivoire | 17.22 | San Salvador, El Salvador | 31.36 |
| San José, Costa Rica | 17.21 | Santo Domingo, Dominican Republic | 30.87 |
| Nairobi, Kenya | 17.09 | Pointe-Noire, Congo | 30.11 |
| Colombo, Sri Lanka | 16.95 | Guatemala City, Guatemala | 29.53 |
| Tashkent, Uzbekistan | 16.69 | Vientiane, Laos | 29.04 |
| Guayaquil, Ecuador | 16.6 | Accra, Ghana | 28.71 |
| Bekasi, Indonesia | 16.47 | Baku, Azerbaijan | 28.69 |
| Misrata, Libya | 16.46 | Brazzaville, Congo | 27.55 |
| South Jakarta, Indonesia | 16.14 | Bekasi, Indonesia | 27.04 |
| Dakar, Senegal | 16.13 | South Jakarta, Indonesia | 27 |
| Asuncion, Paraguay | 15.93 | Santa Cruz de la Sierra, Bolivia | 26.28 |
| Ulaanbaatar, Mongolia | 15.8 | Tbilisi, Georgia | 26.12 |
| Panama City, Panama | 15.75 | Bamako, Mali | 24.37 |
| Oran, Algeria | 15.57 | Dakar, Senegal | 23.41 |
| Lahore, Pakistan | 15.01 | La Paz, Bolivia | 23.25 |
| Delhi, India | 14.99 | Cairo, Egypt | 22.42 |
| Dhaka, Bangladesh | 14.98 | Nouakchott, Mauritania | 21.75 |
| Kathmandu, Nepal | 14.94 | Baghdad, Iraq | 21.58 |
| Lima, Peru | 14.65 | Casablanca, Morocco | 20.23 |
| Dar es Salaam, Tanzania | 14.51 | Phnom Penh, Cambodia | 19.78 |
| Arequipa, Peru | 13.5 | Dushanbe, Tajikistan | 19.61 |
| Algiers, Algeria | 13.49 | Mandalay, Myanmar (Burma) | 19.37 |
| Damascus, Syria | 12.83 | Yangon, Myanmar (Burma) | 19.03 |
| Tripoli, Libya | 12.36 | Rabat, Morocco | 17.57 |
| Mumbai, India | 12.29 | Colombo, Sri Lanka | 16.65 |
| Bogotá, Colombia | 11.99 | Cotonou, Benin | 15.97 |
| Karachi, Pakistan | 11.92 | Karachi, Pakistan | 14.82 |
| Minsk, Belarus | 11.33 | Port-au-Prince, Haiti | 14.7 |
| La Paz, Bolivia | 10.76 | Luanda, Angola | 14.18 |
| Khartoum, Sudan | 10.66 | Mombasa, Kenya | 14.08 |
| Medellín, Colombia | 10.4 | Dar es Salaam, Tanzania | 13.74 |
| Santa Cruz de la Sierra, Bolivia | 10.07 | Mosul, Iraq | 12.43 |
| Sana’a, Yemen | 9.96 | Lagos, Nigeria | 12.22 |
| Aleppo, Syria | 9.18 | Oran, Algeria | 12.09 |
| Chittagong, Bangladesh | 8.84 | Tehran, Iran | 11.9 |
| Dushanbe, Tajikistan | 8.83 | Algiers, Algeria | 11.87 |
| Gomel, Belarus | 8.72 | Santiago De Los Caballeros, Dominican Republic | 11.71 |
| Maracaibo, Venezuela | 7.75 | Lahore, Pakistan | 10.88 |
| Caracas, Venezuela | 7.16 | Kampala, Uganda | 10.6 |
| Accra, Ghana | 6.41 | Kigali, Rwanda | 9.65 |
| Kabul, Afghanistan | 5.15 | Nairobi, Kenya | 9.58 |
| Port-au-Prince, Haiti | 4.82 | Lusaka, Zambia | 9.12 |
| Havana, Cuba | 4.51 | Tunis, Tunisia | 8.54 |
North America
- United States: T-Mobile was the fastest mobile operator with a median download speed of 116.14 Mbps. Spectrum was fastest for fixed broadband at 211.66 Mbps.
- Canada: TELUS was the fastest mobile operator in Canada with a median download speed of 76.03 Mbps. Rogers was fastest for fixed broadband (223.89 Mbps).
- Mexico: Telcel had the fastest median download speed over mobile at 36.07 Mbps. Totalplay was fastest for fixed broadband at 74.64 Mbps.
Europe
- Albania: Vodafone was the fastest mobile operator with a median download speed of 46.75 Mbps. Digicom was fastest for fixed broadband at 77.83 Mbps.
- Belgium: Telenet had the fastest median download speed over fixed broadband at 126.79 Mbps.
- Denmark: YouSee was the fastest mobile operator in Denmark with a median download speed of 118.32 Mbps. Fastspeed was fastest for fixed broadband at 270.80 Mbps.
- Estonia: The fastest operator in Estonia was Telia with a median download speed of 72.95 Mbps. Elisa was fastest over fixed broadband at 84.09 Mbps.
- Finland: DNA had the fastest median download speed over mobile at 74.65 Mbps. Lounea was fastest for fixed broadband at 103.79 Mbps.
- Germany: Telekom was the fastest mobile operator in Germany with a median download speed of 78.85 Mbps. Vodafone was fastest for fixed broadband at 112.58 Mbps.
- Latvia: LMT had the fastest median download speed over mobile at 63.59 Mbps. Balticom was fastest for fixed broadband at 203.31 Mbps.
- Lithuania: The operator with the fastest median download speed was Telia with 102.09 Mbps. Cgates was fastest for fixed broadband at 131.63 Mbps.
- Poland: Orange had the fastest median download speed over mobile at 43.02 Mbps. UPC was fastest for fixed broadband at 206.22 Mbps.
- Turkey: Turkcell was the fastest mobile operator in Turkey with a median download speed of 51.92 Mbps. TurkNet was fastest for fixed broadband at 50.94 Mbps.
References:
https://www.ookla.com/articles/global-index-cities-announcement
UK Struggles in Ranking of World’s Fastest Cities for Broadband
Point Topic: Global Broadband Tariff Benchmark Report- 2Q-2022
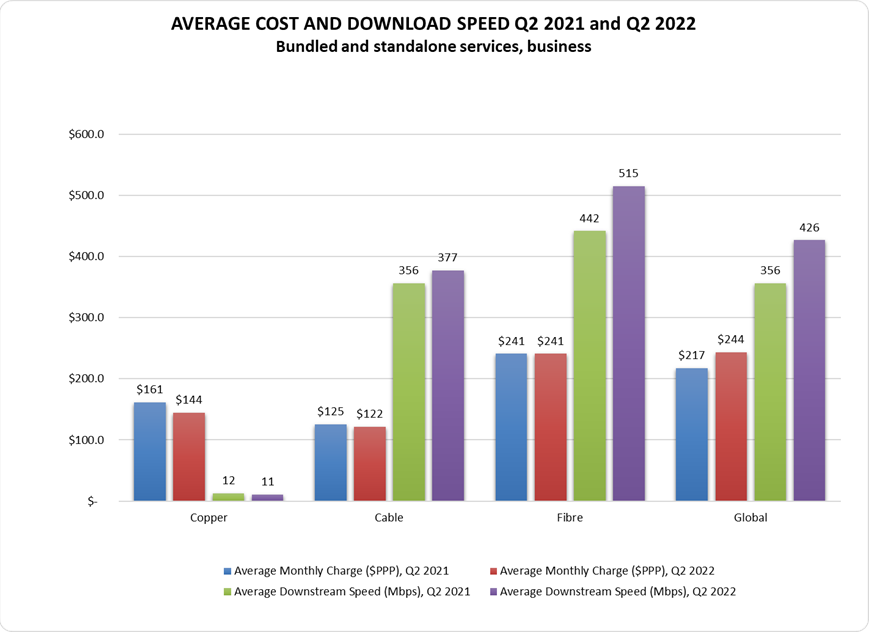
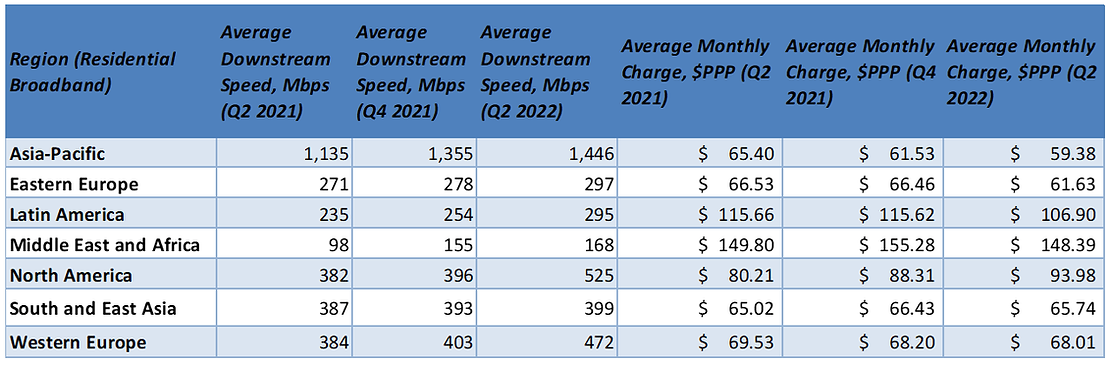
In the twelve months to the close of Q2 2022, global residential fixed line broadband subscribers saw their average monthly charges decrease by 4% on copper, cable and fiber-based tariffs. Across the three technologies the average bandwidth increased by 22% year-on-year (y-o-y), due to the increased innovation and proliferation of fiber-based networks globally. Business subscribers continued to struggle with rising monthly charges, with the average monthly charge increasing by 12% and the average downstream speed standing at 426 Mbps compared to residential tariff averages of 464 Mbps.
The Asia-Pacific region retained its dominant bandwidth position with average speeds of 1,146 Mbps, up from 1,355 Mbps in Q4 2021 and 1,135 Mbps y-o-y, followed by North America, Western Europe, and Southeast Asia with the three regions reaching a combined average of around 465 Mbps.
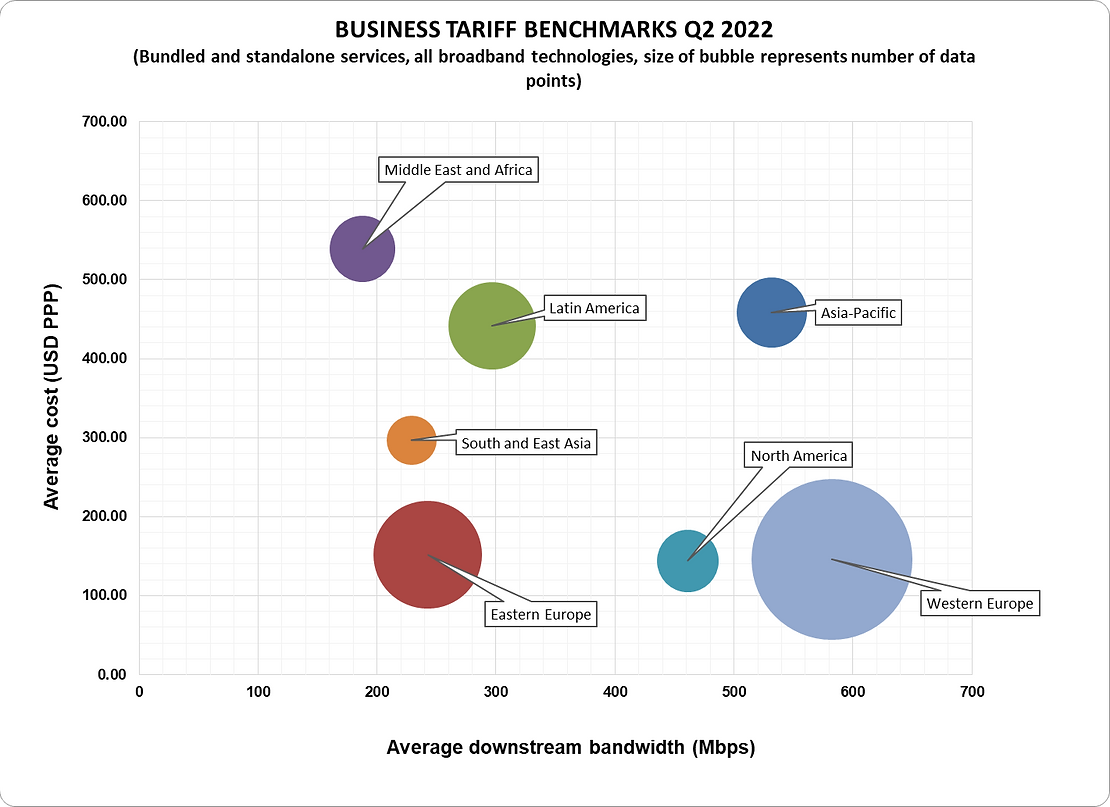
Qatar, Switzerland and Southeast Asian countries still remain at the top of the league by average bandwidth along Italy, France and Bulgaria; these countries all rank in the top ten cheapest for residential broadband in terms of average cost per Mbps being less than $0.10 PPP.


In Q2 2022, the combined average download bandwidth grew by 20% compared to Q2 2021 and stood at 426 Mbps. This was caused by the boost in the average speed over cable and especially fibre, 14% and 22% respectively. Copper maintained largely the same average download speed compared to the previous quarter. However, the overall global average monthly cost across the three technologies has increased by just over 12% from $217 PPP to $244 PPP at the close of Q2 2022


References:
Global Broadband Tariff Benchmark Report, Q2 2022 (point-topic.com)
USTelecom Broadband Pricing Index (BPI): substantial price reductions for broadband access
While U.S. inflation in 2022 has soared to a 40+ year high (at 8.6% YoY), the price of broadband internet access is still falling and consumers are getting even more for less.
USTelecom’s latest analysis of the broadband marketplace: 2022 Broadband Pricing Index (BPI). This year’s report finds pricing for the most popular and highest-speed broadband internet services continues to decline while value continues to increase. The research compares prices over two time periods: the year-over-year price difference from 2021-2022; and a longer-term view of price changes between 2015 and 2022.
The third installment of the USTelecom Broadband Pricing Index (BPI) reveals continued substantial price reductions for both the most popular and highest-speed broadband internet services.
As in previous years, the BPI uses FCC and other public data sources to assess recent trends in residential fixed broadband pricing in the United States. The 2022 edition of the BPI compares prices over two time intervals:
- The price difference from 2021-2022
- A longer-term view in price changes between 2015 and 2022
In both cases, as in the past, the BPI creates an index that allows comparisons between the most popular speed tiers in each year (BPI-Consumer Choice) and the highest speed tiers in each year (BPI-Speed).
Key Findings of the Report:

Broadband Pricing Ran Counter to Significant Overall Inflation in the Past Year
- Real BPI-Consumer Choice broadband prices dropped by 14.7% from 2021-2022
- Real BPI-Speed broadband prices dropped by 11.6% from 2021-2022
- In contrast, the cost of overall goods and services rose by 8% from 2021-2022
Historical Broadband Pricing Analysis Shows Real Broadband Prices Have Been Cut in Half from Seven Years Ago
- Real BPI-Consumer Choice tier prices dropped by 44.6% from 2015-2022
- Real BPI-Speed tier prices dropped by 52.7% from 2015-2022
The Consumer Value of Broadband Service Has Never Been Higher
- Providers have increased the speeds of their broadband offerings. When combined with the price drops for that service, the overall value to customers (measured on a dollars/megabit basis) shows a dramatic improvement over the past seven years.
- The real cost per megabit of both the most popular and fastest service offerings have dropped by around 75% since 2015. This gives the consumers a boost in their wallet and in their daily online performance.
References:
https://ustelecom.org/wp-content/uploads/2022/06/USTelecom-Broadband-Pricing-Report2022.pdf
Intelsat and PCCW Global combine networks; Intelsat achieves MEF 3.0 Carrier Ethernet (CE) Certification
Intelsat and PCCW Global Combine Networks:
Satellite communications specialist Intelsat and Hong Kong based PCCW Global have announced a new collaboration to extend the reach, resiliency, and quick delivery of on-demand enterprise connectivity offerings.
The integration of Intelsat’s FlexEnterprise global connectivity fabric with PCCW Global’s Console Connect Software Defined Interconnection® platform enables organizations to deliver enterprise connectivity to locations around the globe while leveraging an easy-to-use platform underpinned by one of the world’s largest private MPLS networks.
The combined solution addresses two key obstacles to delivering reliable, agile services across all of an enterprise’s locations: limited local telecom infrastructure that can challenge traditional network deployments in developing or hard-to-reach places, and lengthy lead times typically associated with creating high-performance networks and services. The collaboration brings together FlexEnterprise’s reach and reduced network deployment speed and Console Connect’s real-time quoting, ordering and provisioning of high-performance connectivity.
Mr. Frederick Chui, Chief Commercial Officer, PCCW Global, said, “The collaboration with Intelsat brings together the latest innovations in fixed network and satellite network technologies to deliver more flexible enterprise connectivity solutions. By integrating Intelsat’s FlexEnterprise solution with the Console Connect digital platform, our global customers can access satellite connected locations wherever they need to and effortlessly turn up services across all sites.”
FlexEnterprise leverages the world’s largest and most advanced integrated satellite fleet and ground infrastructure to enable service providers to integrate the reach and reliability of Intelsat services without the need to manage wholesale satellite capacity. The connectivity-as-a-service solution offers packaged service that makes it quicker and more cost-effective to add resiliency to existing sites and extend the reach of enterprise networks to even the most remote areas.
The Console Connect digital platform puts users in control of one of the world’s largest MPLS and Tier 1 IP networks, providing them with private, on-demand connections between over 750 data centres across more than 50 countries worldwide. Console Connect is home to a growing ecosystem of cloud, SaaS, IX, IoT, carrier and enterprise partners, which are directly interconnected by the platform’s private high-performance network, delivering higher levels of network performance, speed, and security. Through the platform’s MeetingPlace feature, users can also directly order and provision partner services, such as remote peering, colocation and business applications, as well as access native services from Console Connect.
Mr. Brian Jakins, General Manager and Vice President of Networks, Intelsat, said, “Our Sales and Product teams work closely with the telecom ecosystem to make satellite services more relevant and easier to adopt for a broader set of customers. With the integration into the Console Connect platform, Intelsat is able to more easily meet customers anywhere on the PCCW Global network, while enterprises leverage the platform to extend applications and services to their most remote users and outposts.”

Intelsat’s Global Network is First to Achieve MEF 3.0 Carrier Ethernet Certification for New Performance Tier:
Intelsat has become the first satellite operator to achieve MEF 3.0 Carrier Ethernet (CE) Certification for services delivered through its integrated space and global terrestrial network. Intelsat’s achievement means that customers can dependably integrate Intelsat’s global network solutions into their network solutions with assurance of performance and security. This also represents continued progress towards Intelsat’s Unified Network vision to enable seamless, end-to-end orchestrated services, driven by our integration of 5G and other open standards.
“Intelsat’s achievement of MEF 3.0 certification ensures that customers can rely on Intelsat to provide Ethernet services that meet the demands of enterprise, government and wholesale use cases with key performance indicators that define the industry standard for high-quality,” said Lance Hassan, Director of Terrestrial Network Innovation at Intelsat. “This achievement also demonstrates Intelsat’s leadership as a satellite communications company and global provider of network solutions.
MEF service definitions help telecom service providers accelerate product development and service implementations, with definitive measures to ensure consistency of the quality of the services they provide. As part of Intelsat’s continued efforts to drive open standards development and adoption across the satellite industry, the company worked with MEF member companies to amend MEF 23 with a new Performance Tier (PT5) that defines new Class of Service performance objectives for satellite-based networks.
“Intelsat, in achieving our industry’s first MEF 3.0 certification for GEO satellite-based Carrier Ethernet services, is adding a dimension to MEF’s important work that will benefit users no matter where they stand on the globe,” said Bob Mandeville, president and founder of Iometrix, MEF’s testing partner for carrier ethernet certifications.
“Companies in the satellite community are crucially important in enabling accessibility of carrier ethernet services anywhere on the planet,” said Kevin Vachon, chief operating officer, MEF. “Achieving MEF 3.0 certification facilitates interoperability with terrestrial networks and lays the groundwork to ultimately achieve service automation with MEF’s Lifecycle Service Orchestration (LSO) framework and APIs. We congratulate Intelsat on their certification achievements.”
Intelsat services are provided by the company’s integrated satellite and terrestrial network. For more information and to check availability, click here.
References:
New Study: Internet and Mobile Services were less affordable in 2021
Internet connectivity became less affordable worldwide in 2021, according to new data from the ITU-D and the Alliance for Affordable Internet (A4AI).
The new study shows an increase in fixed and mobile broadband costs during the pandemic. Relative prices of fixed broadband services increased to 3.5 percent of gross national income (GNI) per capita worldwide in 2021, from 2.9 percent in 2020. The relative price of mobile broadband services worldwide increased from 1.9 percent to 2 percent of GNI per capita.
It shows that many people have sacrificed other services and goods to start connected during the pandemic, with those who can staying largely connected, even at relatively higher prices. The report shows that fewer economies worldwide meet the UN Broadband Commission’s affordable cost target of 2 percent of monthly GNI per capita for entry-level broadband.
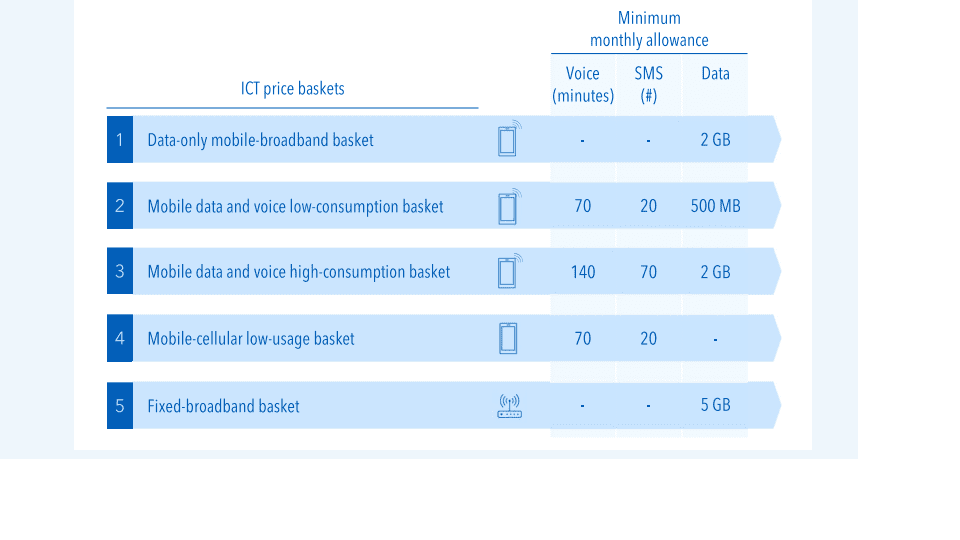
The policy brief analyzes the prices of five baskets: mobile broadband, fixed broadband, mobile data and voice low-usage, mobile data and voice high-usage and mobile cellular low usage. The figure below provides a simplified overview of the each of the five baskets used in the 2021 data collection.

https://www.itu.int/en/ITU-D/Statistics/Pages/ICTprices/default.aspx
Omdia: Big increase in Gig internet subscribers in 2022; Top 25 countries ranked by Cable
Global gigabit internet subscriptions are expected to increase to 50 million in 2022, more than doubling from 24 million at the end of 2020, according to a new report from market research firm Omdia (owned by Informa).
The Omdia report states that accelerated fiber deployments are helping to drive an increase in gigabit connectivity.
“Demand for reliable broadband is set to drive growth in gigabit services, with fiber playing a key role,” said Peter Boyland, principal analyst, broadband at Omdia.
“There were fewer than 620 million fiber subscriptions globally at the end of 2020, but we expect these to grow to 719 million in 2022, or 62% of total subscriptions.” The majority of fiber internet subscribers are expected to be in China.
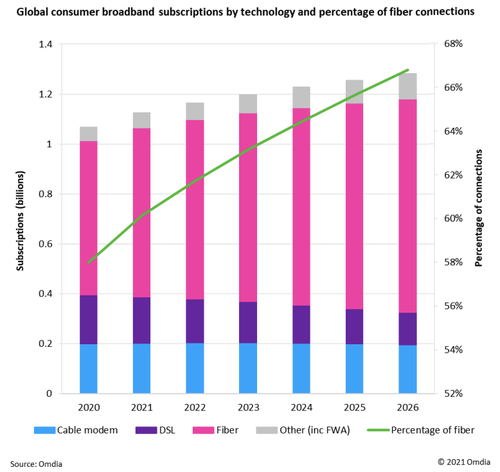
However, Omdia warns that service providers must “carefully consider market demand” for their gigabit strategies and make targeted investments in fiber.
“Service providers need to carefully plan and execute gigabit network rollout, analyzing a number of factors, including infrastructure challenges, market competition, and expected demand,” writes Omdia. “But this does not stop with network rollout – operators need to continually monitor potential competitors and constantly innovate, refresh, and build service offerings so they stay ahead of rivals.”
The analysts also point out the opportunity for vendors in the market who can help service providers build “future proof” networks. “Vendors can offer long-term solutions such as monitoring and automation tools to extend the operator/vendor relationship beyond network rollouts,” the report recommends.
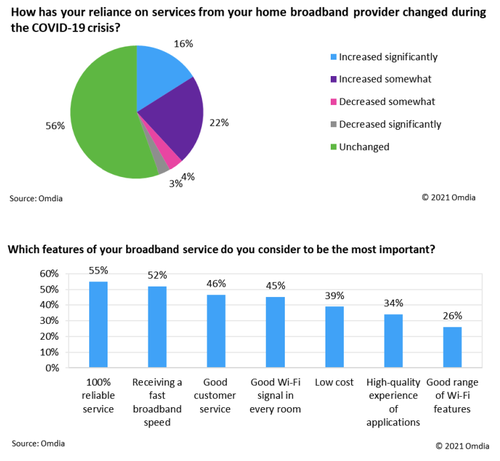
Of course, what matters most to consumers is reliable service. According to Omdia’s Digital Consumer Insights survey, 36% of respondents said they were more reliant on broadband services during COVID-19, and 55% of respondents said reliability ranked top among the most important home broadband features.
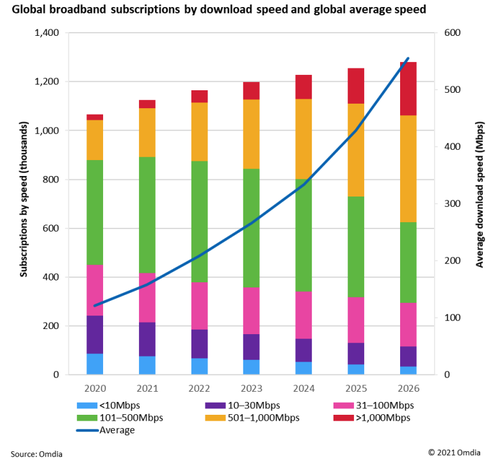
All of this gigabit and fiber growth will impact broadband speeds for years to come. According to Omdia:
“In 2020, just 2% of broadband subscriptions were more than 1Gbps, but this is expected to double to 4% in 2022.”
–>See table below for the 25 countries with the fastest AVERAGE internet speeds, ranked by Cable. Note that none of them is close to 1Gbps.
The report says that subscribers with access to 500 Mbit/s-1 Gbit/s will increase from 15% in 2020 to 21% in 202, with 17% of broadband subscriptions projected to reach speeds over 1 Gbit/s by 2026.
While high-bandwidth entertainment like augmented and virtual reality (AR/VR) and gaming were thought to be the main drivers for ever-faster home broadband speeds in pre-pandemic times, Omdia’s report doesn’t think they are significantly important for gigabit Internet growth, referring to them just once as “other drivers.”
……………………………………………………………………………………………
Internet comparison site Cable has ranked the countries with the fastest broadband internet in the world based on over 1.1 billion speed tests across 224 countries and territories.
“The acceleration of the fastest countries in the world has finally plateaued this year as they reach FTTP pure fibre saturation. Increases in speed among the elite performers, then, can be attributed in greater part to uptake in many cases than to network upgrades. Meanwhile, though the countries occupying the bottom end of the table still suffer from extremely poor speeds, 2021’s figures do indicate that the situation is improving,” said Dan Howdle of Cable.
Here are the 25 countries with the fastest download speeds:
| 1 | Jersey | JE | WESTERN EUROPE | 274.27 |
| 2 | Liechtenstein | LI | WESTERN EUROPE | 211.26 |
| 3 | Iceland | IS | WESTERN EUROPE | 191.83 |
| 4 | Andorra | AD | WESTERN EUROPE | 164.66 |
| 5 | Gibraltar | GI | WESTERN EUROPE | 151.34 |
| 6 | Monaco | MC | WESTERN EUROPE | 144.29 |
| 7 | Macau | MO | ASIA (EX. NEAR EAST) | 128.56 |
| 8 | Luxembourg | LU | WESTERN EUROPE | 107.94 |
| 9 | Netherlands | NL | WESTERN EUROPE | 107.30 |
| 10 | Hungary | HU | EASTERN EUROPE | 104.07 |
| 11 | Singapore | SG | ASIA (EX. NEAR EAST) | 97.61 |
| 12 | Bermuda | BM | NORTHERN AMERICA | 96.54 |
| 13 | Japan | JP | ASIA (EX. NEAR EAST) | 96.36 |
| 14 | United States | US | NORTHERN AMERICA | 92.42 |
| 15 | Hong Kong | HK | ASIA (EX. NEAR EAST) | 91.04 |
| 16 | Spain | ES | WESTERN EUROPE | 89.59 |
| 17 | Sweden | SE | WESTERN EUROPE | 88.98 |
| 18 | Norway | NO | WESTERN EUROPE | 88.67 |
| 19 | France | FR | WESTERN EUROPE | 85.96 |
| 20 | New Zealand | NZ | OCEANIA | 85.95 |
| 21 | Malta | MT | WESTERN EUROPE | 85.20 |
| 22 | Estonia | EE | BALTICS | 84.72 |
| 23 | Aland Islands | AX | WESTERN EUROPE | 81.31 |
| 24 | Canada | CA | NORTHERN AMERICA | 79.96 |
| 25 | Belgium | BE | WESTERN EUROPE | 78.46 |
It is the fourth year of the assessment and the latest ranking uses data collected in the 12 months up to 30th June 2021 to evaluate internet speed by country.
References:
https://www.cable.co.uk/broadband/speed/worldwide-speed-league/
Leichtman Research Group: U.S. broadband growth returns to pre-pandemic levels in Q3-2021
Leichtman Research Group, Inc. (LRG) found that the largest cable and wireline phone providers in the U.S. – representing about 96% of the market – acquired about 630,000 net additional broadband Internet subscribers in 3Q 2021, compared to a pro forma gain of about 1,525,000 subscribers in 3Q 2020, about 615,000 in 3Q 2019, and about 600,000 in 3Q 2018.
These top broadband providers now account for about 107.9 million subscribers, with top cable companies having about 75.2 million broadband subscribers, and top wireline phone companies having about 32.7 million subscribers.
Findings for the 3rd /quarter include:
- Overall, broadband additions in 3Q 2021 were 41% of those in 3Q 2020
- The top cable companies added about 590,000 subscribers in 3Q 2021 – 45% of the net additions for the top cable companies in 3Q 2020
- The top wireline phone companies added about 40,000 total broadband subscribers in 3Q 2021 – compared to about 200,000 net adds in 3Q 2020. Telcos had about 475,000 net adds via fiber in 3Q 2021, and about 435,000 non-fiber net losses
“Broadband additions returned to pre-pandemic levels in the third quarter of 2021,” said Bruce Leichtman, president and principal analyst for Leichtman Research Group, Inc. “The top broadband providers added significantly fewer subscribers than in last year’s third quarter, but had a similar number of net adds as in 3Q 2019 and 3Q 2018.”
| Broadband Providers/ | Subscribers at end of 3Q 2021// | Net Adds in 3Q 2021/ |
| Cable Companies | ||
| Comcast | 31,688,000 | 300,000 |
| Charter | 29,899,000 | 265,000 |
| Cox* | 5,510,000 | 25,000 |
| Altice | 4,388,100 | (13,200) |
| Mediacom | 1,466,000 | (2,000) |
| Cable One | 1,030,000 | 13,000 |
| Atlantic Broadband^ | 717,000 | 3,000 |
| WOW (WideOpenWest)^ | 509,500 | 1,600 |
| Total Top Cable | 75,207,600 | 592,400 |
| Wireline Phone Companies | ||
| AT&T | 15,510,000 | 29,000 |
| Verizon^^ | 7,337,000 | 74,000 |
| CenturyLink/Lumen | 4,589,000 | (77,000) |
| Frontier | 2,789,000 | (9,000) |
| Windstream | 1,147,000 | 15,200 |
| TDS | 522,800 | 9,200 |
| Cincinnati Bell* | 439,000 | 1,200 |
| Consolidated | 390,661 | (2,819) |
| Total Top Telco | 32,724,461 | 39,781 |
References:
Cable broadband subscriber growth slows while FTTx and FWA gain ground
Cable network operators (cablecos or MSOs) are losing ground to FTTP/FTTx (fiber to the premises/ cabinet/ home) and FWA (fixed wireless access).
- Bloomberg reports that cable broadband growth is sputtering and no one knows why.
- GlobalData agrees, but forecasts a solid increase in U.S. fixed-broadband lines.
Broadband internet subscriber growth at Comcast Corp. and Charter Communications Inc has decreased, raising concerns about an end to what has been a huge growth business, with explanations ranging from a slowdown in consumer spending to competition from phone giants.
Charter on Friday reported 25% fewer new broadband subscribers than analysts estimated and said the overall number of new customers would fall back to 2018 levels. Charter had 1.27 million new broadband customers in 2018 compared with 2.2 million last year. Analysts predict it will add 1.4 million subscribers this year, according to estimates compiled by Bloomberg.
Comcast, which had earlier cut its subscriber forecast, reported 300,000 new internet customers Thursday, less than half the number added a year ago.
Analysts were expecting some slowdown in demand coming off 2020, a year when broadband sign-ups spiked as the pandemic shifted people to working and schooling from home. Still, with Charter echoing Comcast’s gloomy picture from Thursday, suddenly there’s a chill on the cable broadband front, which became the most prized segment of the business as consumers cut traditional TV service.
Charter’s shortfall raises “questions about whether this is the beginning of the end of the cable broadband story,” said Geetha Ranganathan, an industry analyst at Bloomberg Intelligence.
GlobalData forecasts that cable’s share of total U.S. fixed broadband subscriptions will decline to 67.1% by the end of 2026, from 68% in 2021, as other technologies such as fiber and fixed wireless expand their presence. Total U.S. fixed-broadband lines, including fiber, fixed wireless and cable, will increase from 103.1 million in 2021 to 112.3 million by 2026 says the market research firm.

No one has been able to identify the exact reason why the wind has gone out of the sails for big cable. Both Charter and Comcast blamed a slower new home market for some of the slack in demand, leaving the companies to try and squeeze more business out of their saturated markets. Other factors could include a drop off in lower-paying customers as government assisted broadband funds dry up.
Even as Comcast and Charter deploy new faster network technology to attract more lucrative customers, cable’s share of the market is starting to shrink, according to Tammy Parker, a senior analyst with GlobalData.
Total U.S. broadband lines will increase to 112.3 million by the end of 2026 from 103.1 million in 2021, including new wireless internet customers, the market research firm predicts.
The number of U.S. fiber lines will grow at a CAGR of 10.8% to reach 28.2 million lines by the end of 2026. This growth will be due to rising demand for high-speed internet services in the nation, and efforts by the government and operators to expand FTTx networks.
References:
https://www.telecomlead.com/broadband/number-of-us-fiber-lines-to-reach-28-2-mn-by-2026-102290
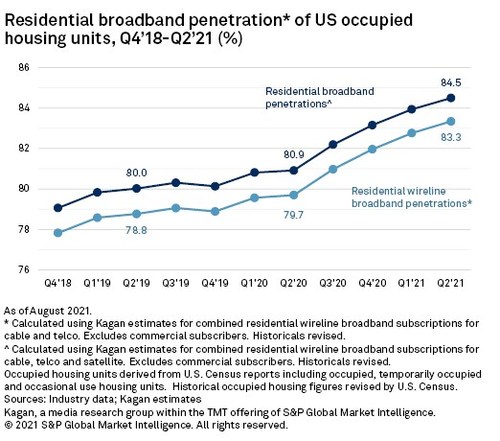
Kagan: U.S. Broadband Market Continues to Grow
The U.S. is still experiencing robust growth in fixed broadband connections, driven predominately by the cable market, according to a new report published this week. Meanwhile, download speeds are increasing faster than expected due to cable companies and new telco FTTH deployments.
U.S. broadband gains illustrated durable demand for wireline connections in the second quarter, allaying fears of a 2021 hangover, according to Kagan, a media research group within S&P Global Market Intelligence. While the 945,000 new broadband subs in second quarter 2021 fall short of the year-ago boom, that increase far exceeds the second-quarter 2019 figure that cable operators have been pointing to as a more likely template for current-year success.
The combined residential cable, telco and satellite broadband subscribers topped 109.2 million at the end of the second quarter, up 4.3% annually with nearly 4.5 million net adds year over year, according to Kagan’s full industry estimates.
The U.S. broadband market soared in the first half of 2020 as Covid-19 drove working from home to new levels and customers felt the need for more reliable – and faster – Internet connections. Kagan last year noted that the number of residential wireline subscribers with a broadband service of 100 Mbps or more increased by 5.5% in the first six months of 2020, compared with end-2019.
Additional takeaways from Kagan’s Q2 2021 report:
- Cable subscriber growth in the first half was down from the outsized gains of the pandemic-boosted demand for connectivity. But with 1.9 million residential and commercial net adds year-to-date, cable accounted for 96% of broadband customer gains across the U.S. cable, telco and satellite segments in the first six months of 2021.
- The surging enthusiasm for FTTH upgrades is boosting telco wireline broadband net adds, albeit at relative magnitudes. While the segment’s residential net adds in the second quarter pale in comparison to cable’s growth, it represents a dramatic improvement over the second quarter track record since 2016.
- Combined, the established satellite broadband providers lost 24,000 U.S. subscribers while Starlink begins to establish early momentum.
Kagan declined to share figures for growth in net broadband additions for Q2 last year, simply stating that the 2021 numbers “fall short of the year-ago boom.” However, Q2 this year was far ahead of the same period in 2019, which it – and the industry itself – would serve as a more accurate benchmark for future growth. In the second quarter of 2019, wireline broadband net adds came in at 339,000.
The overall residential broadband market in the US reached 109.2 million subscribers at the end of June, an increase of 4.3% year-on-year; net adds over the 12 months hit nearly 4.5 million. Again, Kagan did not provide comparative figures. As per the above chart, residential broadband penetration is now above 83%, rising to 84.5% if satellite broadband is included.
The cable companies are still leading the U.S. broadband market. 1.9 million net additions in the first half of the year across the residential and commercial sectors give cablecos/MSOs a 96% share, leaving the telco and satellite providers sharing the remaining 4%, or just under 80,000 customers.
With the satellite broadband companies together losing 24,000 customers over that period, that means the telcos probably signed up at least 100,000 new customers in the first half of 2021.
The Need for Speed:
As of June 30, Kagan estimates that 78.4% of residential wireline subscribers took download speeds of 100Mbps and above. With speed and bandwidth at the forefront of consumers’ minds, the 1Gbps tier logged the largest increase.
Subscribers taking 1 Gig or higher rose to an estimated 7.8% of the residential broadband universe in the second quarter of 2020, up from 4.3% at year-end 2019.
The under 25 Mbps tier fell to 2.7% of wireline broadband households or 2.8 million subscribers for whom slower speeds likely impeded in-home online activities, including entertainment, during the pandemic. The telco sector, still somewhat held back by legacy copper systems, accounted for the vast majority of the lower end speed category, with an estimated 87.2% of all wireline broadband subscribers in the below 25 Mbps category.
References:
https://telecoms.com/511015/no-covid-hangover-in-us-broadband-market-yet/
Dell’Oro: Broadband Access equipment spending increased 18% YoY
A newly published Broadband Access and Home Networking 1stQ2021 report by Dell’Oro Group stated that the total global revenue for the Broadband Access equipment market increased to $3.3B in 1st Quarter, up 18 percent year-over-year (YoY). The growth was driven by strong fiber infrastructure investments such as PON (Passive Optical Network) OLT (Optical Line Terminal) ports, particularly 10 Gbps PON technologies.
XGS-PON revenue jumped 500% year-on-year to about $200 million, reflecting several quarters of steady growth as fiber players up their game in anticipation of competition from cable operators deploying DOCSIS 4.0.
- Total broadband access equipment revenue was down 6 percent from the record revenue of 4Q 2020.
- Total cable access concentrator revenue (a category that includes DOCSIS infrastructure elements such as converged cable access platform cores and chassis, virtual CCAP licensing and DAA nodes and modules) increased 15 percent YoY to $243 M.
- Though DOCSIS license purchases were down, new hardware purchases in the form of CCAP chassis, line cards, and DAA nodes and modules helped push revenue higher.
- CommScope led the cable access concentrator market with about 40% of revenues in Q1 2021, followed by Cisco (16%), Harmonic (16%) and Casa Systems (15%).
- 80% of DOCSIS modems shipped in Q1 2021 were of the DOCSIS 3.1 variety.
- Revenue from purchases of remote-PHY and remote MAC-PHY equipment were up 66% from Q4 2020, which can be interpreted as a sign that cable operators are resuming long-term projects that were put on hold during the height of the pandemic last year.
- Total DSL Access Concentrator revenue was down 30 percent YoY, driven by slower port shipments worldwide as more operators shift their spending to fiber.
- Total PON ONT (Optical Network Terminal which is CPE) revenue was down quarter over quarter, but unit shipments remained above 30M globally for the second straight quarter.
The Dell’Oro Group Broadband Access and Home Networking Quarterly Report provides a complete overview of the Broadband Access market with tables covering manufacturers’ revenue, average selling prices, and port/unit shipments for Cable, DSL, and PON equipment. Covered equipment includes Converged Cable Access Platforms (CCAP) and Distributed Access Architectures (DAA); Digital Subscriber Line Access Multiplexers ([DSLAMs] by technology ADSL/ADSL2+, G.SHDSL, VDSL, VDSL Profile 35b, and G.FAST); PON Optical Line Terminals (OLTs), Cable, DSL, and PON CPE (Customer Premises Equipment); and SOHO WLAN Equipment, including Mesh Routers. For more information about the report, please contact [email protected]
…………………………………………………………………………………………………………………………………………….
Long term, MoffetNathanson analysts forecast cable operators (MSOs) having a 50% broadband share in the markets where they compete with FTTH—significantly less than cable’s 85% market share against VDSL and 95% market share against DSL.
References:
Will Cable Broadband Market Share Decline as Telcos Deploy Fiber?
