

Ookla
Highlights from Ookla’s U.S. Speedtest Connectivity Report-Mobile & Fixed Networks
Executive Summary:
Ookla’s United States Speedtest Connectivity Report H1 2026 provides a detailed snapshot of network performance across the U.S. mobile and fixed broadband markets, based on Speedtest Intelligence data. The findings point to a competitive landscape in which T-Mobile continued to distinguish itself in mobile connectivity, while AT&T Fiber led the fixed broadband segment.
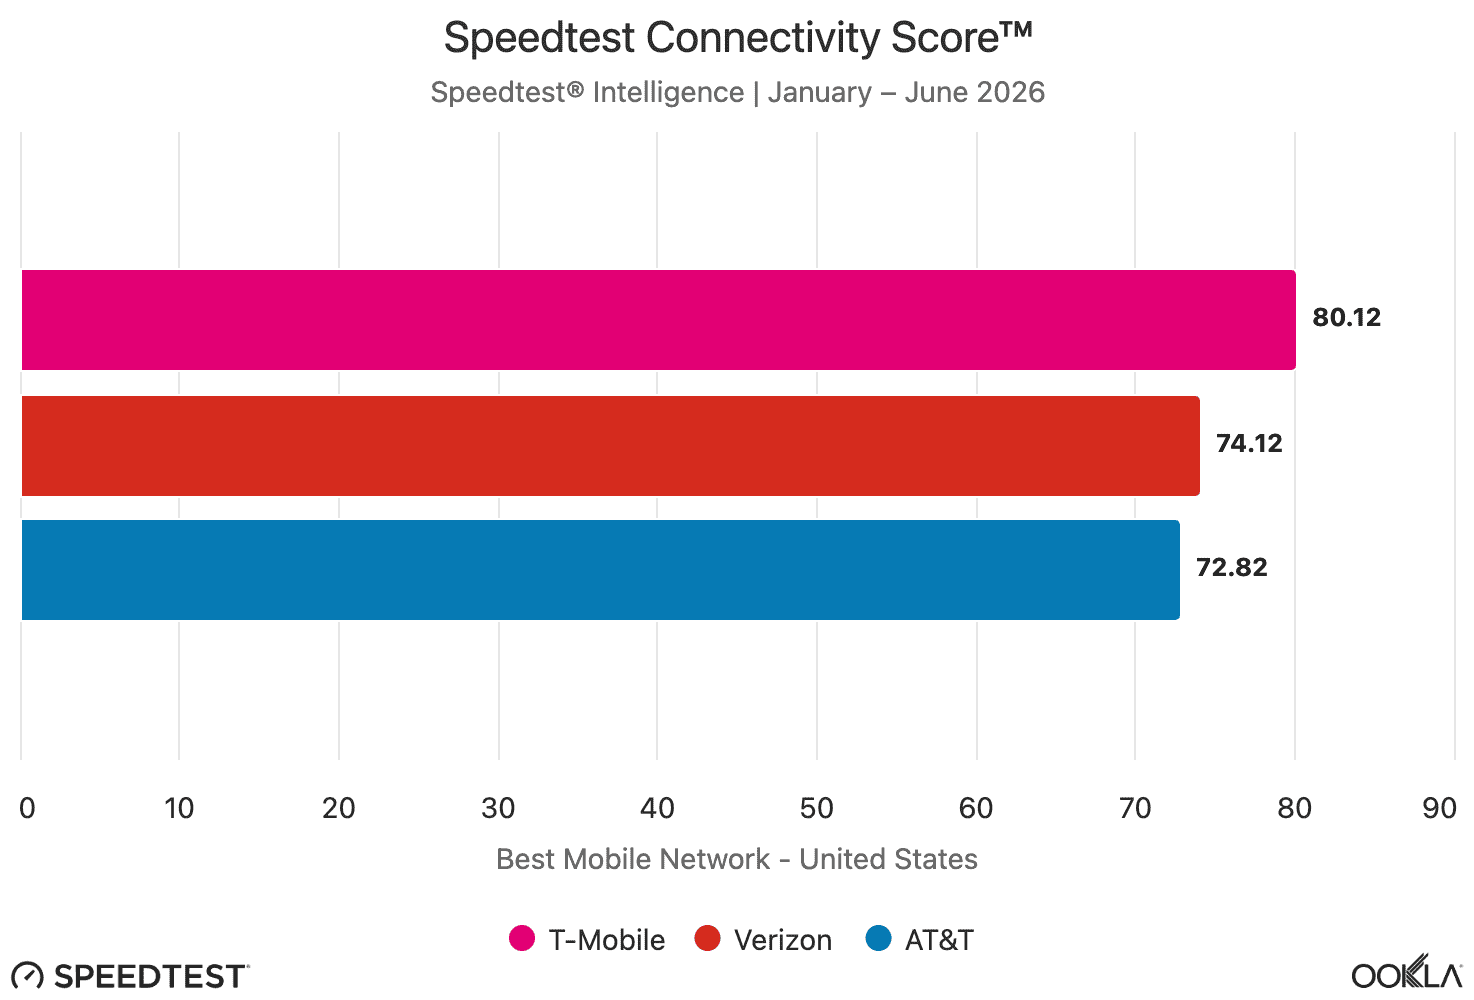
In the mobile network category, T-Mobile was named the Best Mobile Network overall and also claimed the Best 5G Network award for the first half of 2026. The “un-carrier” recorded a median download speed of 275.55 Mbps across all technologies combined, and a median 5G download speed of 314.38 Mbps. These results underscore the strong performance of T-Mobile’s network, particularly in 5G-centric use cases where throughput remains a key differentiator.
………………………………………………………………………………………………………………………………………………………………………………………………………………………………………………………………………………………………
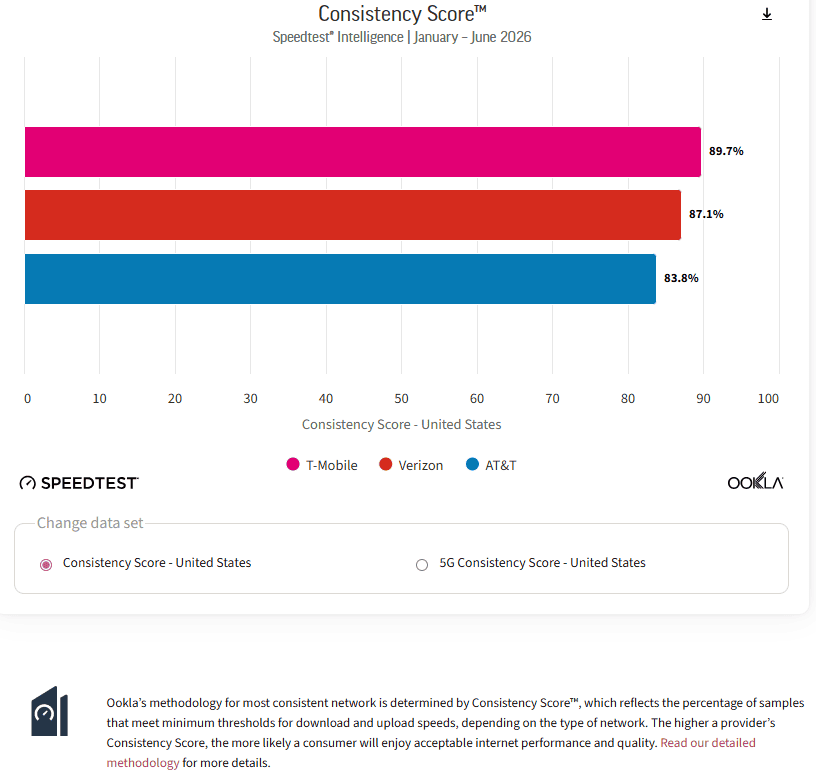
T-Mobile recorded the best mobile network consistency in the United States, for all technologies combined and for 5G. Across all technologies, 89.7% of its samples met or exceeded the threshold of 5 Mbps download and 1 Mbps upload, while 79.3% of its 5G samples met or exceeded the higher threshold of 25 Mbps download and 3 Mbps upload.
………………………………………………………………………………………………………………………………………………………………………………………………………………………………………………………………………………………………
For the fixed line networks, AT&T Fiber was recognized as the Best Internet provider and the Fastest Fixed Network in the United States during the same period. The oldest U.S. network operator posted a median download speed of 374.75 Mbps and a median upload speed of 320.65 Mbps, reflecting the growing importance of high-capacity fiber access in home broadband markets. As fixed and mobile connectivity continue to converge in consumer experience expectations, these metrics highlight the increasingly performance-driven nature of broadband competition.
The report also indicates that T-Mobile delivered the best gaming and video streaming experiences in the United States during 1H 2026, both across all technologies combined and in the 5G-only category. This is notable because it extends the company’s advantage beyond raw speed metrics into application-level quality, where latency sensitivity, jitter, and consistency can be as important as peak throughput.
At the city level, Lincoln, Nebraska recorded the fastest median mobile download speed among the most populous U.S. cities at 395.83 Mbps. In fixed broadband, Durham, NC led the group with a median download speed of 380.47 Mbps. These city-level results reinforce the fact that network performance varies significantly by market, even within a single national assessment, and that local deployment density and backhaul quality can materially influence user experience.
Editorial Analysis & Conclusions:
Taken together, the report suggests that U.S. network leadership in 1H 2026 was shaped by both access technology and service quality. Mobile operators are increasingly being judged not only by coverage and 5G speed, but also by end-user experience across demanding applications, while fiber providers continue to push the upper bounds of fixed-line performance. Ookla’s latest data therefore offers a useful benchmark for understanding where the U.S. connectivity market stands — and where competition is most intense.
- The U.S. mobile market appears to be shifting from a simple coverage contest toward a performance-and-experience contest. T-Mobile’s lead in overall mobile, 5G, gaming, and video-streaming experience suggests that end-user quality is now being shaped by a combination of throughput, consistency, and 5G availability rather than raw coverage alone.
- The results reinforce that 5G leadership is increasingly tied to how well operators can translate spectrum, radio access optimization, and transport capacity into sustained user experience. T-Mobile’s strong median download speeds across both blended and 5G-only measurements indicate that its network engineering is delivering not just peak performance, but performance that is visible in real-world usage patterns.
- The fixed broadband results show that fiber remains the benchmark for high-capacity access in the U.S. AT&T Fiber’s strong download and upload figures illustrate why fiber continues to set the standard for symmetrical, high-throughput residential service, especially as cloud applications, video conferencing, and multi-device home traffic continue to grow.
- Application-centric metrics are becoming more relevant in how networks are evaluated. The fact that T-Mobile led in gaming and video streaming experience suggests that operators are increasingly judged on latency-sensitive and consistency-sensitive workloads, not just speed-test averages. For ComSoc readers, that is a reminder that network KPIs are evolving in step with how people actually use the network.
- At the city level, the report also highlights how uneven performance can be across markets. Lincoln’s leading mobile result and Durham’s leading fixed result suggest that local infrastructure, spectrum conditions, and deployment density still matter significantly even within a mature national market. This is especially relevant for planners and researchers interested in the last mile, metro-area capacity, and regional quality-of-experience gaps.
Overall, the report suggests that U.S. connectivity competition is entering a more mature phase in which operators are differentiated less by whether they can deliver 5G or fiber at all, and more by how well they can optimize those platforms for sustained, application-level performance. For IEEE Techblog readers, that makes the report useful not only for network operator rankings, but as a snapshot of where network engineering priorities are heading.
………………………………………………………………………………………………………………………………………………………………………………………………………………………………….
References:
https://www.ookla.com/research/reports/united-states-speedtest-connectivity-report-h1-2026
https://www.ookla.com/resources/guides/speedtest-methodology
Ookla: AI workloads will force changes in 5G mobile network infrastructure
Ookla: AI platform reliability decreases as outages surge
Ookla on the Global D2D Market
Ookla: Starlink a viable competitor for hybrid 5G/NTN services due to network performance improvements and larger coverage area
Ookla: D2D satellite connectivity surged 24.5% during last 9 months; Starlink’s footprint expansion leads the way
Nokia to showcase agentic AI network slicing; Ericsson partners with Ookla to measure 5G network slicing performance
Ookla: AI workloads will force changes in 5G mobile network infrastructure
Introduction:
Ookla’s latest research study examines how AI use cases will stress 5G mobile networks, relative to standard internet traffic. The report, based on Speedtest Intelligence® data across 22 markets, evaluates metrics like upload capacity, latency under load, and cloud infrastructure pathways (see graphs below). Using Speedtest 5G data from 2025 across 22 markets and 86 operators in North America, Europe, Asia Pacific, the Middle East, and Latin America, it measures upload capacity, latency under load, and the quality of the path to the cloud. It also shows where current 5G falls short of what AI actually demands.
Analysis:
Ookla’s report argues that 5G network evaluation is entering a new phase: raw download speed is no longer enough to describe user experience or network capability in an AI-driven era. The more relevant indicators are upload performance, latency, consistency, and resilience, because AI-heavy applications tend to be interactive, symmetric, and sensitive to delay. The report’s timing is important because it reframes 5G from a consumer mobile broadband service into an infrastructure question for AI workloads. That shift matters for network operators, because uplink and latency have historically received less attention than headline download rates in market rankings and public messaging.
Here’s the lead-in (emphasis added):
“AI has changed what a good mobile network looks like, and the metric the industry has marketed for two decades — peak download speed — no longer predicts it. The networks that top the download charts are often not the ones best prepared for AI traffic. Whether an AI application feels instant or breaks depends in large part on how much a network can upload, how it holds up under load, and how consistently it reaches the cloud, and on those measures, different networks come out on top. This report rebuilds the industry’s download-led scorecard around what AI actually asks of a network, and shows where today’s 5G mobile networks are ready and where they fall short. AI traffic is not one thing. Text chat, conversational voice, multimodal and AR vision, generated video, and agentic activity each load the network differently, and most of them lean on parts of the network that download speed never tested. The change AI brings is less about raw capacity, which operators have expanded for years, than about the shape of the traffic — heavier on upload, always on, and bursty, rather than download-led and session-based.”
A few high-level takeaways for the U.S. market include:
- Although the United States ranks among the strongest on overall network performance, it sits at 5.1% for the proportion of network capacity allocated to the uplink, which is the lowest in the dataset.
- The U.S. upload share has contracted, declining from 8.0% to 5.1% between 2023 and 2025.
- The U.S. market top network operators fall short of the 20 Mbps upload target required for AR and multimodal AI.
- For baseline network responsiveness, the U.S. records a multi-server latency of 50.5 ms, missing the target of less than 50 ms for text-based large language models (LLMs).
Technical Implications:
Ookla’s framing implicitly favors 5G SA, 5G Advanced, and edge-assisted architectures, since these are the network generations most likely to improve latency determinism and support more efficient uplink behavior. It also suggests that future benchmarking should include workload-aware tests, not just conventional speed tests, because AI applications stress networks differently from video streaming or web browsing. The report has immediate relevance for markets where 5G download speeds look strong but uplink and latency remain weaker, because those networks may appear healthy under older metrics while still underperforming for AI use cases. That is a useful lens for comparing operators, especially where regulators and carriers are beginning to discuss AI readiness as part of national digital infrastructure strategy.
Conclusions:
With the rise of AI workloads, mobile network measurement is becoming application-specific. The central question is no longer just “How fast is 5G?” but “How well does the network support AI-era traffic patterns, especially interactive and uplink-heavy traffic?” In this new context, metrics such as upload capacity, latency consistency, and service resilience are becoming just as important as peak downlink speed. For operators, this implies that competitive advantage will increasingly depend on how well the network supports real-time, bidirectional, and latency-sensitive applications, rather than how well it performs on legacy consumer benchmarks.
Traditional speed tests still matter, but they are increasingly insufficient as a proxy for user experience in an AI-native environment. In practice, the networks that win will be those that can deliver symmetry, resilience, and predictable latency across real workloads, not merely impressive headline throughput.
…………………………………………………………………………………………………………………………………………………………………………………..
Ookla Charts:


……………………………………………………………………………………………………………………………………………………………………….
References:
https://www.ookla.com/articles/benchmarking-5g-ai-workloads-2026
https://www.ookla.com/s/media/2026/07/Ookla_Research_AI_network_readiness_07262.pdf
Ookla: AI platform reliability decreases as outages surge
Cisco Execs: New “Network Supercycle” as Agentic AI Workloads Reshape Telecom Infrastructure
AI-Era Cloud Network Transformation: A Reference Architecture and Implementation Roadmap
Ericsson’s June 2026 Mobility Report Highlights + AI impact on network traffic
Cisco report: Agentic AI to reshape WAN traffic, AI inference will be ~25% of total traffic by 2035
Nokia’s AI Applications Study: “Physical AI” may require RAN redesign to support high‑volume, low‑latency uplink traffic
Will the wave of AI generated user-to/from-network traffic increase spectacularly as Cisco and Nokia predict?
Ookla on the Global D2D Market
Ookla: Starlink a viable competitor for hybrid 5G/NTN services due to network performance improvements and larger coverage area
Ookla: D2D satellite connectivity surged 24.5% during last 9 months; Starlink’s footprint expansion leads the way
Nokia to showcase agentic AI network slicing; Ericsson partners with Ookla to measure 5G network slicing performance
Dell’Oro: Mobile Core Networks +15% in 2025; Ookla: Global Reality Check on 5G SA and 5G Advanced in 2026
Ookla: FWA Speed Test Results for big 3 U.S. Carriers & Wireless Connectivity Performance at Busy Airports
Ookla on the Global D2D Market
Direct-to-device (D2D) satellite connectivity is emerging as a practical extension of non-terrestrial networks (NTNs), enabling standard smartphones to communicate directly with satellite systems without specialized user equipment. Within the 3GPP ecosystem, NTN capabilities were standardized (3GPP specs become standards by being rubber stamped by ETSI and ITU-R) beginning with 3GPP Release 17, establishing a framework for satellite-terrestrial interoperability and expanding the potential reach of mobile broadband beyond the footprint of terrestrial radio access networks.
D2D services could reduce persistent coverage gaps, especially in rural, maritime, and other underserved environments where terrestrial deployment is constrained by economics or geography. However, commercially available services today remain limited, with most deployments focused on messaging and other low-throughput applications rather than full mobile broadband.
From a market perspective, D2D and NTN have broad implications for mobile network operators (MNOs), satellite operators, equipment vendors, and regulators. That strategic importance helps explain why companies such as Apple, Amazon, SpaceX, and AST SpaceMobile are investing in this segment, alongside broader ecosystem activity around 3GPP-based NTN architectures.

Image Credit: Ookla
Ookla® has contributed to the discussion with a high-resolution poster showing global Speedtest® usage data for D2D services, along with a detailed market study on the D2D landscape. The analysis is based on Android devices that register with D2D-capable satellite systems from Starlink, Skylo, and Lynk, providing an early empirical view of how NTN-based connectivity is being used in practice.
Looking ahead, continued investment in larger satellite constellations and additional spectrum holdings should improve D2D capacity, coverage, and service robustness. As the technology matures, the industry is likely to move from narrowband messaging toward richer data services, with 3GPP NTN providing the standardization path for broader ecosystem scale-up.
For mobile network operators, the long-term effect could be a rebalancing of investment priorities at the edge of network coverage, particularly in sparsely populated regions. That may reduce the incentive for some rural tower builds and alter the demand outlook for parts of the RAN infrastructure supply chain.
Looking ahead, continued investment in next-generation satellite constellations, coupled with expanded spectrum access, is expected to enhance D2D performance and capacity. Key players—including Starlink, AST SpaceMobile, and Amazon’s Project Kuiper—are targeting higher data rates and broader service capabilities, with the objective of extending beyond narrowband messaging to support more data-intensive applications.
For MNOs, the evolution of D2D introduces potential shifts in network planning and capital allocation, particularly at the margins of coverage. Satellite-based augmentation could reduce the economic rationale for terrestrial infrastructure deployment in sparsely populated areas, with downstream implications for tower companies and certain segments of the radio access network (RAN) supply chain.
From a policy perspective, D2D also has the potential to reshape universal service frameworks and coverage obligations. Regulators seeking to expand connectivity may increasingly incorporate NTN-based solutions into their policy toolkits, prompting a reassessment of long-standing assumptions regarding the role of terrestrial infrastructure in achieving nationwide coverage. In that sense, D2D is not just a satellite story. It is becoming a broader telecom architecture shaped by 3GPP specifications and the convergence of terrestrial and non-terrestrial mobile networks.
References:
Analyst firms wide forecasts for the LEO satellite direct-to-device (D2D) market
Ookla: D2D satellite connectivity surged 24.5% during last 9 months; Starlink’s footprint expansion leads the way
Ookla: Starlink a viable competitor for hybrid 5G/NTN services due to network performance improvements and larger coverage area
GSA: 5G Non Terrestrial Networks, 5G SA and 5G Advanced gain momentum
Analysis: Amazon <- Globalstar – a strategic move for D2D and spectrum parity
Direct-to-Device (D2D) satellite network comparison: Starlink V2 (Starlink Mobile) vs “Satellite Connect Europe”
Deutsche Telekom selects Iridium for NB-IoT direct-to-device (D2D) connectivity
Standards are the key requirement for telco/satellite integration: D2D and satellite-based mobile backhaul
MTN Consulting: Satellite network operators to focus on Direct-to-device (D2D), Internet of Things (IoT), and cloud-based services
Nokia to showcase agentic AI network slicing; Ericsson partners with Ookla to measure 5G network slicing performance
Executive Summary:
Today, Nokia announced a strategic collaboration with Amazon (AWS), Du, and Orange to debut an industry-first agentic AI-driven network slicing [1.] capability on a 5G SA core network. Du and Orange will deploy this new technology which uses Nokia’s 5G AirScale base stations, MantaRay SMO and Agentic AI modules in tandem with Amazon’s Bedrock Artificial Intelligence platform. Autonomous AI agents are used to ingest and process real-time telemetry—including geospatial data, event triggers, and traffic patterns—the framework enables adaptive network slicing. This architecture allows communications service providers (CSPs) to dynamically orchestrate resources in response to fluctuating demand, such as prioritizing mission-critical throughput for first responders during emergency incidents.
Note 1. There are no ITU standards for network slicing or the 5G SA Core network required to implement that capability. 3GPP specifications define end-to-end network slicing architecture, covering slice management (TS 28.552, TS 28.554), service requirements, and security (NSSAA – Network Slice Specific Authentication and Authorization). The NSA and CISA have released specific, recognized guidance on designing, deploying, and maintaining secure 5G standalone (SA) network slices. ETSI publishes and adopts 3GPP technical specifications (specifically the 28-series) as European standards for network slicing management, including 5G RAN, core network, and NFV-MANO architecture. ETSI, as a 3GPP partner, ensures these specifications cover the lifecycle of network slices.
…………………………………………………………………………………………………………………………………………………………………………………………..
- Data Ingestion & Inference: Agentic AI modules, hosted on Amazon Bedrock, ingest real-world contextual data (e.g., emergency alerts, traffic sensors, weather) alongside live network KPIs.
- Intent-Based Policy Generation: The AI agents analyze this telemetry to determine the optimal network configuration required to meet specific Service Level Agreements (SLAs) or emergency “intents'”
- NEF & SMO Integration: These high-level intents are translated into actionable policies and pushed to Nokia’s MantaRay SMO (Service Management and Orchestration).
- Dynamic RAN/Core Adjustment: The Network Exposure Function (NEF) acts as the secure gateway, allowing the AI agents to interface with the 5G Core. It exposes network capabilities so the agents can dynamically adjust RAN policies and resource allocation across the 5G AirScale base stations.
- Autonomous Feedback Loop: The system operates in an autonomous mode where agents continuously monitor the results of their adjustments, performing forensic analysis to refine slicing parameters in real-time.
Nokia will host live technical demonstrations of this AI network slicing capability at its 2026 Mobile World Congress (MWC) Barcelona exhibit.

Quotes:
“This innovation marks a major milestone in the evolution of AI-native networks,” said Pallavi Mahajan, Chief Technology and AI Officer at Nokia. “By combining Nokia’s advanced network slicing capabilities with agentic AI, we are enabling operators to deliver premium, intent-based services that adapt dynamically to real-world conditions. Nokia is advancing connectivity by unlocking new value streams for telecommunication providers and supporting next-generation applications and differentiated services for enterprises, industries and consumers.”
Amir Rao, Global Director, GTM & Telco Solutions at AWS added: “Network slicing has long promised to unlock new revenue streams for operators, but manual configuration and static policies have prevented end customers from accessing on-demand provisioning. By integrating agentic AI capabilities through Amazon Bedrock with Nokia’s application, operators can now deliver intelligent, context-aware network slicing that responds dynamically to real-world conditions from traffic surges to emergency situations. This transforms network slicing from a technical capability into a true business enabler, allowing operators to monetize their 5G investments through differentiated, premium services that adapt automatically to customer needs. Agentic Network Slicing is the beginning of an era that will enable telecommunications providers to enable real-time intent-based service provisioning for end customers.”
………………………………………………………………………………………………………………………………………………………………………………………………………………………………………………………………………..
Competitive Network Slicing Solution:
Rival wireless equipment vendor Ericsson yesterday gave a preview of a network slicing related offering which it will be demonstrating at the 2026 MWC. Together with Ookla it has developed a specialized test version of its Speedtest app designed to measure and validate 5G network slicing performance. The tool enables the Speedtest app to identify and test specific network slices, which apparently demonstrates how Service Level Agreements (SLAs) for differentiated services can be verified in real-time by consumers and service providers.
Ericsson reported in its latest Mobility report that there were 65 commercial network slicing services worldwide providing so-called “differentiated connectivity” offerings. That’s out of a total of 118 network slicing cases discovered by Ericsson’s researchers. Yet in the UK, none of the three mobile network operators have launched a commercial 5G network slicing capability yet. According to Ofcom’s latest Connected Nations report, 5G SA is available across 83% of outside areas in the country and 5G SA accounts for nearly one-third of 5G traffic. However, 4G accounts for 72% of total monthly data traffic.
“Network slicing is no longer a future concept; it is a commercial reality. However, you cannot manage what you cannot measure,” said Tibor Rathonyi, Senior Advisor at Ookla. “Our work with Ericsson is a pivotal first step in providing the transparency needed to prove the value of these premium 5G services to both consumers and enterprises.”
Philipp Bichsel, Executive Vice President Mobile Network & Services at Swisscom, said: “Swisscom has retained the title as the country’s best-performing mobile network over many years by truly prioritizing the delivery of the best possible customer experience. This has meant embarking on a journey to fully exploit automation to enhance reliability and efficiency without compromising the service quality our customers expect. As we advance towards self-learning, autonomous networks, enabling Swisscom to build smarter and more adaptive network operations, we are leveraging the SMO framework as the foundation for this evolution. Within this framework, partner solutions such as Ericsson’s Intelligent Automation Platform and its ecosystem of rApps play an important role in helping us explore the potential of AI driven automation.”
…………………………………………………………………………………………………………………………………………………………………………………………………………………………………………………………..
References:
https://www.telecoms.com/5g-6g/nokia-and-aws-show-off-agentic-ai-powered-5g-advanced-network-slicing
https://www.telecoms.com/5g-6g/ericsson-and-ookla-launch-network-slicing-measurement-tool
https://www.lightreading.com/5g/eurobites-network-slicing-enjoying-a-moment-finds-ericsson-report
https://www.ericsson.com/en/reports-and-papers/mobility-report/reports/november-2025
https://www.lightreading.com/5g/5g-network-slicing-not-ready-for-prime-time-in-uk
https://www.awardsolutions.com/portal/resources/network-slicing
ABI Research: 5G network slicing market to hit $67.52 billion in 2030 with Asia Pacific in the lead
5G network slicing progress report with a look ahead to 2025
FCC Draft Net Neutrality Order reclassifies broadband access; leaves 5G network slicing unresolved
Telstra achieves 340 Mbps uplink over 5G SA; Deploys dynamic network slicing from Ericsson
ABI Research: 5G Network Slicing Market Slows; T-Mobile says “it’s time to unleash Network Slicing”
Ericsson, Intel and Microsoft demo 5G network slicing on a Windows laptop in Sweden
Ericsson and Nokia demonstrate 5G Network Slicing on Google Pixel 6 Pro phones running Android 13 mobile OS
Nokia and Safaricom complete Africa’s first Fixed Wireless Access (FWA) 5G network slicing trial
Is 5G network slicing dead before arrival? Replaced by private 5G?
5G Network Slicing Tutorial + Ericsson releases 5G RAN slicing software
Dell’Oro: Mobile Core Networks +15% in 2025; Ookla: Global Reality Check on 5G SA and 5G Advanced in 2026
A recent Dell’Oro market research report estimates that 4G/5G Mobile Core Network (MCN) revenues rose 15% YoY in 2025, which was the fastest growth since 2014. For the first time, the 5G MCN market accounted for 50% share of the total MCN market.
Editor’s Note: The 4G and 5G Non Standalone (NSA) mobile core network market (Evolved Packet Core) is experiencing long-term decline as investments are finally shifting toward 5G standalone (SA) networks.
“In 2025, the MCN market recorded its highest year-over-year revenue growth rate since 2014,” stated Dave Bolan, Research Director at Dell’Oro Group. “This was driven by record-setting growth rates in all market segments: 4G MCN (highest since 2019), 5G MCN (highest since 2022), and Voice Core (highest since 2007). 4G MCN gains came from Caribbean and Latin America (CALA) and Europe, Middle East, Africa (EMEA) regions; 5G MCN from all regions; and Voice Core, primarily from Asia Pacific and EMEA regions.
“5G MCNs led the way in 2025 growth, as 5G Standalone (5G SA) networks reached an inflection point and moved towards mass market appeal, as more 5G SA networks expand in population coverage in urban, suburban, and rural areas. Voice Core was the next major contributor to growth in 2025, driven by planned 3G MCN shutdowns, which required upgrades from Circuit Switched Core to IMS Core, and IMS Core modernization to a cloud-native IMS Core for VoNR in 5G SA networks. Meanwhile, 4G MCNs expanded due to subscriber growth in Africa and South America,” added Bolan.
Additional highlights from the 4Q 2025 Mobile Core Network and Multi-Access Edge Computing Report include:
- The top four vendors (Huawei, Ericsson, Nokia, and ZTE) posted very strong growth rates in 2025. Collectively, they accounted for about the same amount of market share as in 2024.
- The Multi-access and Edge Computing (MEC) market segment (a subsegment of the 5G MCN market) attained the highest growth rate of any MCN segment in 2025, with the China region remaining the dominant region for MEC implementations.
- Standard-setting bodies, vendors, and Mobile Network Operators (MNOs) communities are collaborating to expand the ecosystem with new products, applications, and monetization features that are expected to deliver future benefits.
- Examples include RedCap radios, which reduce the cost of IoT devices for consumer wearables and industrial applications; network slicing for both mission-critical and on-demand applications; IMS data channels to increase monetization opportunities and enhance user experience; and Open APIs that enable developers to scale their applications across all MNOs, attracting the app development community.
- Agentic AI is expected to change data traffic patterns and alter the duration that subscribers remain connected to the network as agents operate on their behalf. This could represent a paradigm shift in the future, requiring increased MCN capacity, expanded vendor opportunities, and enhanced monetization for MNOs through pricing tiers.
The Dell’Oro Group Mobile Core Network & Multi-Access Edge Computing Quarterly Report offers complete, in-depth coverage of the market with tables covering manufacturers’ revenue, shipments, and average selling prices for Traditional Packet Core, Evolved Packet Core, 5G Packet Core, Policy, Subscriber Data Management, Signaling, Circuit Switched Core, and IMS Core by geographic regions. To purchase this report, please contact us at [email protected].
…………………………………………………………………………………………………………………………………………………………………………………………………..
Related: The second edition of Ookla and Omdia’s report on the global state of 5G Standalone core network confirms that the technology has moved beyond launch announcements into an execution-driven phase. By the close of 2025, the “coverage gap” between major economic blocs had narrowed, but a more consequential “capability gap” has emerged, reflecting divergent spectrum strategies, investment depth, and the extent to which operators have moved beyond baseline SA deployment toward end-to-end network optimization.

For government and regulatory bodies, 5G Standalone (SA) has evolved into a high-stakes strategic imperative. The intersection of national competitiveness, digital sovereignty, and AI readiness is fundamentally reshaping Capex priorities across Tier-1 markets.
- User Equipment (UE) Performance: Impact of 5G SA on battery life and the transition to Voice over New Radio (VoNR).
- Application-Layer QoE: Benchmarking latency and jitter for cloud-native and gaming infrastructure.
- Commercial Monetization: A review of the first commercial deployments of Network Slicing, Enterprise SLAs, and 5G-Advanced (Release 18) segmentation.
- Geopolitical Drivers: Assessing how sovereign AI strategies in the GCC and legislative shifts in Europe are dictating the global SA evolutionary path.
……………………………………………………………………………………………………………………………………………………………………………………………..
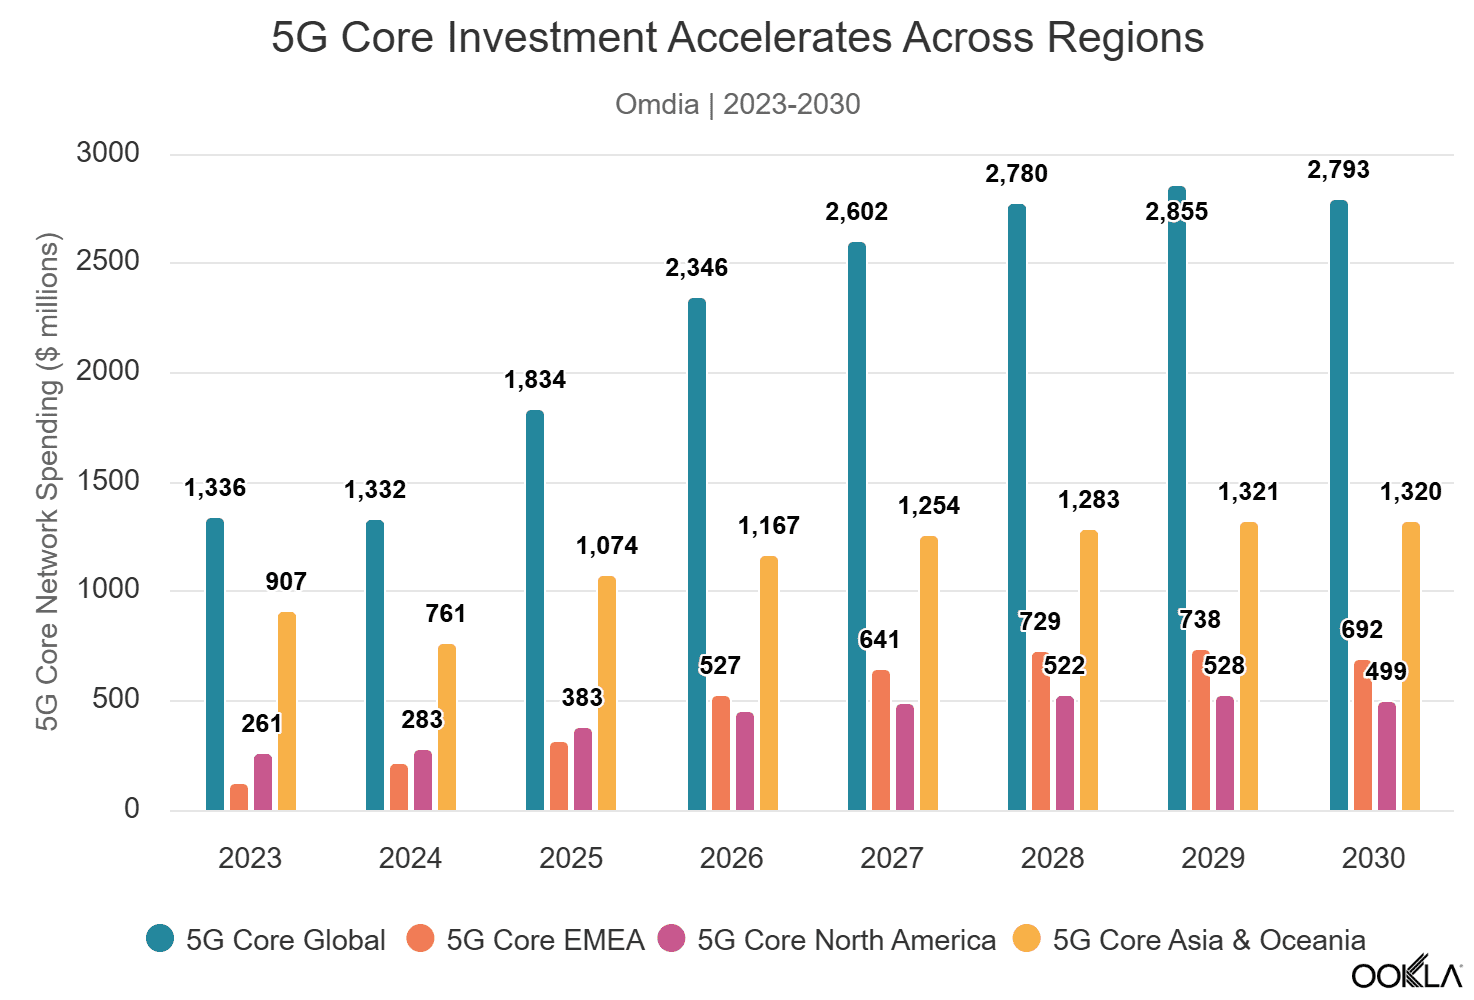
5G Core network investment is accelerating as monetization transitions from concept to selective execution:
Omdia’s latest forecasts confirm the industry’s shift toward software-defined core capability as the primary driver of next-cycle investment. Global 5G SA core network software spending is projected to grow at an 8.8% CAGR between 2025 and 2030, with EMEA leading at 16.7%, significantly outpacing North America (5.5%) and Asia & Oceania (4.2%). This reflects EMEA’s later position in the deployment cycle, as the region is entering its period of peak 5G core adoption, while North America’s 5G core spending trajectory is expected to have peaked in 2025 following the commercial launches by AT&T and Verizon. By end of Q3 2025, 83 operators worldwide had deployed 5G core networks, with 5G core investment accounting for 63.6% of global core network function software spending.
5G Core Investment Accelerates Across Regions:
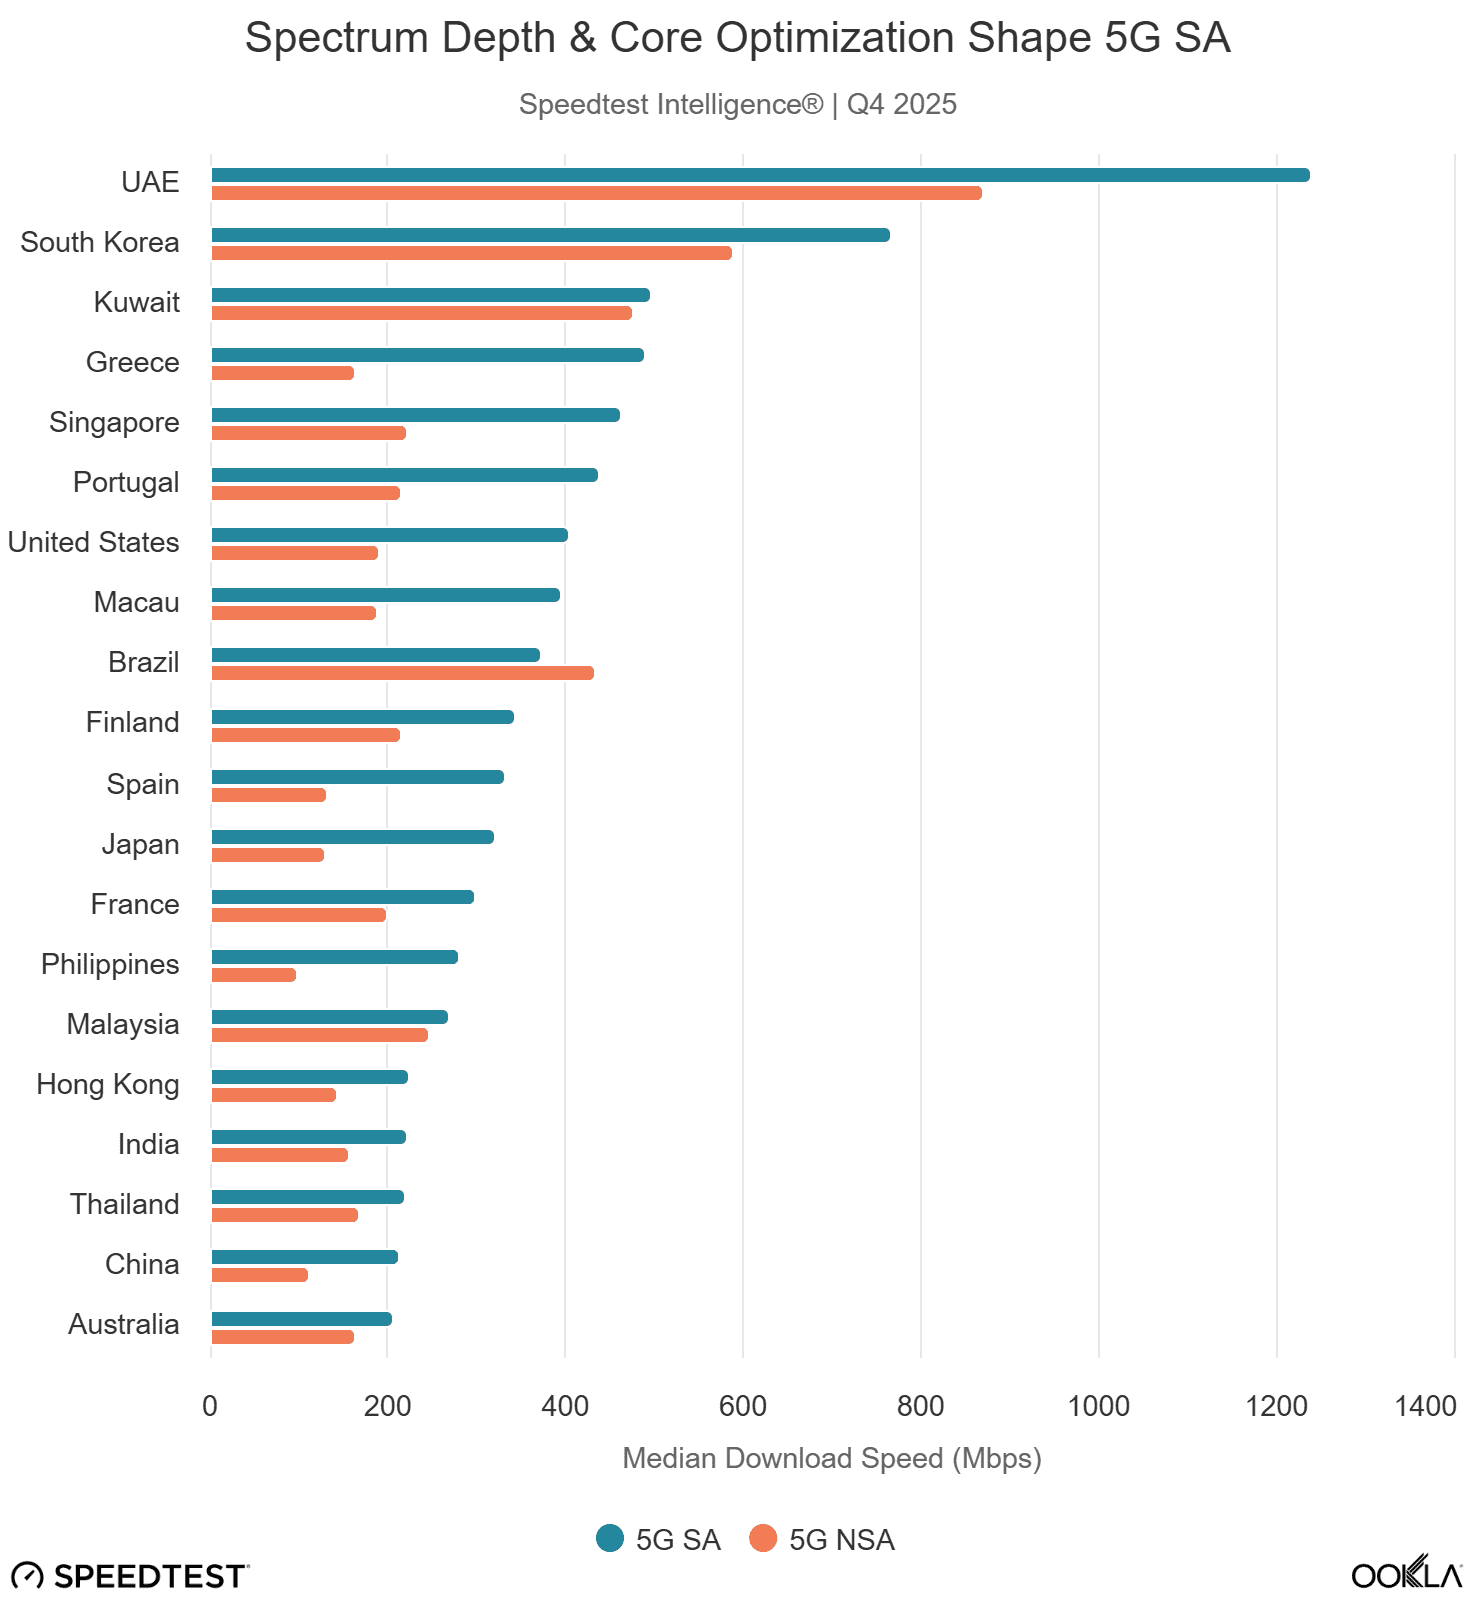
- 5G SA availability based on Speedtest® sample share reached 17.6% in Q4 2025, up modestly from 16.2% a year earlier, indicating that roughly one in six 5G Speedtests worldwide now occurs on a 5G standalone network. The headline global median SA download speed of 269.51 Mbps represents a 52% premium over non-standalone networks, though this figure masks significant regional variation driven by spectrum allocation depth, carrier aggregation maturity, and user-plane engineering.
- Asia leads in 5G availability: China continues to dominate with 80.9% 5G SA sample share and over 10 million 5G Advanced subscribers.
- Globally, 5G SA connections delivered a 52% download speed premium to 5G NSA (mostly an artifact of rich spectrum allocation and lower network load) and improved median multi-server latency by over 6% compared to NSA. However, this year’s report finds that a standalone core migration alone does not guarantee a better end-user experience. Quality of experience analysis reveals a nuanced picture: SA improves video and cloud infrastructure latency in Europe versus NSA, but underperforms NSA for gaming latency within the same region. North America records the lowest absolute SA cloud and gaming latency, consistent with dense hyperscaler adjacency and mature interconnect ecosystems.
- The Gulf Cooperation Council (GCC) was the global 5G SA performance leader, with the UAE setting the speed benchmark Led by e& and du’s aggressive 5G Advanced deployments, the delivered the world’s fastest 5G SA median download speeds in Q4 2025 at 1.13 Gbps, nearly five times that of Europe. The UAE alone reached a median of 1.24 Gbps on SA networks, a speed that would be considered exceptional even for full-fiber broadband in developed markets. The deployment of four-carrier aggregation and enhanced MIMO technology, coupled with the strategic allocation of premium mid-band spectrum to the SA network, demonstrates the performance ceiling that a fully realized 5G SA architecture can achieve.
- South Korea followed at 767 Mbps, driven by wide 3.5 GHz channel bandwidth, with the U.S. at 404 Mbps following the completion of nationwide SA deployments by all three Tier-1 operators. Europe, at 205 Mbps, trails all developed regions, though the region’s SA networks still deliver a 45% download speed premium over NSA, confirming the performance value of the SA transition where material spectrum depth is allocated.
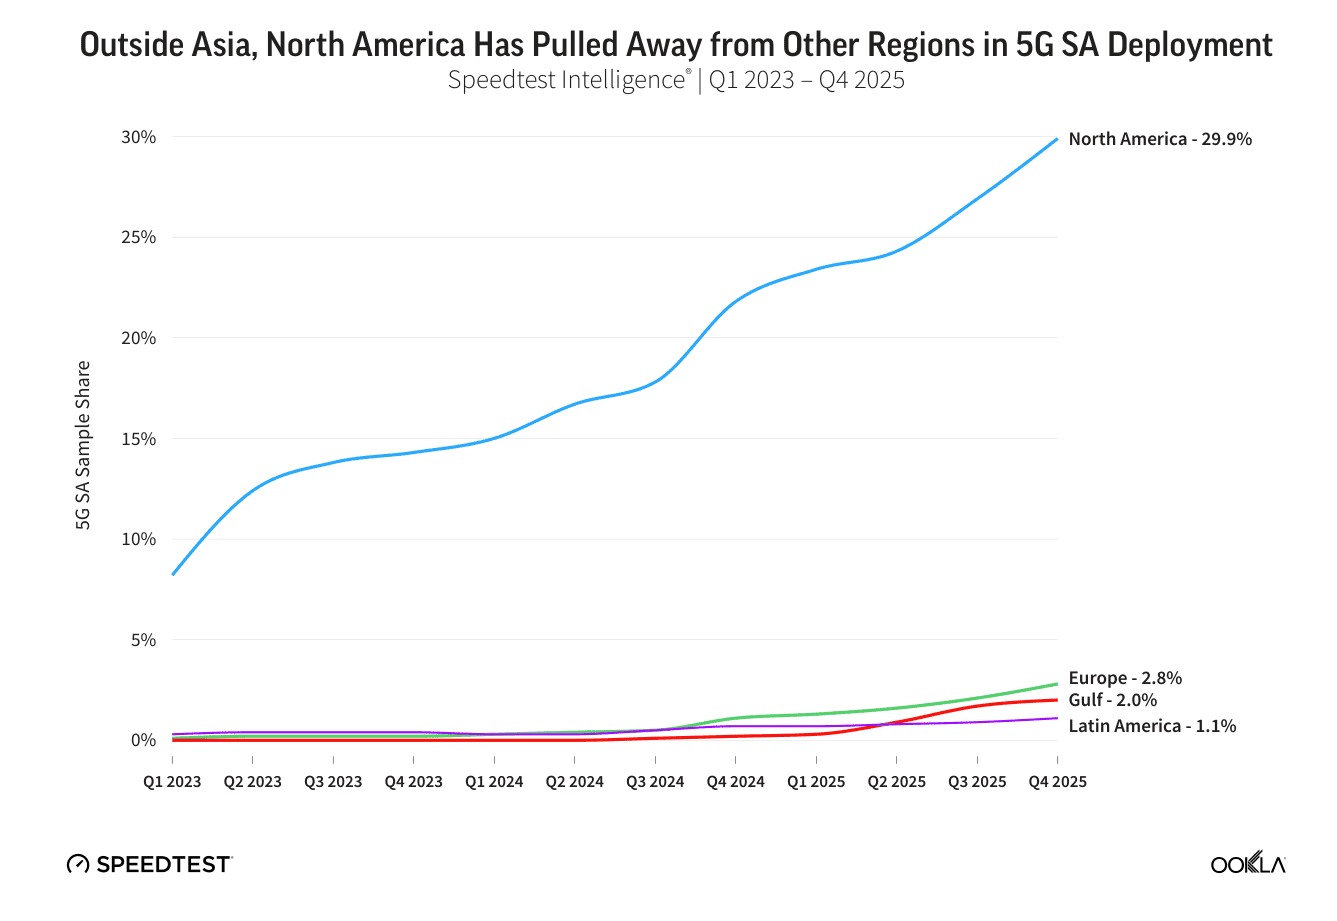
Europe’s 5G SA sample share more than doubled from 1.1% to 2.8% between Q4 2024 and Q4 2025, driven by accelerated deployments in Austria (8.7%), Spain (8.3%), the United Kingdom (7.0%), and France (5.9%). These four markets now account for the vast majority of European SA connections. The United Kingdom and France registered the strongest year-on-year acceleration in Europe, each gaining 5.3 percentage points, reflecting the impact of investment-linked merger conditions and competition in the United Kingdom, as well as targeted R&D policy support in France.
Among European markets, France (41ms to cloud endpoints), Austria (48ms), and Finland (50ms) demonstrate what is achievable where backbone quality, peering density, and routing discipline are strong. These outcomes reflect an underappreciated end-to-end network stack optimization dividend, encompassing data-center proximity, fiber backhaul depth, and user-plane topology, rather than a pure “SA dividend” alone.
However, Europe still trails North America by 27% and emerging Asia by 30%. At the global level, the U.S. remains the largest accelerator in absolute terms over the last year, with SA sample share rising 8.2 percentage points to 31.6% year-on-year, driven by the sequential rollout of SA across all Tier-1 operators beyond T-Mobile. Firmware fragmentation, where handset OEMs gatekeep SA network access pending individual carrier certification, and tariff structures that fail to incentivize migration from NSA, remain the primary barriers to faster European adoption.
The report also presents early evidence that battery life is a tangible consumer benefit of 5G SA. In the UK, devices on EE’s 5G SA network recorded median discharge times approximately 22% longer than those on 5G NSA, with O2 showing an 11% advantage. These gains likely stem from features like SA’s unified control plane, which eliminates the dual-connectivity overhead of NSA configurations.
Consumer strategies now span speed tiers (primarily Europe), 5G network slicing (Singapore, France, and the U.S.), and 5G Advanced segmentation packages (China). Enterprise 5G network slicing presents the much larger long-term revenue opportunity, with T-Mobile’s SuperMobile representing the first nationwide commercial B2B slicing service in the U.S. Countries with coordinated regulatory frameworks, implementing clear coverage obligations, investment incentives, or infrastructure consolidation policies with deployment remedies, consistently outperform those with fragmented or reactive approaches, reinforcing the report’s finding that policy has emerged as a primary competitive differentiator in 5G SA outcomes globally.
…………………………………………………………………………………………………………………………………………………………………………………………
References:
MCN Market Roared Back in 2025 With 15 Percent Growth, According to Dell’Oro Group
https://www.ookla.com/articles/5g-sa-2026
Dell’Oro: RAN market stable, Mobile Core Network market +14% Y/Y with 72 5G SA core networks deployed
AT&T deploys nationwide 5G SA while Verizon lags and T-Mobile leads
Ericsson CEO’s strong statements on 5G SA, WRC 27, and AI in networks
Ookla: Uneven 5G deployment in Europe, 5G SA remains sluggish; Ofcom: 28% of UK connections on 5G with only 2% 5G SA
Ericsson reports ~flat 2Q-2025 results; sees potential for 5G SA and AI to drive growth
Téral Research: 5G SA core network deployments accelerate after a very slow start
Google Fiber and Nokia demo network slicing for home broadband in GFiber Labs
Analysts: Telco CAPEX crash looks to continue: mobile core network, RAN, and optical all expected to decline
Global 5G Market Snapshot; Dell’Oro and GSA Updates on 5G SA networks and devices
Dell’Oro: Mobile Core Network market has lowest growth rate since 4Q 2017
Ookla: Uneven 5G deployment in Europe, 5G SA remains sluggish; Ofcom: 28% of UK connections on 5G with only 2% 5G SA
According to Ookla, Europe is a “two-speed” 5G competitiveness landscape,” with some countries surging ahead and others falling well behind, In Q2-2025, Nordic and southern Europe countries maintained a substantial lead in 5G availability, helped by recent 700MHz band deployments in countries such as Sweden and Italy. By contrast, 5G availability in central and western European laggard countries such as Belgium, the UK and Hungary remains less than half that of the 5G pacemakers, says the study. On average, mobile subscribers in the EU spent 44.5% of their time connected to 5G networks in Q2 2025, up from 32.8% a year earlier.
The deployment and adoption of 5G SA in Europe remain sluggish, increasing slowly from a very low base and further widening the region’s gap with North America and Asia. Spain stands out as a clear leader in 5G SA deployment, reaching an 8% Speedtest® sample share compared with the EU average of just 1.3% as of Q2 2025. This progress has been driven by Spain’s proactive use of EU recovery funds to subsidize 5G SA rollouts in underserved areas, with a particular focus on bridging the rural-urban digital divide. However, the U.S. and China are still far ahead, with 5G SA sample shares above 20% and 80% respectively, reflecting a much greater pace of coverage and adoption in those markets.
Northern Europe Maintains 5G Availability Lead – Speed Test Intelligence Q2-2025: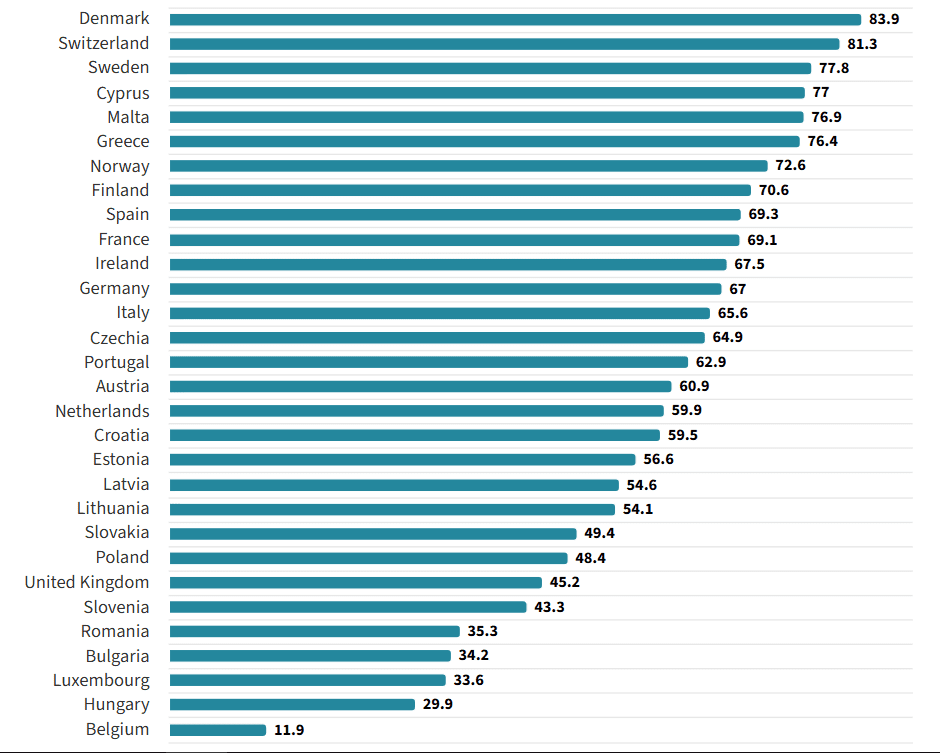
Fragmented 5G Availability across Europe is driven by a complex mix of national policies on spectrum assignment and broader economic factors, rather than by simple geographic or demographic differences. 5G Availability is more strongly correlated with policy-driven factors such as spectrum allocation timelines and costs, coverage obligations, subsidy mechanisms, and regulations for infrastructure sharing and permitting, than with structural factors like urbanization rates or the number of operators. This indicates that 5G competitiveness is shaped less by technology gaps or inherent market imbalances and more by effective policy execution.
Northern Europe Maintains 5G Availability Lead; Other Countries Lag:
Fragmentation remains a persistent theme, shaping stark 5G deployment asymmetries that cannot be explained by geography or demographics alone. Northern and Southern European countries such as Denmark (83.9%), Sweden (77.8%), and Greece (76.4%) are disproportionately represented among the countries with the highest 5G Availability in Q2 2025, with coverage rates up to twice as high as those in Western and Eastern countries like the United Kingdom (45.2%), Hungary (29.9%), and Belgium (11.9%).
Low-band deployment and DSS use continue to lift 5G availability in lagging countries:
Recent advances in 5G Availability have been driven by low-band deployments and the use of DSS, raising the average proportion of time spent on 5G networks in the EU from 32.8% in Q2 2024 to 44.5% in Q2 2025. The pace of coverage growth, and the corresponding increase in 5G usage, has primarily reflected each country’s starting point. Lagging countries like Latvia, Poland, and Slovenia have seen double-digit gains in 5G Availability from a low base. By contrast, leading countries such as Switzerland and Denmark, where 5G coverage is now nearly ubiquitous, have shifted their focus to targeted capacity upgrades through site densification and mid-band expansion.
About Ookla:
Ookla, a global leader in connectivity intelligence, brings together the trusted expertise of Speedtest®, Downdetector®, Ekahau®, and RootMetrics® to deliver unmatched network and connectivity insights. By combining multi-source data with industry-leading expertise, we transform network performance metrics into strategic, actionable insights. Solutions empower service providers, enterprises, and governments with the critical data and insights needed to optimize networks, enhance digital experiences, and help close the digital divide. At the same time, we amplify the real-world experiences of individuals and businesses that rely on connectivity to work, learn, and communicate. From measuring and analyzing connectivity to driving industry innovation, Ookla helps the world stay connected.
Ookla is a division of Ziff Davis, a vertically focused digital media and internet company whose portfolio includes leading brands in technology, entertainment, shopping, health, cybersecurity, and martech.
……………………………………………………………………………………………………………………………………………………………………………………
Mobile Matters report from communications regulator Ofcom discusses 5G’s share of network connections in UK. Ofcom’s analysis – based on crowdsourced data collected by Opensignal and covering the period October 2024 to March 2025 – showed that 28% of connections were on 5G, with 71% still on 4G, 0.7% on 3G and a holdout 0.2% on 2G. In terms of mobile network operators, BT-owned EE had the highest proportion of network connections on 5G, at 32%, while Vodafone had the lowest, at 24%. O2, which is now the mobile arm of Virgin Media, had the lowest share of 4G connections (68%) and the highest proportion on 3G (3%).
5G standalone vs 5G non-standalone performance:
• 5G standalone (SA) accounted for 2% of all 5G connection attempts in the six months to March 2025. UK MNOs have started to offer 5G SA but its use is currently low.
• Standalone 5G’s average response time (latency) was about 15% lower (better) than for 5G NSA. However, our analysis also indicated that 5G SA had a lower average connection success rate (95.9%) than 5G NSA (97.6%), although this was slightly higher than 4G’s.
• 5G SA provided significantly higher download speeds than 5G NSA. Seventy per cent of 5G SA download speeds measurements were at 100 Mbit/s or higher, compared to 46% for 5G NSA, and 2MB, 5MB and 10MB file download times, on average, were about 45% faster on 5G SA than over 5G NSA.
• The picture was more mixed for uploads. While 5G NSA had a higher proportion of low-speed connections (18% of 5G NSA upload speeds provided less than 2 Mbit/s compared to 10% on 5G SA) it also had a slightly higher share of higher-speed connections (30% of 5G NSA uploads were 20 Mbit/s or higher vs 28% on 5G SA).
References:
https://www.ookla.com/articles/europe-5g-q2-2025
Ookla: Europe severely lagging in 5G SA deployments and performance
Téral Research: 5G SA core network deployments accelerate after a very slow start
Ookla: Europe severely lagging in 5G SA deployments and performance
According to a new joint study from Omdia and Ookla, Europe has had the poorest 5G SA availability and performance among major regions. In Q4 2024, China (80%), India (52%), and the United States (24%) led the world in 5G SA availability based on Speedtest® sample share, markedly ahead of Europe (2%).
The European region also lagged behind its peers in performance, with the median European consumer experiencing 5G SA download speeds of 221.17 Mbps—lower than those in the Americas (384.42 Mbps) and both Developed (237.04 Mbps) and Emerging (259.73 Mbps) Asia Pacific. The interplay of earlier deployments, a more diversified multi-band spectrum strategy, and greater operator willingness to invest in the 5G core to monetize new use cases have driven rollouts at a faster pace in regions outside Europe.
The European Commission has championed measures to accelerate private investment in 5G SA, highlighting network slicing—a flagship capability of cloud-native core networks—as a key potential driver of its broader industrial strategy in sectors such as precision manufacturing, defense and clean energy. Up until this point, high-quality public data examining Europe’s progress in 5G SA—and benchmarking its competitive position relative to other global regions—has been scarce. In its latest annual report, Connect Europe, the trade body representing Europe’s telecoms operators, noted that “there is limited information available about the extent of operators’ rollout of 5G SA.”
Advanced network capabilities enabled by the technology remain stubbornly limited to just a few operators in leading markets such as the U.S., according to the study, while Europe lags behind its peers on several 5G SA performance indicators, “raising concerns about the bloc’s competitiveness in the technology.”
Network operator investment per capita also lags in Europe as per the below chart:

When faced with choices among investments in fiber, 5G RAN, and 5G SA core, the latter frequently loses out, since operators can still launch a “5G” network by leveraging alternative technologies. There is also a lack of 5G SA-compatible devices, especially devices with User Equipment Routing Selection Policy (URSP) technology, which allows a device to dynamically select a slice (or multiple slices) provisioned by an operator. However, only Android 12/iOS 17 mobile devices support that largely unknown technology.
While capital spending on the 5G core transition is now increasing rapidly, European network operators will remain committed to strict cost discipline Based on Omdia’s Q3 2024 quarterly core software market share and forecast, the research firm believes that the global core market revenue from both 4G and 5G network functions will grow with a five-year CAGR of 3.2% between 2023 and 2028. When considering the spending in 5G core software, the forecasted growth with a five-year CAGR during the same period is of 17.0%.
Omdia now forecasts that 5G SA core spending in EMEA will grow with a five-year CAGR of 26.2% between 2023 and 2028. Nonetheless, as a prerequisite, deploying the 5G core also requires a good 5G radio coverage, to avoid a degraded experience where the 5G coverage is limited or nonexistent, and where the user falls back on 4G-LTE or 2G/3G. This means operators must invest in 5G RAN, which is usually considered the highest capex draining activity for an operator. While 5G is known for very high throughput speeds using mid-band (and particularly C-band) spectrum, these bands need to be complemented by sub-GHz spectrum deployment, in order to offer improved in-building and wide area coverage. This rollout has been slow in many European markets, with 5G availability in all countries outside the Nordics remaining significantly lower than that in the United States and China, according to Ookla’s Q4 2024 Speedtest Intelligence® data.
One bright spot is that Europe has made progress on achieving low latency on its 5G networks. In Q4 2024, the average country-wide median latency in Europe was 32 milliseconds (ms) compared to 35 ms in the Americas and 36 ms in Emerging Asia Pacific region.
References:
https://www.lightreading.com/5g/eurobites-europe-behind-on-5g-sa-study
https://www.ookla.com/s/media/2025/02/ookla_omdia-5GSA_0225.pdf
Building and Operating a Cloud Native 5G SA Core Network
Latest Ericsson Mobility Report talks up 5G SA networks and FWA
GSA 5G SA Core Network Update Report
ABI Research: Expansion of 5G SA Core Networks key to 5G subscription growth
Vision of 5G SA core on public cloud fails; replaced by private or hybrid cloud?
Nokia and Eolo deploy 5G SA mmWave “Cloud RAN” network
Nokia, BT Group & Qualcomm achieve enhanced 5G SA downlink speeds using 5G Carrier Aggregation with 5 Component Carriers
Highlights of Ookla’s 1st Half 2024 U.S. Connectivity Report
Ookla reported that:
- 5G continues to expand (but without new 5G SA core network deployments), with T-Mobile leading on top-line performance, and the rest of the market playing catch-up. Fixed broadband speeds are also on the rise, driven by greater fiber deployment, and cable technology upgrades.
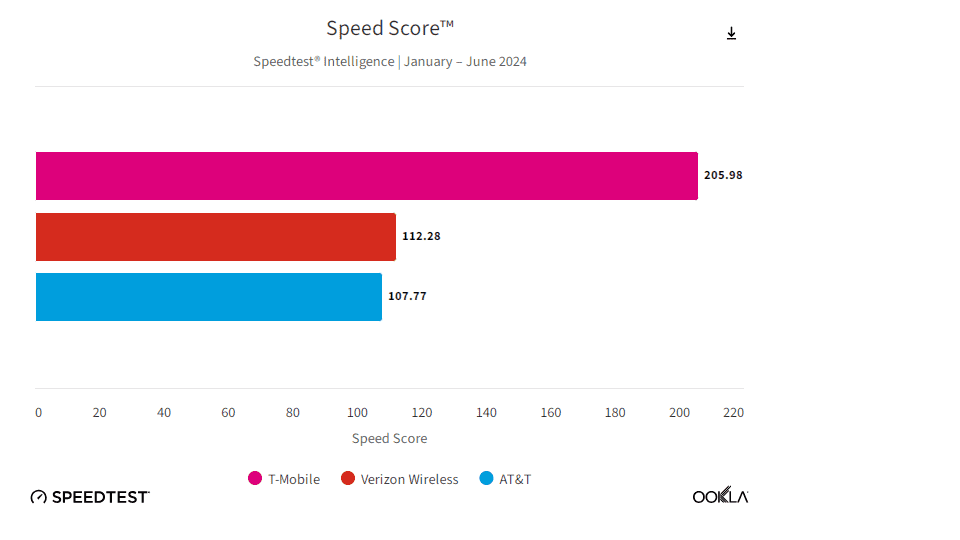
- T-Mobile continues to dominate the mobile landscape in the U.S., boasting the fastest speeds, best consistency, and top user ratings. T-Mobile was the fastest mobile provider in the U.S. during this period, based on Speedtest Intelligence® data for all technologies combined, with a Speed Score (which is NOT an actual speed) of 205.98. Its median download speed was 234.82 Mbps, a strong increase from 164.14 Mbps during the same period the previous year.
- Verizon Wireless and AT&T were runners up, with both driving increases in median download speeds.
- T-Mobile also led on median upload speed, with 13.30 Mbps, and on latency, with 48 ms.
- Connecticut topped the state rankings for fixed broadband download speeds, with a median almost 160 Mbps faster than last placed Alaska. Mobile was a similar story, with Illinois leading, some 120 Mbps faster than Alaska.
- Pittsburgh, Pennsylvania had the fastest median mobile download speed among the 100 most populous cities in the U.S. at 321.06 Mbps. Kansas City, Missouri was second; Raleigh, North Carolina was third; Indianapolis, Indiana fourth; and Nashville, Tennessee was fifth.
- Anchorage, Alaska had the slowest median mobile download speed at 58.63 Mbps. Reno, Nevada was second slowest; Honolulu, Hawaii third slowest; Orlando, Florida fourth slowest; and Toledo, Ohio was fifth slowest.
- T-Mobile was the fastest provider in 73 of the 100 most populous cities in the U.S.. Verizon Wireless was the fastest provider in Denver, Colorado; El Paso, Texas; Henderson, Nevada; Hialeah, Florida; Miami, Florida; and Newark, New Jersey. AT&T was fastest in San Francisco, California. Results were statistically too close to call in 20 cities.
- Verizon has started making inroads on performance, and recorded the best 5G Gaming Experience (who cares about that?).
- AT&T Fiber led in speed and consistency, while Verizon was best for video and gaming experiences.
“With this report, there should now be no doubt that T-Mobile has reigned as the nation’s network champion for years,” said Ulf Ewaldsson, president of technology at T-Mobile. “As 5G solutions continue to evolve, we will be right there, driving the industry forward as we have done since launching the first nationwide 5G network in 2019.”
In a separate report last month, Ookla noted that T-Mobile in March gained access to additional 2.5-GHz spectrum it won at auction 108 in 2022. Similarly, AT&T and Verizon have both benefited from the recent early vacation of C-band spectrum by satellite providers. Furthermore, AT&T acquired additional 3.45-GHz licenses that it won at auction 110 in January 2022.
“Speedtest Intelligence data shows a clear correlation between the release of additional mid-band spectrum, 5G performance, and consumer sentiment for 5G networks, with all three national wireless providers benefiting over the past six months,” said report author Mark Giles, lead industry analyst at Ookla. As a result, he expects 2024 “to drive renewed competitive pressure” between all US service providers.
References:
https://www.ookla.com/research/market-reports/united-states-speedtest-connectivity-report-h12024
https://www.telecoms.com/5g-6g/t-mobile-tops-another-speed-test-as-mid-band-spices-up-the-us
Ookla: T-Mobile and Verizon lead in U.S. 5G FWA
The U.S. is at the forefront of fixed wireless access (FWA) deployments, with many major wireless carriers, including T-Mobile, Verizon, AT&T and UScellular targeting expansion.
T-Mobile has built up a lead in terms of 5G fixed-wireless market share, with Verizon following closely, and AT&T recently launching a new FWA service – AT&T Internet Air. We examined Ookla Speedtest data to understand how FWA performance is evolving in the U.S., and how it is impacting churn in the market.
Key Points:
- T-Mobile & Verizon 5G FWA performance holding up well nationally. Despite strong customer growth, both T-Mobile and Verizon have maintained performance levels over the past year according to Speedtest data. Both ISPs recorded similar median download speeds in Q3 2023, although T-Mobile maintains an edge on median upload performance. Despite this, there are significant differences in performance at a State-level, and for urban versus rural locations.
- Cable & DSL providers bear the brunt of user churn. The FWA value proposition is clearly resonating most with existing cable and DSL customers, which make up the vast bulk of churners to both T-Mobile’s and Verizon’s FWA services. It’s not one-way traffic however, with T-Mobile’s larger user base in particular showing some attrition to cable providers. In rural locations where options are more limited, FWA services are increasingly going head to head, with over 10% of users joining Verizon’s FWA service coming from T-Mobile.
- Clear signs that download performance could be a key contributor to churn in the market. Our analysis of the customers of major ISPs in the US that have churned to T-Mobile’s FWA service shows that their median download performance before churning was below the median performance of all customers of these ISPs, indicating a performance short-fall that is likely contributing towards churn.
- Further C-band spectrum will serve to strengthen FWA’s case. The release and deployment of additional C-band spectrum for all three national cellular carriers, and AT&T’s new FWA service will drive further performance gains, and further competitive pressure in 2024.
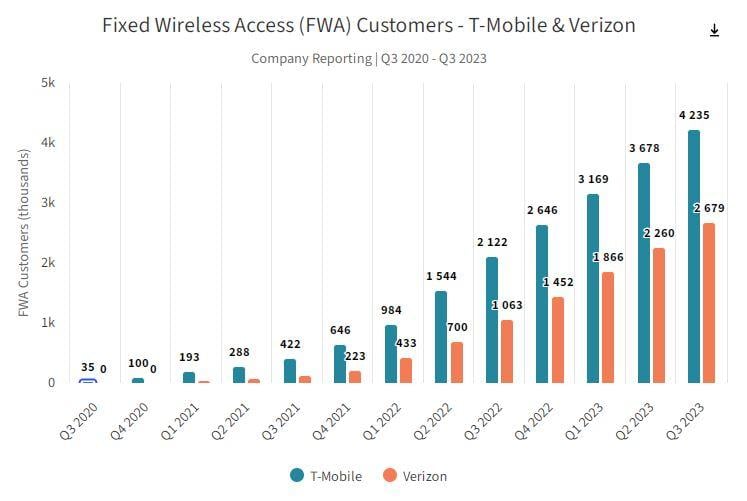
T-Mobile and Verizon FWA scaling strongly and national performance holding up well:
Launched during the COVID-19 pandemic, FWA services from T-Mobile and Verizon have seen strong growth over the past three years. Aided by disruptive pricing strategies, no annual contracts, and ease of installation (self-install), net additions remain strong for both ISPs. T-Mobile’s current FWA plan retails for $50/month, but that falls to $30/month for customers subscribing to its Magenta MAX mobile plan. Verizon prices at a slight premium to T-Mobile, with its FWA service currently retailing for $60/month, but falling to $35/month with select 5G mobile plans. On the back of their success we’ve also recently seen AT&T update its FWA strategy, launching AT&T Internet Air in August 2023, with a similar pricing strategy.
Utilizing the same 5G spectrum that its mobile customer base accesses, both T-Mobile and Verizon have been at pains to point out how they manage the on-boarding of new FWA customers, in order to limit any negative impact on performance for both cellular and FWA customers. The release and rollout of additional C-band spectrum for all three operators will provide extra headroom and the potential for improved 5G FWA performance, while T-Mobile has begun testing 5G Standalone mmWave, and has indicated that this could be utilized for 5G FWA in the future.
Performance on T-Mobile’s and Verizon’s 5G FWA services has held up well to date, although it lags behind median download performance of the major cable and fiber ISPs. The median download speed across the US for all fixed providers combined in Q3 2023 was 207.42 Mbps. T-Mobile has recorded consistent median download speed over the past four quarters, reaching 122.48 Mbps in Q3 2023 based on Speedtest data, but saw its median upload performance erode slightly, down from 19.76 Mbps in Q4 2022, to 17.09 Mbps in Q3 2023. Verizon on the other hand improved its median download performance when compared to Q4 2022, reaching a similar level to T-Mobile, of 121.23 Mbps in Q3 2023. However, its upload performance remained lower than T-Mobile’s, at 11.53 Mbps.
Ookla’s Speedtest data was used to identify the number of churned users since Q2 2022, when FWA services really started to scale and impact the rest of the market. The bulk of churn for both T-Mobile’s and Verizon’s 5G FWA services are coming from cable and DSL providers, confirming what the service providers have said.
The market research firm said that performance on T-Mobile’s and Verizon’s 5G FWA services has held up well to date, although it lags behind median download performance of the major cable and fiber ISPs.
Ookla clocked the median download speed across the U.S. for all fixed providers combined in Q3 2023 at 207.42 Mbps. T-Mobile recorded consistent median download speed over the past four quarters, reaching 122.48 Mbps in Q3 2023 based on Speedtest data, but saw its median upload performance erode slightly, from 19.76 Mbps in Q4 2022 to 17.09 Mbps in Q3 2023.
Meanwhile, Verizon improved its median download performance when compared to Q4 2022, reaching a similar level to T-Mobile, of 121.23 Mbps in Q3 2023. However, its upload performance remained lower than T-Mobile’s, at 11.53 Mbps, Ookla said.
While median performance has remained fairly steady for both operators over the past year, Ookla said it’s a different story when it comes to regional performance and between urban and rural regions.
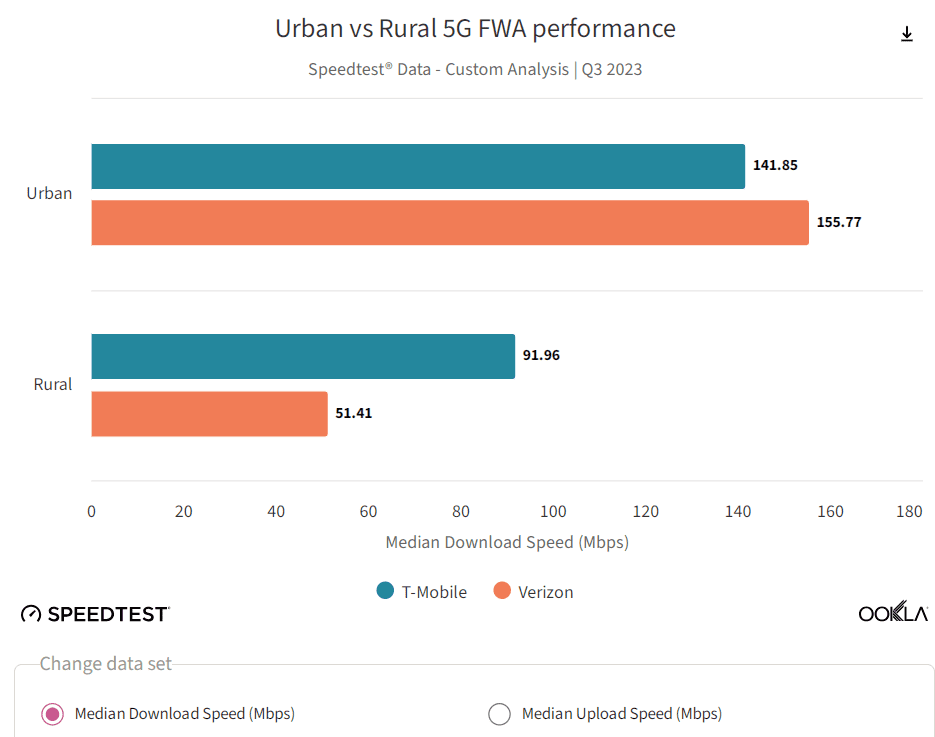
Rural locations – predictably – fared worse than urban locations for both T-Mobile and Verizon 5G FWA service, given differences in spectrum availability and distance from cell sites, although the difference was starker for Verizon’s FWA service, Ookla said. Verizon’s FWA service recorded a median of 155.77 Mbps in urban locations during Q3 2023, but only 51.41 Mbps in rural locations.
T-Mobile increased rural FWA performance, from 82.20 Mbps in Q4 of 2022 to 91.96 Mbps in Q3 2023. Verizon’s performance in urban locations improved, with the 155.77 Mbps it achieved in Q3 2023 representing a sizable increase on the 125.55 Mbps it recorded in Q4 2022.
All of the big mobile operators, including AT&T with Internet Air, will see improved 5G FWA performance with additional C-band spectrum, and T-Mobile could potentially use millimeter wave on its 5G standalone (SA) network for FWA, Ookla noted.
References:
https://www.ookla.com/articles/fixed-wireless-access-us-q3-2023
https://www.fiercewireless.com/wireless/t-mobile-verizon-5g-fwa-performance-holds-ookla
Ookla Q2-2023 Mobile Network Operator Speed Tests: T-Mobile is #1 in U.S. in all categories!
Ookla’s U.S. Mobile and Wireline Speed Overview:
T-Mobile was the fastest mobile operator with a median download speed of 164.76 Mbps. T-Mobile also had the fastest median 5G download speed at 220.00 Mbps, and lowest 5G multi-server latency of 51 ms.
Spectrum edged out Cox as the fastest fixed wireline broadband provider with a median download speed of 243.02 Mbps. Verizon had the lowest median multi-server latency on fixed broadband at 15 ms.

Source: Ookla
……………………………………………………………………………………………………………………….
Ookla’s Speedtest Intelligence® reveals T-Mobile was the fastest mobile operator in the United States during Q2 2023 with a median download speed of 164.76 Mbps on modern chipsets, a slight decline from 165.22 Mbps during Q1 2023. Verizon Wireless and AT&T were distant runners up and both saw minor declines in download speed.
T-Mobile had the fastest median upload speed among top mobile operators in the U.S. at 12.16 Mbps during Q2 2023. Verizon Wireless was second and AT&T finished third.
Calculating median multi-server latency for the three top mobile operators in the U.S. during Q2 2023, T-Mobile had the lowest multi-server latency at 54 ms. Verizon Wireless was a close second at 58 ms. AT&T was third at 63 ms. As latency becomes an increasingly important measure, we’ll be sure to watch latency metrics closely.
In measuring the Consistency of each operator’s performance, we found that T-Mobile had the highest Consistency in the U.S. during Q2 2023, with 86.1% of results showing at least 5 Mbps download and 1 Mbps upload speeds. Verizon Wireless and AT&T followed at 81.5% and 79.2%, respectively.
In measuring the Video Score of each mobile operator’s video performance, we found that T-Mobile had the highest Video Score in the U.S. at 74.39 during Q2 2023. Verizon Wireless was a close second at 70.89 and AT&T was third at 68.16.
Looking at the 5G Video Score of each operator’s video performance over a 5G connection, T-Mobile had the highest 5G Video Score in Q2 2023 at 78.70. Verizon Wireless recorded a 5G Video Score of 77.39 and AT&T had a score of 70.40.
Looking only at tests taken on a 5G connection, T-Mobile had the fastest median 5G download speed in the U.S. at 220.00 Mbps during Q2 2023, in line with its performance during Q1 2023. Verizon Wireless remained second and saw a slight increase to 133.50 Mbps in Q2 2023. AT&T remained third at 86.01 Mbps. The bars shown in the chart below are 95% confidence intervals, which represent the range of values in which the true median is likely to be. For a complete view of commercially available 5G deployments in the U.S. to-date, visit the Ookla 5G Map™.
Our mobile 5G multi-server latency results in Q2 2023 showed that among top providers, T-Mobile registered the lowest median 5G multi-server latency in the United States. Latency was a tight race, but our testing showed that with a median value of 51 ms, T-Mobile users saw better multi-server latency values than those of their nearest competitor, Verizon Wireless (53 ms).
In measuring the Consistency of each operator’s performance over a 5G connection in the U.S. during Q2 2023, we found that there was no statistical winner for highest 5G Consistency.
Our analysis of the most popular devices in the U.S. during Q2 2023 showed no statistical winner for fastest median download speed, with the Samsung Galaxy S23 Ultra and Samsung Galaxy Z Fold4 both recording similar speeds, followed by the Google Pixel 7 Pro, the Apple iPhone 14 Pro Max, and the Samsung Galaxy S22 Ultra.
We examined combined performance by major cell phone manufacturers and found that Samsung devices had the fastest median download speed in the U.S. at 90.83 Mbps during Q2 2023. Apple followed at 75.65 Mbps.
Looking at popular chipsets in the U.S., Ookla found no statistical winner for median download performance between Qualcomm’s Snapdragon 8 Gen 2 at 141.58 Mbps and its previous generation Snapdragon 8+ Gen 1 at 136.85 Mbps. Qualcomm’s Snapdragon X65 5G registered a median download speed of 125.05 Mbps, Google’s Tensor G2 was next on the list at 124.77 Mbps, while Qualcomm’s Snapdragon 8 Gen 1 followed at 117.59 Mbps.
Kansas City, Missouri had the fastest median mobile download speed among the 100 most populous cities in the U.S. at 151.15 Mbps during Q2 2023. Scottsdale, Arizona was second; Columbus, Ohio was third; Plano, Texas fourth; and St. Paul, Minnesota was fifth.
Reno, Nevada had the slowest median mobile download speed among the U.S.’s 100 most populous cities during Q2 2023 at 51.06 Mbps. Anchorage, Alaska was second slowest; Lincoln, Nebraska third slowest; Laredo, Texas fourth slowest; and Tulsa, Oklahoma was fifth slowest.
T-Mobile was the fastest operator in 87 of the 100 most populous cities in the U.S. during Q2 2023. Verizon Wireless was the fastest provider in El Paso, Texas, and results were statistically too close to call in 12 cities.
References:
https://www.speedtest.net/global-index/united-states#market-analysis
Ookla: Fixed Broadband Speeds Increasing Faster than Mobile: 28.4% vs 16.8%
Ookla: State of 5G Worldwide in 2022 & Countries Where 5G is Not Available
Ookla Ranks Internet Performance in the World’s Largest Cities: China is #1
