

Synergy Research Group
U.S. 4 big cloud companies lead world in hyperscale data centers and capacity
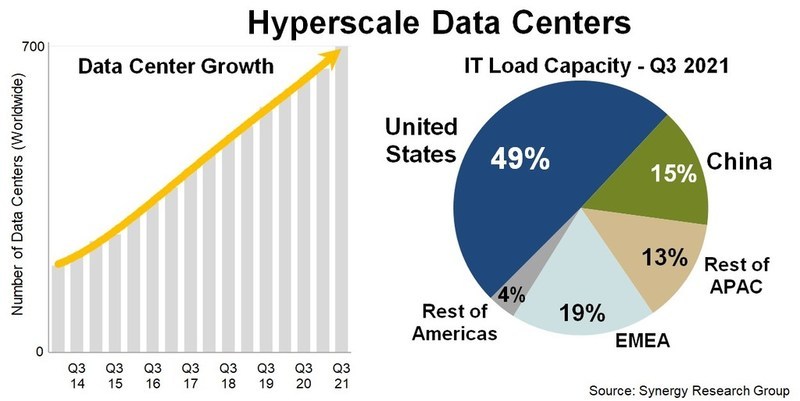
The U.S. continues to lead the world in total hyperscale data centers and worldwide capacity through at least 2026, according to Synergy Research Group. “The United States currently accounts for almost 40% of operational hyperscale data centers and half of all worldwide capacity,” John Dinsdale, chief analyst at Synergy Research Group, wrote in a new report. Synergy’s new hyperscale forecasts show continued rapid growth in the number of large data centers to be used by hyperscale operators in order to support their ever-expanding business operations.
With a current known pipeline of 314 future new hyperscale data centers, the installed base of operational data centers will pass the 1,000 mark in three years’ time and continue growing rapidly thereafter.
The United States currently accounts for almost 40% of operational hyperscale data centers and half of all worldwide capacity. By a wide margin, it is also the country with the most data centers in the future pipeline, followed by China, Ireland, India, Spain, Israel, Canada, Italy, Australia and the UK.
As the installed base of operational data centers continues to grow each year at double-digit percentage rates, the capacity of those data centers will grow even more rapidly as the average size increases and older facilities are expanded.

By data center capacity the leading companies are the usual suspects: Amazon, Microsoft, Google and Facebook, though it is the Chinese hyperscalers that are growing the fastest, most notably ByteDance, Alibaba and Tencent.
The companies that feature most heavily in the future new data center pipeline are Amazon, Microsoft, Facebook and Google. Each has 60 or more data center locations with at least three in each of the four regions – North America, APAC, EMEA and Latin America. Oracle, Alibaba and Tencent also have a notably broad data center presence.
“The future looks bright for hyperscale operators, with double-digit annual growth in total revenues supported in large part by cloud revenues that will be growing in the 20-30% per year range. This in turn will drive strong growth in capex generally and in data center spending specifically,” said John Dinsdale, a Chief Analyst at Synergy Research Group.
“While we see the geographic distribution, build-versus-lease distribution, average data center size and spending mix by data center component all continuing to evolve, we predict continued rapid growth throughout the hyperscale data center ecosystem. Companies who can successfully target that ecosystem with their product offerings have plenty of reasons for optimism.”
Synergy’s Hyperscale Market Tracker research service provides key data and metrics on 19 companies that meet Synergy’s hyperscale definition criteria. The data includes information on the hyperscale data center footprint, a full data center listing, analysis of critical IT load, future data center pipeline, hyperscale operator capex, hyperscale data center spending, company revenues, and five-year forecasts for the key metrics.
Synergy Research Group tracks the data center footprints and expansion plans of 19 of the world’s largest cloud and internet service companies, including the largest providers of infrastructure, platforms, software, search, social media, e-commerce, and gaming.
About Synergy Research Group:
Synergy provides quarterly market tracking and segmentation data on IT and Cloud related markets, including vendor revenues by segment and by region. Market shares and forecasts are provided via Synergy’s uniquely designed online database SIA ™, which enables easy access to complex data sets. Synergy’s Competitive Matrix ™ and CustomView ™ take this research capability one step further, enabling our clients to receive on-going quantitative market research that matches their internal, executive view of the market segments they compete in.
Synergy Research Group helps marketing and strategic decision makers around the world via its syndicated market research programs and custom consulting projects. For nearly two decades, Synergy has been a trusted source for quantitative research and market intelligence.
References:
Synergy Research: Hyperscale Operator Capex at New Record in Q3-2020
Synergy Research: Strong demand for Colocation with Equinix, Digital Realty and NTT top providers
Synergy Research: Ethernet Switch & Router revenues drop to 7 year low in Q1-2020
Synergy Research: Cloud Service Provider Rankings (See Comments for Details)
Synergy Research: Strong demand for Colocation with Equinix, Digital Realty and NTT top providers
New data from Synergy Research Group shows that just 25 metro areas account for 65% of worldwide retail and wholesale colocation revenues. Ranked by revenue generated in Q2 2020, the top five metros are Washington, Tokyo, London, New York and Shanghai, which in aggregate account for 27% of the worldwide market. The next 20 largest metro markets account for another 38% of the market.
Those top 25 metros include eleven in North America, nine in the APAC region, four in EMEA and one in Latin America. The world’s three largest colocation providers are Equinix, Digital Realty and NTT. One of those three is the market leader in 17 of the top 25 metros. The global footprint of Equinix is particularly notable and it is the retail colocation leader in 16 of the top 25 metros. In the wholesale segment Digital Realty is leader in seven of the metros, with NTT, Global Switch and GDS each leading in at least two metros. Other colocation operators that feature heavily in the top 25 metros include 21Vianet, @Tokyo, China Telecom, China Unicom, CoreSite, CyrusOne, Cyxtera, KDDI and QTS.
Over the last twenty quarters the top 25 metro share of the worldwide retail colocation market has been relatively constant at around the 63-65% mark, despite a push to expand data center footprints and to build out more edge locations.
->That seems to indicate that edge computing hasn’t made a wider impact beyond the 25 largest colo metro areas.

Among the top 25 metros, those with the highest colocation growth rates (measured in local currencies) are Sao Paulo, Beijing, Shanghai and Seoul, all of which grew by well over 20% in the last year. Other metros with growth rates well above the worldwide average include Phoenix, Frankfurt, Mumbai and Osaka. While not in the group of highest growth metros overall, growth in wholesale revenues was particularly strong in Washington DC/Northern Virginia and London.
“We continue to see strong demand for colocation, with the standout regional growth numbers coming from APAC. Revenue growth from hyperscale operator customers remains particularly strong, demonstrating the symbiotic nature of the relationship between cloud and colocation,” said John Dinsdale, a Chief Analyst at Synergy Research Group. “The major economic hubs around the world are naturally the most important colocation markets, while hyperscale operators tend to focus their own data center operations in more remote areas with much lower real estate and operating costs. These cloud providers will continue to rely on colocation firms to help better serve major clients in key cities, ensuring the large metros will maintain their share of the colocation market over the coming years.”
About Synergy Research Group
Synergy provides quarterly market tracking and segmentation data on IT and Cloud related markets, including vendor revenues by segment and by region. Market shares and forecasts are provided via Synergy’s uniquely designed online database tool, which enables easy access to complex data sets. Synergy’s CustomView ™ takes this research capability one step further, enabling our clients to receive ongoing quantitative market research that matches their internal, executive view of the market segments they compete in.
References:
https://www.srgresearch.com/articles/top-25-metros-generate-65-worldwide-colocation-revenues
Cignal AI & Del’Oro: Optical Network Equipment Market Decline Continues
Executive Summary & Overview:
Does anyone remember the fiber optic build out boom of the late 1990’s to early 2001? And the subsequent bust, which the industry still has not recovered from!
Fast forward to today, where we hear more and more about huge fiber demand from mega cloud service providers/Internet companies for intra and inter Data Center Connections. And the huge amount of fiber backhaul for small cells and cell towers.
Yet two respected market research firms- Cignal AI and Del’Oro Group– both say that optical network transport equipment revenue declined yet again.
Cignal AI said: “global spending on optical network equipment dropped for a third consecutive quarter, led by a larger than normal seasonal decline in China and weakening trends in EMEA.” However, Cignal AI (Andrew Schmitt) stated that “North American spending increased again quarter-over-quarter, with positive results reported by most vendors. Spending on Metro WDM continues to grow at the expense of LH WDM.”
Del’Oro Group reported in a press release: “revenues for Optical Transport equipment in North America continued to decline in the third quarter of 2017.”
“Optical Transport equipment purchases in North America was about 10 percent lower in the first nine months of 2017,” said Jimmy Yu, Vice President at Dell’Oro Group. “This has been one of the more challenging years for optical equipment manufacturers selling into North America. However, a few vendors in the region performed really well considering the tough market environment. For the first nine months of the year, Ciena was able to hold revenues steady, Cisco was able to grow revenues 14 percent, and Fujitsu experienced only a slight revenue decline,” Mr. Yu added.
–>Please see Editor’s Notes below for additional optical network equipment market insight and vendor perspective.
…………………………………………………………………………………………………………
Cignal AI Report Summary:
- North American spending increased again quarter-over-quarter, with positive results reported by most vendors. Spending on Metro WDM continues to grow at the expense of LH WDM.
- EMEA revenue fell sharply though this was the result of weakness at larger vendors – smaller vendors performed better. As in North America, LH WDM bore the brunt of the decline.
- Last quarter was the weakest YoY revenue growth recorded in China in over 4 years as momentum from 2Q17 spending failed to continue into the third quarter. Spending trends in the region remain difficult to predict.
- Revenue in the rest of Asia (RoAPAC) easedfollowing breakout results in India during 2Q17 though spending remains at historically high levels.
- Quarterly coherent 100G+ port shipments broke 100k units for the first time on a global basis. 100G+ Port shipments in China were flat QoQ and are substantially up YoY.
Cignal AI’s October 29, 2017 Optical Customer Markets Report discovered an unexpected weakness in 2017 optical transport equipment spending from cloud and co-location (colo) operators (see Cignal AI Reports Unexpected Drop in Cloud and Colo Spending). This surprising trend was then further supported by public comments later made by Juniper and Applied Optoelectronics.
Contact Info:
Cignal AI – 225 Franklin Street FL26 Boston, MA – 02110 – (617) 326-3996
Email: [email protected]
…………………………………………………………………………………………………………
Editor’s Notes:
1.One prominent Optical Transport Network Equipment vendor evidently feels the effect of the market slowdown. On November 8, 2017, Infinera reported a GAAP net loss for the quarter of $(37.2) million, or $(0.25) per share, compared to a net loss of $(42.8) million, or $(0.29) per share, in the second quarter of 2017, and net loss of $(11.2) million, or $(0.08) per share, in the third quarter of 2016.
Infinera also announced it is implementing a plan to restructure its worldwide operations in order to reduce its expenses and establish a more cost-efficient structure that better aligns its operations with its long-term strategies. As part of this restructuring plan, Infinera will reduce headcount, rationalize certain products and programs, and close a remote R&D facility.
2. Astonishingly, there’s an India based optical network equipment vendor on the rise. Successful homegrown Indian telecom vendors are hard to come by. That makes Bengaluru-based Tejas Networks something of an anomaly. Started 17 years ago (in 2000), Tejas is one of India’s few hardware producers.
Tejas Networks India Ltd. has made a name for itself in the optical networking market, especially within India, which looks poised for a boom in this sector (mainly due to fiber backhaul of 4G and 5G mobile data traffic). Nearly two thirds of its sales come from India, with the rest earned overseas.
“We are growing at 35% year-on-year and we hope to grow by at least 20% over the next two to three years,” says Sanjay Nayak, the CEO and managing director of Tejas, during an interview with Light Reading. “Overseas, we mainly target south-east Asian, Latin America and African markets.” Telcos in these markets have similar concerns to those in India, explains Nayak, making it easy for Tejas to address their demands.
“R&D is in our DNA and we believe that unless you come up with a differentiated product the market will not take you seriously,” says Nayak. “We have a huge advantage as an Indian player … [which] allows us to provide the product at a lesser price.”
Nayak believes that the experience of developing solutions for the problems faced by Indian telcos has helped the company to address overseas markets as well.
“Our products do very well for networks evolving from TDM to packet, which is a key concern of the Indian telcos,” he explains. “We realized that the US-based service providers were facing a similar problem of cross connect, which we were able to resolve. So, as we say, you can address any market if you are able to handle the Indian market.”
Read more at: http://www.communicationstoday.co.in/daily-news/17152-india-s-tejas-eyes-bigger-slice-of-optical-market
3. The long haul optical transport market is dominated by OTN (Optical Transport Network) equipment (which this editor worked on from 2000 to 2002 as a consultant to Ciena, NEC, and other optical network equipment and chip companies).
The OTN wraps client payloads (video, image, data, voice, etc) into containers or “wrappers” that are transported across wide area fiber optic networks. That helps maintain native payload structure and management information. OTN offers key benefits such as reduction in transport cost and optimal utilization of the optical spectrum.
OTN technology includes both WDM and DWDM. The service segment includes network maintenance and support services and network design & optimization services. On the basis of component, the market is divided into optical switch and optical transport. Based on end user, it is classified into government and enterprises.
According to Allied Market Research, OTN equipment market leaders include: Adtran, Inc., ADVA Optical Networking, Advanced Micro Devices Inc., Fujitsu, Huawei Technologies., ZTE Corporation., Belkin Corporation., Ciena Corporation., Coriant, and Allied Telesyn.
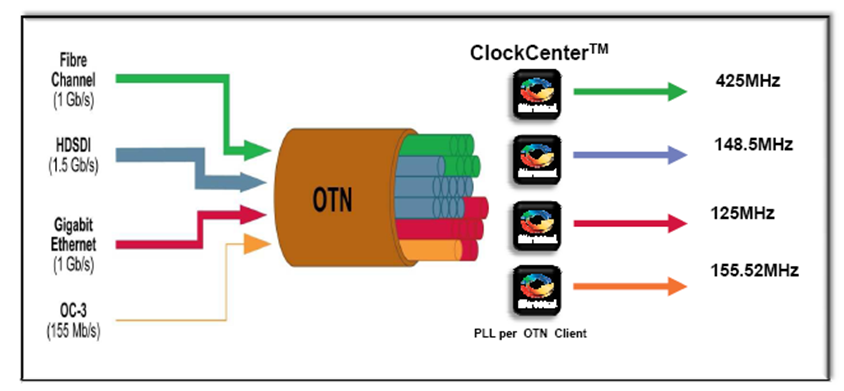
Above illustration courtesy of Allied Market Research
………………………………………………………………………………………………..
Note that Cisco offers OTN capability on their Network Convergence System (NCS) 4000 – 400 Gbps Universal line card. Despite that and other OTN capable gear, Cisco is not covered in the above mentioned Allied Market Research OTN report.
………………………………………………………………………………………………………………….
Global Switching & Router Market Report:
Separately, Synergy Research Group said in a press release that:
Worldwide switching and router revenues were well over $11 billion in Q3 and were $44 billion for last four quarters, representing 3% growth on a rolling annualized basis. Ethernet switching is the largest of the three segments accounting for almost 60% of the total and it is also the segment that has by far the highest growth rate, propelled by aggressive growth in the deployment of 100 GbE and 25 GbE switches.
In Q3 North America remained the biggest region accounting for over 41% of worldwide revenues, followed by APAC, EMEA and Latin America. The APAC region has been the fastest growing and this was again the case in Q3, with growth being driven in large part by spending in China, which benefited Huawei in particular.
Cisco’s share of the total worldwide switching and router market was 51%, with shares in the individual segments ranging from 63% for enterprise routers to 38% for service provider routers. Cisco is followed by Huawei, Juniper, Nokia and HPE. Their overall switching and router market shares were in the 4-10% range in Q3. There is then a reasonably long tail of other vendors, with Arista and H3C being the most prominent challengers.
![S&R Q317[1]](http://www.globenewswire.com/news-release/2017/11/27/1206112/0/en/photos/494670/0/494670.jpg?lastModified=11%2F27%2F2017%2004%3A20%3A07&size=3)
“The big picture is that total switching and router revenues are still growing and Cisco continues to control half of the market,” said John Dinsdale, a Chief Analyst at Synergy Research Group. “Some view SDN and NFV as existential threats to Cisco’s core business, with own-design networking gear from the hyperscale cloud providers posing another big challenge. While these are genuine issues which erode growth opportunities for networking hardware vendors, there are few signs that these are substantially impacting Cisco’s competitive market position in the short term.”
Contact Info:
To speak to a Synergy analyst or to find out more about how to access Synergy’s market data, please contact Heather Gallo @ [email protected] or at 775-852-3330 extension 101.
