Sabotage or Accident: Was Russia or a fishing trawler responsible for Shetland Island cable cut?
Most telecom professionals, analysts, and media don’t realize how dependent the world is on a limited number of fiber-optic subsea cables that form the internet’s spine and electronically link our continents and islands. Currently 95% of international internet traffic is transmitted by undersea cables. Satellites, in comparison, convey very little internet traffic.
There are still only about 200 cables around the world, each the size of a large hose pipe and capable of data transfers at about 200 terabytes per second. These cables lie on the ocean floor, while nearer to the shore they are buried under the seabed for additional protection. They carry an estimated $10 trillion worth of financial transactions every day and come together at 10 or so international chokepoints, which are particularly vulnerable.
On October 20th, the subsea cable connecting Shetland and the Faroe Islands was damaged with a separate cable linking Shetland with the Scottish mainland also being cut. BT Group, which provides communications services through the cables, said engineers had been working “flat out” to repair the damage – which had primarily impacted mobile and broadband connections.
A BT spokesperson said: “While both cable links are being repaired by subsea engineers, engineers were able to reconnect all services via a temporary solution on Thursday afternoon.”
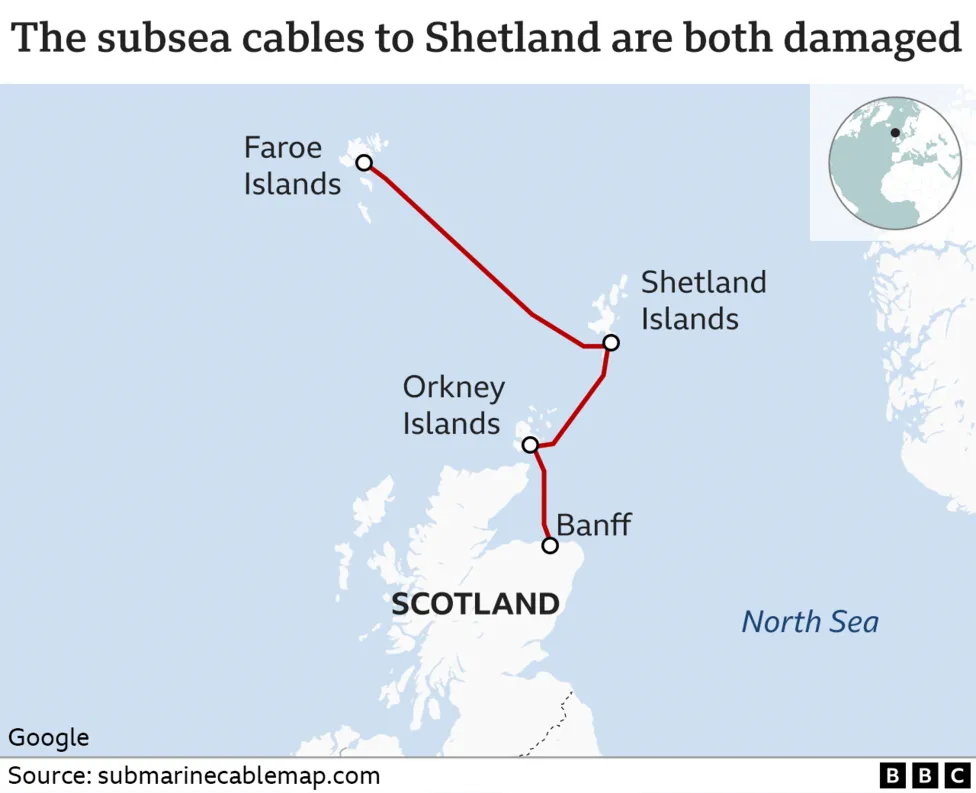
Although the BBC attributed the Shetland subsea cable damage to a fishing trawler, there is speculation that Moscow may have been the culprit. The Financial Times (and other sources) reported that Russia’s Boris Petrov scientific research ship, was tracked in the vicinity of the Shetland Isles cables when they were cut. Since it’s designated a ‘vessel of interest’ by western navies, there’s every chance the fault could have been an example of Russia’s hybrid warfare.
The FT wrote: “The presence of a Russian underwater research ship, and the recent trio of underwater explosions that severed the Nordstream gas pipeline, make Moscow sabotage far more plausible.
Lord West, the former head of the Royal Navy, told Talk Radio: “In the Shetlands recently, where power was lost a couple of times and I’m sure it was probably a dredger or a trawler did it. “But actually there was a Russian ship of the type that can cause damage to damaged pipelines in that region. And hopefully, we are monitoring very closely making sure we’re seeing what they are doing.”
Alexander Lord, a Europe and Eurasia analyst at Sibylline told Express.co.uk: “I think in the instance of the Shetland Islands I think that’s a really interesting one to watch. Obviously, accidents do happen, and these undersea cables do occasionally get damaged by fishing trawlers, for example.
“But I think it is notable and indeed local officials have noted that it’s highly unusual that two cables were damaged in quick succession and that’s what we’ve seen this week, it is what’s caused some of the problems in Shetland. In terms of the vulnerability of European critical infrastructure, maritime assets, for example, including undersea cables will remain particularly vulnerable, undersea pipelines as well.”
The FT noted that UK Prime Minister Rishi Sunak wrote a paper in 2017 on the growing sabotage threat to subsea cables. From that paper: “In the digital age of cloud computing, the idea that steel and plastic pipes are integral to our life seems anachronistic,’ wrote Rishi Sunak. ‘But our ability to transmit confidential information, to conduct financial transactions and to communicate internationally all depend upon a global network of physical cables lying under the sea.’ And what if those cables are cut? The threat is nothing short of existential.”
In his 2017 paper, Sunak made several recommendations for fortifying the security of undersea cables. These included incentivising private businesses such as Google and Facebook, which own or finance much of the global cable network, to back up systems and distribute cables more widely. But nothing was done.
The UK has around 60 undersea cables. If several of these were cut or disrupted, the consequences would be disastrous. Now that Sunak is the UK PM, will he invest in protective maritime and submarine capabilities as he recommended in his 2017 paper?
This past January, Admiral Tony Radakin, the head of the British Armed Forces, observed that ‘Russia has grown the capability to put at threat those undersea cables and potentially exploit undersea cables.’ It’s now crunch time for the UK!
References:
https://www.bbc.com/news/uk-scotland-north-east-orkney-shetland-63337473
https://www.ft.com/content/0ddc5b48-b255-401b-8e9f-8660f4eab37b
https://www.spectator.co.uk/article/the-threat-to-britains-undersea-cables/
Cable One invests $50 million in Ziply Fiber after its JV called Clearwire Fiber
Cable One [1.] has invested $50 million to acquire a minority stake in northwestern U.S. wireline network operator Ziply Fiber [2.]. Although the investment was made on September 6th, it was first announced Thursday November 3rd when Cable One Chair and CEO Julie Laulis revealed the investment during the company’s Q3 2022 earnings call. She referred to Ziply Fiber as Cable One’s “newest strategic growth partner.” A Ziply representative confirmed the sum from Cable One was part of the $450 million in new funding it announced on September 8th.
Note 1. Cable One is an American broadband communications provider. Under the Sparklight brand, it provides service to 21 states and 900,000 residential and business customers. It is headquartered in Phoenix, Arizona, though it does not serve that metro area.
Note 2. Ziply Fiber was formed from the acquisition of Frontier Communications operations in Washington, Oregon and Montana. Ziply has an ambitious fiber buildout/upgrade plan with the launch of symmetrical, multi-gigabit broadband speed tiers.
…………………………………………………………………………………………………………………………………………………………..
In a 10-Q filing, Cable One stated it invested an initial $22.2 million in Ziply in November 2022 and expects to invest the remaining $27.8 million before the end of September 2023. Its investment netted the company less than a 10% equity interest in Ziply.
“We are investing alongside proven operational and financial leaders that we have maintained long-term trusted relationships with and they continue to demonstrate the ability to deliver strong results and shareholder returns that align with our rigorous standards,” a Cable One spokesman told Light Reading.
Other highlights from Cable One’s Q3-2022 results and earnings call:
- Total revenues were $424.7 million in the third quarter of 2022 compared to $430.2 million in the third quarter of 2021. Year-over-year, residential data revenues increased 6.3% and business services revenues decreased 11.5%. Revenues for the third quarter of 2022 included $4.9 million from CableAmerica(1) operations. Revenues for the third quarter of 2021 included $16.3 million from operations that were contributed to Clearwave Fiber(1) and from the Divested Operations, of which a substantial majority consisted of business services revenues.
- Net income was $70.6 million in the third quarter of 2022, an increase of 35.1% year-over-year. Adjusted EBITDA was $224.6 million in the third quarter of 2022, an increase of 1.9% year-over-year. Net profit margin was 16.6% and Adjusted EBITDA margin(2) was 52.9%.
- Revenues decreased $5.5 million, or 1.3%, to $424.7 million for the third quarter of 2022 due primarily to the contribution of operations to Clearwave Fiber and the disposition of the Divested Operations during 2022 that collectively generated $16.3 million of revenues in the prior year quarter, predominantly consisting of business services revenues, and decreases in residential video and residential voice revenues. The decrease was partially offset by increases in higher margin residential data and business services revenues from continuing operations and the addition of CableAmerica operations.
- Cable One, like other cable operators, is seeing a slowdown in consumer move activity across its footprint. The operator posted an organic gain of just 1,800 broadband subs in the quarter, according to MoffettNathanson, a division of SVB Securities.
- Sell-in for 1-Gig service has accelerated to nearly 32%.
- Cable One’s average revenue per user (ARPU) rose 15%, to $80.46, as customers migrated to faster, higher-priced services or took an unlimited data plan.
- Rate increases are “absolutely on the table,” Laulis said.
- Average data usage reached about 580 gigabytes per month in Q3, up 19% year-over-year.
- Cable One, which has DOCSIS 4.0 on its roadmap, has tested symmetrical multi-gigabit speeds, but did not say when it might launch such services.
- FWA adoption in Cable One’s markets “remains low,” Laulis said.
- Video losses hit 18,000, widened from a year-ago loss of 8,000. Reflecting Cable One’s de-emphasis on video and its laser-focus on broadband, the company’s video base eroded by another 28% year-over-year.
At the start of 2022, Cable One along with three private equity companies formed a joint venture called Clearwave Fiber, aiming to reach 500,000 rural locations by 2027. Cable One contributed assets from its Illinois-focused Clearwave Communications and South Carolina-based Hargray Communications businesses as part of the deal. Shortly after its formation, Clearwave Fiber acquired the assets of Kansas-based operator RG Fiber to gain a foothold in the state.
Earlier this week, Clearwave Fiber revealed it has already crossed the 100,000 passings mark. By the end of this year, the company said its services will be available in a total of 35 markets across four states: Illinois, Kansas, Georgia and Florida.
References:
Cable One joint venture to expand fiber based internet access via FTTP
Ziply Fiber deploys 2 Gig & 5 Gig fiber internet tiers in 60 cities – AT&T can now top that!
Frontier Communications and Ziply Fiber to raise funds for fiber optic network buildouts
https://www.lightreading.com/cable-tech/cable-one-invests-$50m-in-ziply-fiber/d/d-id/781591
https://www.fiercetelecom.com/broadband/cable-one-doubles-down-fiber-50m-ziply-investment
FCC establishes Space Bureau dedicated to satellite industry oversight
The Federal Communications Commission (FCC) has set up a new bureau dedicated to improving the agency’s oversight of the satellite industry. It is one of two new offices to come out of an internal reorganization at the FCC, which has also created a standalone office of international affairs.
According to the FCC, the changes will help the agency fulfill its statutory obligations and to keep pace with the rapidly changing satellite industry and global communications policy. Establishing a standalone Space Bureau will elevate the importance of satellite programs and policy internally, and will also acknowledge the role of satellite communications in advancing domestic communications policy, according to the agency.
“The satellite industry is growing at a record pace, but here on the ground our regulatory frameworks for licensing them have not kept up. Over the past two years the agency has received applications for 64,000 new satellites. In addition, we are seeing new commercial models, new players, and new technologies coming together to pioneer a wide-range of new satellite services and space-based activities that need access to wireless airwaves,” said FCC Chairwoman Rosenworcel in her prepared remarks.
After identifying space tourism, satellite broadband, disaster recovery efforts and more, Rosenworcel said the interest in space as a new market for investment and a home for new kinds of services is vast. She noted that “private investment in space companies has reached more than $10 billion in the last year, the highest it has ever been.”
She also said that “the space sector has been on a monumental run. Satellite operators set a new record last year for the number of satellites launched into orbit, a record they will surpass again.”
Under the Communications Act of 1934, the FCC licenses radio frequency uses by satellites and ensures that space systems reviewed by the agency have sufficient plans to mitigate orbital debris.
The FCC said also that creating the two new separate offices will allow expertise to be more consistently leveraged across the organization’s different bureaus.
Commenting on the reorganization, FCC Chairwoman Rosenworcel said: “The satellite industry is growing at a record pace, but here on the ground our regulatory frameworks for licensing them have not kept up. Over the past two years, the agency has received applications for 64,000 new satellites. In addition, we are seeing new commercial models, new players, and new technologies coming together to pioneer a wide-range of new satellite services and space-based activities that need access to wireless airwaves.”
“Today, I announced a plan to build on this success and prepare for what comes next,” she added. “A new Space Bureau at the FCC will ensure that the agency’s resources are appropriately aligned to fulfill its statutory obligations, improve its coordination across the federal government, and support the 21st century satellite industry.”
Jennifer Warren, VP of technology, policy and regulation at Lockheed Martin, said during a panel following Rosenworcel’s announcement that the stakes are much bigger than broadband satellite launches. This new regulatory framework can clear the way for the US to be a leader in “the commercialization of space,” she said. “It’s not for the faint-hearted.”
The FCC bureau reorg “also gives encouragement to new space actors that there will be staff accessible to answer the many questions they must have as they try to enter this exciting industry,” according to Julie Zoller, Head of Global Regulatory Affairs, Project Kuiper at Amazon. “It’s a complex process, but it is one that is full of opportunity and benefits to consumers, as Chairwoman Rosenworcel mentioned. The number of broadband satellite systems is really supercharging the ability to bridge the digital divide curve at home and abroad.”
In August, the FCC signed a joint memorandum of understanding with the NTIA aimed at improving the coordination of federal spectrum management and efficient use of radio frequencies.
References:
FCC establishes new bureau dedicated to satellite industry oversight
https://www.lightreading.com/satellite/the-fcc-takes-its-bureaucracy-beyond-stars/d/d-id/781568
Frontier’s Big Fiber Build-Out Continued in Q3-2022 with 351,000 fiber optic premises added
Frontier Communicatons massive fiber build-out continued in the third quarter (Q3-2022), as the company added record number of fiber subscribers to reach a total of 4.8M fiber locations. Frontier is poised to reach 5 million locations passed with fiber-to-the-premises (FTTP) networks this month, putting it at the halfway point toward a goal to reach at least 10 million locations with fiber by the end of 2025. The company added a record 64,000 fiber subscribers, beating the 57,000 expected by analysts. That helped to offset greater than expected copper subscriber losses of -58,000. Consumer fiber Q3 revenue climbed 14% to $424 million while consumer copper fiber dropped 3% to $361 million.
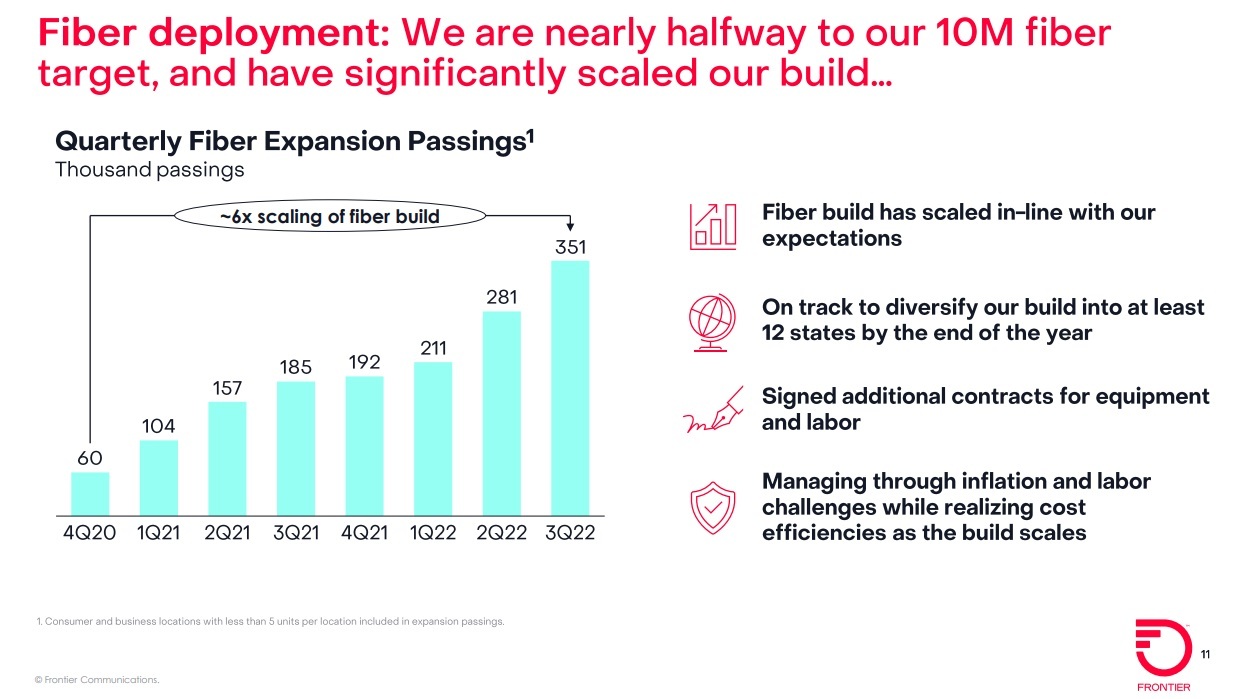
Frontier built FTTP to a record 351,000 fiber optic premises in Q3-2022, handily beating the 185,000 built out in the year-ago quarter and the 281,000 built in Q2 2022. Frontier ended Q3 with 1.50 million fiber subs, up 16% versus the year-ago quarter.
“We delivered another quarter of record-breaking operational results,” said Nick Jeffery, President and Chief Executive Officer of Frontier. “Our team set a new pace for building and selling fiber this quarter. At the same time, we radically simplified our business and delivered significant cost savings ahead of plan. This is a sign of a successful turnaround.
“Our team has rallied around our purpose of Building Gigabit America and is laser-focused on executing our fiber-first strategy. As the second-largest fiber builder and the largest pure-play fiber provider in the country, we are well-positioned to win.”
Third-quarter 2022 Highlights:
- Built fiber to a record 351,000 locations to reach a total of 4.8 million fiber locations, nearly halfway to our target of 10 million fiber locations
- Added a record 66,000 fiber broadband customers, resulting in fiber broadband customer growth of 15.8% compared with the third quarter of 2021
- Revenue of $1.44 billion, net income of $120 million, and Adjusted EBITDA of $508 million
- Capital expenditures of $772 million, including $18 million of subsidy-related build capital expenditures, $442 million of non-subsidy-related build capital expenditures, and $170 million of customer-acquisition capital expenditures.
- Net cash from operations of $284 million, driven by healthy operating performance and increased focus on working capital management
- Nearly achieved our $250 million gross annual cost savings target more than one year ahead of plan, enabling us to raise our target to $400 million by the end of 2024
In Frontier’s “base” fiber footprint of 3.2 million homes (in more mature areas where fiber’s been available for several years), penetration rose 30 basis points in Q3 to 42.9%. “When we look at the growth over the past year, we see a clear path to achieving our long term target of 45% penetration in our base markets,” Frontier CEO Nick Jeffery said.
Penetration rates in Frontier’s expansion fiber footprint for the 2021 cohort is on target and is exceeding expectations in the 2020 expansion fiber footprint, he said.
Fiber ARPU (average revenue per user) was up 2.6% year-over-year, but came a little short of expectations thanks in part to gift card promotions. Frontier’s consumer fiber ARPU, at $62.97, missed New Street Research’s expectation of $63.67 and a consensus estimate of $64.51. Copper ARPU, however, beat estimates: $49.65 versus an expected $48.57.
Frontier CEO Jeffery said faster speeds remain a top ARPU driver, with 45% to 50% of new fiber subs selecting tiers offering speeds of 1Gbit/s or more. Fiber subs taking speeds of 1Gbit/s or more now make up 15% to 20% of Frontier’s base, up from 10% to 15% last quarter, he said.
Frontier currently has no plans to raise prices due to inflation and other economic pressures, but the company left the door open to such a move.
“We’ll be a rational pricing actor in this market,” Jeffery said. “If those [inflationary pressures] don’t moderate, then of course we maybe consider pricing actions to compensate…just as we’re seeing others doing.”
Frontier also has no immediate plans to strike an MVNO deal that would enable it to use mobile in a bundle to help gain and retain broadband subscribers – a playbook already in use by Comcast, Charter Communications, WideOpenWest and Altice USA.
As churn rates remain stable and low, Jeffery explained, “the argument for using some of that scarce capital to divert into an MVNO to solve a problem that we don’t yet have, I think, would probably not make our shareholders super happy.” Importantly, Frontier has experience in the mobile area from execs who previously worked at Vodafone, Verizon and AT&T.
“We’re watching it very closely and if consumer behavior changes or if the market changes in a material way that impacts us such that moving some of our scarce capital to build or partner with an MVNO would be a smart thing to do, we’ll do it and we’ll do it very quickly,” Jeffery said. “But now isn’t the moment for us.”
Frontier ended the quarter with $3.3 billion of liquidity to fund its fiber build. Beasley said Frontier has additional options if needed, including taking on more debt, selling non-core real estate assets, access to government subsidies and the benefits of a cost-savings plan that has exceeded the target (from an original $250 million to $400 million).
References:
The conference call webcast and presentation materials are accessible through Frontier’s Investor Relations website and will remain archived at that location.
https://events.q4inc.com/attendee/387527166
https://www.lightreading.com/broadband/frontiers-big-fiber-build-nears-halfway-point-/d/d-id/781503?
JC Market Research: 5G FWA market to reach $21.7 billion in 2029 for a CAGR of 65.6%
Introduction:
According to JC Market Research, the 5G fixed wireless access (FWA) market was valued at US $296 million in 2021. In a new report ““Worldwide 5G Fixed Wireless Access (FWA) Industry Analysis,” the market research firm forecasts that global 5G FWA rеvеnuе will rеасh а vаluе оf UЅ$ 21,710 million іn 2029. That’s a remarkable CAGR of 65.6% over the forecast period.
Yesterday, we posted an article on South Africa’s Telkom deploying 5G FWA before 5G mobile and it appears that 5G FWA is a stronger use case than 5G mobile.

Glоbаl 5G Fixed Wireless Access (FWA) Industry Dуnаmісѕ:
In many of smart cities, 5G IoT will be the technology of choice for niche applications. Smart cities, with applications such as HD cameras to monitor safety, Smart energy, such as smart grid control, smart security, including the provision of emergency services and connected health, such as mobile medical monitoring is possible with the help of 5G networks. Advanced sensing for environmental monitoring can be done using this module.
The increasing adoption of connected devices such as smartphones, laptops, and smart devices in several commercial and residential applications such as distance learning, autonomous driving, multiuser gaming, videoconferencing, and live streaming, as well as in telemedicine and augmented reality, is expected to generate the demand for 5G fixed wireless access solutions to achieve extended coverage.
Global 5G Fixed Wireless Access (FWA) Industry Analysis Маrkеt Drіvеrѕ Rеgіоnаl Ѕеgmеntаtіоn аnd Аnаlуѕіѕ:
Rеgіоn-wіѕе ѕеgmеntаtіоn in the global 5G fixed wireless access (FWA) industry іnсludеѕ North Аmеrіса, Еurоре, Аѕіа Расіfіс, Ѕоuth Аmеrіса, аnd the Міddlе Еаѕt & Аfrіса. North Аmеrіса ассоuntѕ for hіghеѕt rеvеnuе ѕhаrе in the global 5G fixed wireless access (FWA) industry analysis market, аnd іѕ рrојесtеd tо rеgіѕtеr а rоbuѕt САGR оvеr thе fоrесаѕt реrіоd. While serving rural markets and developing nations is still a costly proposition, governments around the globe stand ready to provide aid. In the USA, phase two of the Connect America Fund (CAF) is supporting broadband initiatives in underserved communities. The connecting Europe Broadband fund is performing a similar role for underserved populations in EU member countries.
The report also indicated that North Аmеrіса, Еurоре, Аѕіа Расіfіс, Ѕоuth Аmеrіса аnd the Міddlе Еаѕt & Аfrіса as FWA market leaders.
JC Market Research is not the only research firm exploring the potential growth of the FWS market; ABI Research forecasts that the total number of FWA subscriptions will grow from 81 million globally in 2021 to slightly over 180 million in 2026, representing a Compound Annual Growth Rate (CAGR) of 17%. Consequently, ABI Research believes that global FWA Customer Premises Equipment (CPE) shipments will reach 47 million annually by 2026, with 5G FWA CPE making up the majority of shipments by the same year.
References:
https://jcmarketresearch.com/report-details/1538805/discount
5G FWA launched by South Africa’s Telkom, rather than 5G Mobile
5G fixed wireless access market to reach $22 million in 2029: Report
LightCounting: Optical components market to hit $20 billion by 2027+ Ethernet Switch ASIC Market Booms
|
The optical communications industry entered 2020 with very strong momentum. Demand for DWDM, Ethernet, and wireless fronthaul connectivity surged at the end of 2019, and major shifts to work-at-home and school-at-home in 2020 and 2021 due to the COVID-19 pandemic created even stronger demand for faster, more ubiquitous, higher reliability networks.
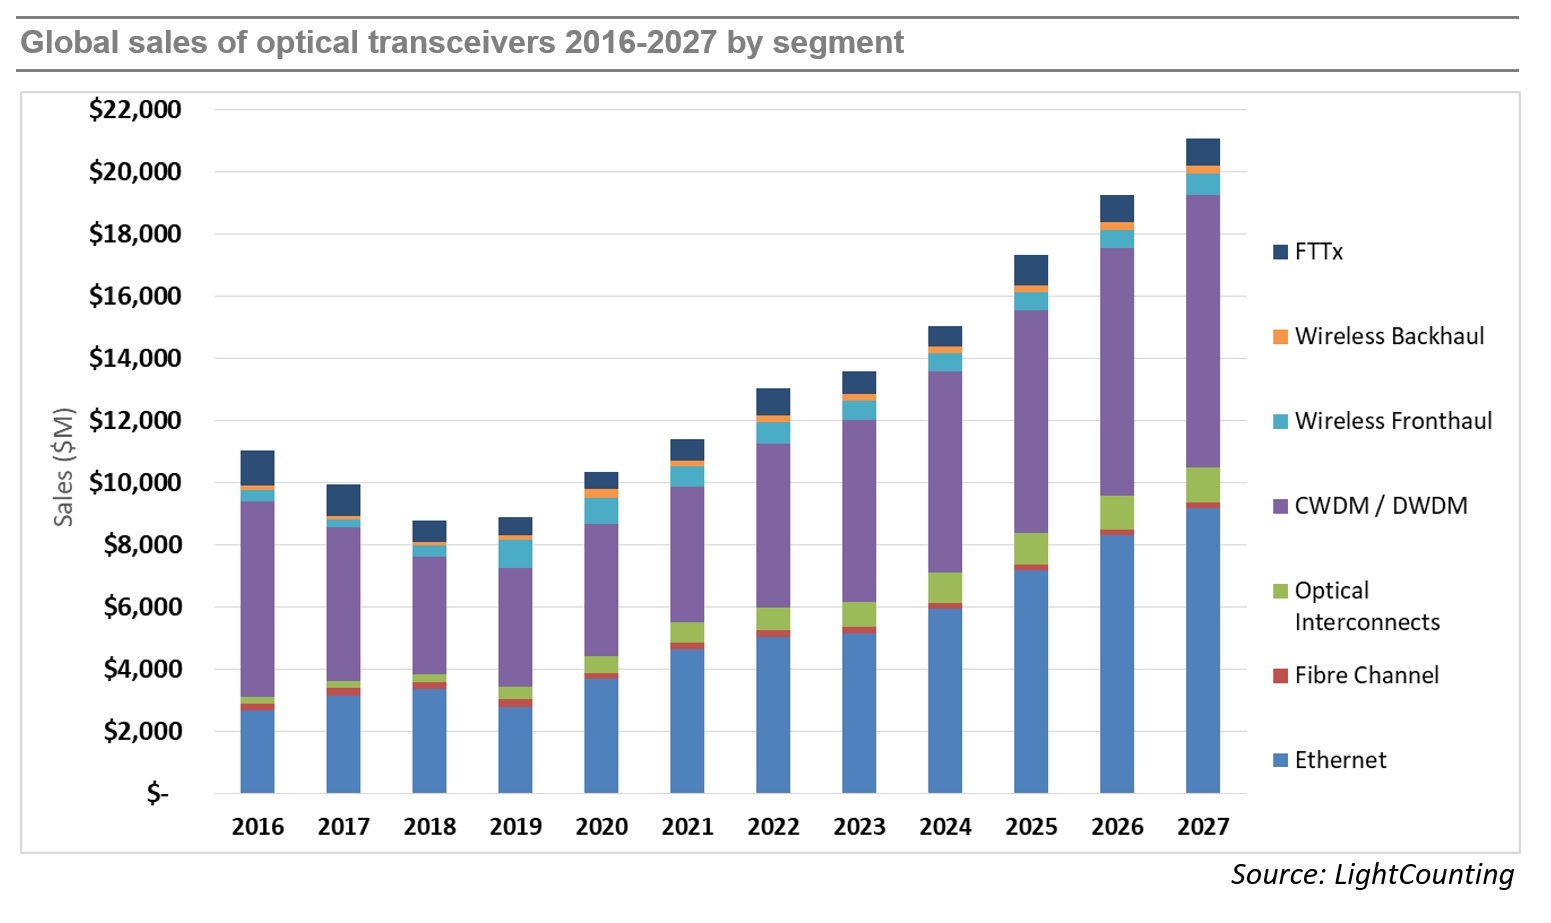
While supply chain disruptions continued, the industry was able to largely overcome them, and the market for optical components and modules saw strong growth in 2020 and 2021, as shown in the figure below. Light Counting believes the transceiver market is on track for another year of strong (14%) revenue growth in 2022, after increasing by 10% in 2021, and 17% in 2020. However, market growth is projected to slow to 4% in 2023, prior to recovering in 2024-2025.
Demand for optics is strong across all market segments, but continuing bottlenecks in the global supply chain negatively impacted sales of 400G DR4 and 100G DR1+ transceivers to Amazon in the first 9 month of 2022. Meta increased its deployments of optics sharply this year, but its latest forecast for 2023 has been reduced substantially. We suspect that Amazon and other cloud companies may moderate their investments in 2023, if the current economic slowdown continues to negatively impact their advertising, streaming, and retail businesses.
|
 |
|
LightCounting’s latest forecast projects a 11% CAGR in 2022-2027, not very different from the 13% CAGR in the forecast published in October 2021. Strong sales of DWDM and Ethernet optics accounted for most of the market growth in 2021 and these segments are projected to lead the growth in 2022-2027. Sales of optical interconnects, mostly Active Optical Cables (AOCs), will also increase at double digit rates over the next 5 years. PON sales for FTTx networks will remain steady, as the China market ends its 10G cycle and North America and Europe ramp up 10G PON deployments, driven by government funding programs. 25G and 50G PON provide new growth later in the forecast period. Wireless fronthaul is one area of weakness, since 5G network deployments in China are reaching completion. This segment will return to growth in 2026-2027 with the onset of 6G deployments (which we don’t think will happen till many years later).
…………………………………………………………………………………………………………………………………………………………….
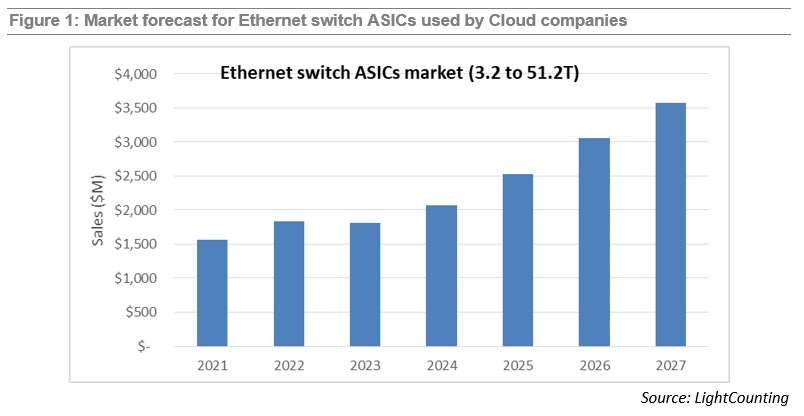
Demand for Ethernet switches from Cloud companies created a new market segment for very high bandwidth switches and switch ASICs. It also transformed the industry supply chain as Cloud companies started using internally designed Ethernet switches and opening these “white box” designs to a broader community. LightCounting’s report on Ethernet switch ASICs was first published in April 2022, and today the first update has been released. The report covers the most interesting segment of the switching ASIC market – high bandwidth (3.2T and above), low latency chips deployed in Cloud datacenters. The report offers brief profiles of the leading suppliers of merchant switch ASIC and system integrators, offering products to Cloud companies, and includes a forecast for sales of 3.2 to 51.2T switch ASICs. The updated report now includes 3.2T/6.4T chips in addition to the higher speed products. This change added close to $1 billion to the total market size compared to our April estimate. The forecast includes chips sold in the merchant market as well as chips used by Cisco in their own equipment (captive market). A lower forecast for 2023 compared to our April 2022 edition reflects reduced guidance by the leading Cloud companies for datacenter upgrades planned for next year. Despite a reduced forecast, the overall market is expected to roughly double in size from $1.8 billion in 2023 to $3.6 billion in 2027.
References:
|
5G FWA launched by South Africa’s Telkom, rather than 5G Mobile
South African telecommunications operator Telkom [1.] has launched its 5G high speed Internet network using technology from China’s Huawei Technologies. The partially state-owned operator said it will initially use the network to provide fixed wireless Internet via 5G rather than focusing on mobile 5G.
“At launch Telkom will primarily focus on providing super fast 5G fixed wireless access solutions, as the demand for mobile 5G increases, we will supplement this with suitable mobile propositions,” Telkom Consumer and Business CEO Lunga Siyo explained.
Note 1. Telkom is South Africa’s third largest network operator with 17.6 million users in the third quarter of 2022, according to statistics from market research company Omdia. Vodacom remains South Africa’s largest operator with over 52 million users while MTN has about 36 million customers.
……………………………………………………………………………………………………………………………………………
Telkom joins its competitors Vodacom, MTN and Rain in the quest to provide high speed Internet in South Africa. Data-only network Rain rolled out its 5G services in 2019 and Vodacom and MTN followed with commercial launches in 2020.
Telkom said it will use its 125 5G base stations located in the provinces of Gauteng, KwaZulu-Natal, Eastern Cape and Western Cape at launch.
The telco’s managing executive Lebo Masalesa said the company is rolling out 5G nationally and in smaller towns, with the intention to build network where it is needed.
“Once there is a greater proliferation of 5G capable mobile devices on Telkom’s network, it will launch 5G services for mobile users,” he added.
“5G stands head and shoulders above 4G and LTE through faster and more reliable connection it provides, however it was critical for us to make sure that our existing 4G ecosystem remains strong whilst introducing 5G into the market,” continued Siyo.
The South African network operator invested 2.1 billion South African rand (US$116 million) for 42MHz of frequencies in the spectrum auction by the Independent Communications Authority of South Africa (ICASA), supporting its network upgrades.
“The COVID pandemic has driven significant lifestyle changes for South Africans, due to work from home or school from home, online shopping and an ‘always on’ kind of culture,” said Fortune Wang, Carrier Business Director for Huawei South Africa.
“At launch Telkom will primarily focus on providing super fast 5G fixed wireless access solutions, as the demand for mobile 5G increases, we will supplement this with suitable mobile propositions,” said Lunga Siyo, chief executive officer of Telkom Consumer and Business.
Shunned in the global north due to security concerns, which Huawei has denied, the Chinese company dominates in Africa as a supplier of equipment to many telecoms operators.
Telkom SA’s commercial 5G rollout comes on the back of Safaricom in Kenya making a similar announcement last week about a focus on retail and enterprise customers for 5G rather than mobile, as it launched its 5G Internet service following trials that started in March 2021.
Furthermore, the commercial 5G launch comes after MTN walked away from talks to acquire Telkom. The talks between the two companies stalled when the data-only network operator Rain offered its network up to Telkom SA to acquire, in a move that stood in the way of MTN’s plans to buy Telkom.

References:
https://www.euronews.com/next/2022/10/27/telkom-sa-huawei-tech-5g
Global Data Center Colocation Market Size forecast = $131.8 Billion by 2030 at a 14.2% CAGR
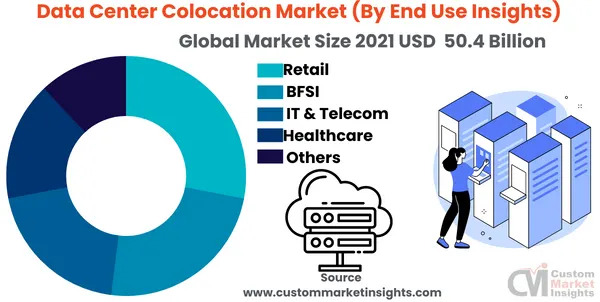
According to a market research study published by Custom Market Insights, the Global Data Center Colocation Market size and share revenue was valued at approximately USD $50.4 Billion in 2021 and is expected to reach USD $57.2 billion in 2022 and is expected to reach around USD $131.8 Billion by 2030, at a CAGR of 14.2% between 2022 and 2030.
The key market players listed in the report with their sales, revenues and strategies are China Telecom Corp. Ltd., CoreSite Realty Corp., CyrusOne Inc., NaviSite, NTT Communications Corp., Cyxtera Technologies Inc., Digital Realty Trust Inc., Equinix Inc., Global Switch, Telehouse, and others.
“According to the latest research study, the demand for global Data Center Colocation Market size & share was valued at approximately USD 50.4 Billion in 2021 and is expected to reach USD 57.2 billion in 2022 and is expected to reach a value of around USD 131.8 Billion by 2030, at a compound annual growth rate (CAGR) of about 14.2% during the forecast period 2022 to 2030.”
Data center colocation market offers a comprehensive and deep evaluation of the market stature. Also, the market report estimates the market size, revenue, price, market share, market forecast, growth rate, and competitive analysis.
Data center colocation is when a service provider rents out vast amounts of floor space, internet bandwidth, and network from an existing data center to establish its own data center, store massive amounts of data, and oversee the server operations of big businesses. It enables data center colocation by sharing the existing infrastructure of data center resources.
As a result of the Covid-19 outbreak, colocation is becoming an essential component of staying connected, collaborating, and moving forward cost-effectively and safely. Healthcare organizations analyze patient outcomes using data and anticipate the spread of diseases using artificial intelligence. Robust network connectivity at Telehouse colocation centers in New York enables them to provide a range of commercial solutions.
Over the projected period, it is predicted that the fast expansion of structured and unstructured data and the rising demand for cloud computing will drive the growth of the global data center colocation market. Another factor anticipated to accelerate the development of colocation data centers is the rising capital expense associated with owning and maintaining sizable computing facilities.
A trend that is anticipated to continue during the projected period is that predictable prices, high dependability, simple scalability, and overall reduced costs are some of the primary reasons impacting colocation demand. High-capacity networks are becoming increasingly crucial as edge computing applications take off. Multi-locational hybrid data architectures have developed due to network latency challenges and the need for instantaneous real-time insights.
Data transmission between data centers or private exchange points has therefore become crucial. Additionally, as more companies move their operations to the cloud, more bandwidth is needed to support quicker data processing and smoother data transfer. The growth of immersive technologies like augmented reality, virtual reality, and artificial intelligence (AI), as well as 5G technology, has further contributed to the requirement for providing larger bandwidths for data transfer across organizations.
The continuous use of several disruptive technologies, including cloud computing, IoT, autonomous cars, and sophisticated robotics, is another factor driving the growing demand for colocation in data centers. In addition, lower latency has become increasingly in the market due to the ongoing development of these technologies and the ensuing adoption of intelligent devices. As a result, colocation gives cloud service providers a chance to relocate their data center facilities close to the consumers, resulting in high bandwidth and low latency in data transfer.
Key questions answered in this report:
- What is the size of the Data Center Colocation market and what is its expected growth rate?
- What are the primary driving factors that push the Data Center Colocation market forward?
- What are the Data Center Colocation Industry’s top companies?
- What are the different categories that the Data Center Colocation Market caters to?
- What will be the fastest-growing segment or region?
- In the value chain, what role do essential players play?
- What is the procedure for getting a free copy of the Data Center Colocation market sample report and company profiles?
Click Here to Access a Free Sample Report of the Global Data Center Colocation Market @ https://www.custommarketinsights.com/report/data-center-colocation-market/

Segmental Overview
The data center colocation market is segmented into type, enterprise size, and end-use insights. According to the class, the retail colocation category is expected to increase quickly. Numerous advantages this kind offers, including managed service, which results in cheaper costs for data center maintenance, high data security, and others, are credited with the segment’s rise.
The global market is divided into small and minimum-scale enterprises and large enterprises, depending on the enterprise size. However, large-scale organizations had the majority of the market share for data center colocation and are anticipated to keep expanding over the projected period. Heavy investment by big-size organizations in data centers is credited with this increase. Additionally, the worldwide market for data center colocation is being driven by significant enterprises’ increasing need for substantial data storage.
The market is divided into IT & Telecom, BFSI, Healthcare, and others. The IT and telecom industries had the most significant proportion in 2021, followed by the banking, financial, and insurance sectors. In the projection term, the CAGR for the IT & Telecom category is expected to be high. In addition, due to ongoing patient data monitoring and storage, which have greatly expanded since the COVID-19 pandemic in 2021, the healthcare subsegment also offers significant development potential throughout the projection period.
North America held the most significant market share in the data center colocation market. This is because several necessary cloud service providers are well-represented in the area, and SMEs also set up colocation data centers there. Additionally, rising e-commerce sales in the United States foster regional market expansion. To determine client buying habits and product requests based on several categories, such as area, gender, and age group, retailers are investing extensively in their IT infrastructure to keep customer data.
……………………………………………………………………………………………………………………………………………………..
Another forecast is even more bullish, predicting a Global Data Center Colocation market size of $202.71 Billion by 2030 as per this chart:
References:
https://www.yahoo.com/now/latest-global-data-center-colocation-023000887.html
Canalysis & Counterpoint: Global Smartphone shipments plunge 9% YoY in 3Q-2022
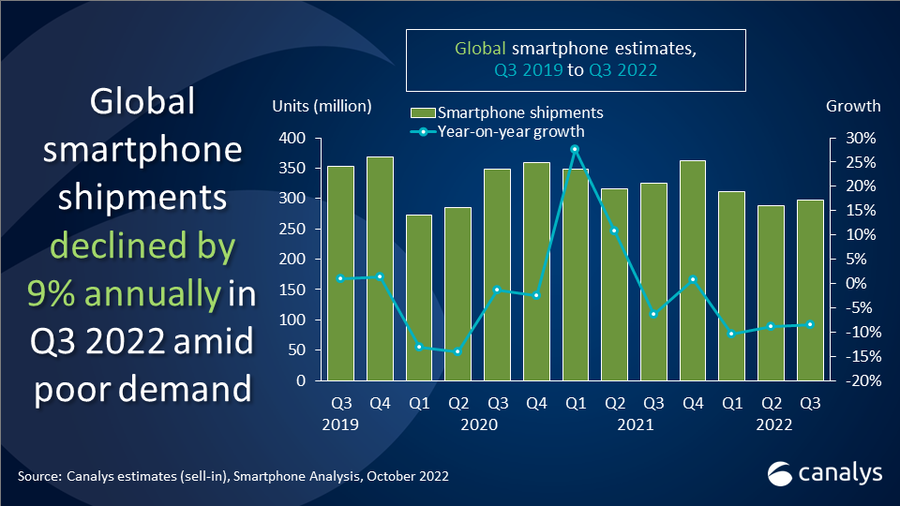
Canalys smartphone analysis indicates weak demand in 3Q-2022 caused worldwide smartphone shipments to decline by 9% year-on-year to 297.8 million units. Samsung defended its first place in the market despite an 8% decline, shipping 64.1 million units. Apple, the only leading vendor to increase year-on-year driven by robust demand, grew 8% and shipped 53.0 million units. Following two quarters of double-digit declines, Xiaomi leveraged its global scale to find opportunities helping it strengthen its position to only decline 8%, shipping 40.5 million units. OPPO and Vivo took fourth and fifth place despite having over 20% declines, shipping 28.5 million and 27.4 million units respectively in Q3 2022.
“Performance of the high-end segment was the only highlight this quarter,” said Canalys Research Analyst Runar Bjørhovde. “Apple reached its highest Q3 market share yet, driven by both the iPhone 13 and newly launched iPhone 14 series. The popularity of the iPhone 14 Pro and Pro Max, in particular, will contribute to a higher ASP and stable revenue for Apple. On the Android side, Samsung refreshed its foldable portfolio and increased its marketing initiatives significantly to generate interest and demand for its new flagships. Mid-to-low-end demand has been hit making it challenging for vendors to navigate in a competitive segment. Xiaomi managed to leverage its global scale with a refreshed product line to offset declines in its home market. OPPO and vivo are still significantly impacted by the drop in the China market but have both shown small signs of recovery.”
“Europe and Asia Pacific outperformed the rest of the world in Q3,” said Canalys Analyst Sanyam Chaurasia. “Europe avoided a significant drop helped by a spike in shipments to Russia. Here, Chinese vendors leveraged short-term opportunities to stock up the channel in a market that has been undersupplied during previous quarters. APAC had a huge variation between different markets, but sequentially improving demand in India, Indonesia and the Philippines helped the region stabilize its performance. Carrier dominated markets such as North America and Latin America presented increasingly cautious sentiments on managing inventory before heading into big holiday seasons, contrasting a much more optimistic view in Q3 last year.”
“Moving into Q4, ongoing global disruptions are hampering the performance of entire ecosystem portfolios for vendors,” said Canalys Analyst Toby Zhu. “The upstream supply chain is entering a long winter sooner than expected where OEMs’ order targets are slashed heavily. Also, slow inventory turnover and poor economic figures have affected the channel’s confidence, falling back to major brands with iconic devices to generate traffic for the most important revenue quarter. Vendors are entering Q4 with cautious strategies to handle the persisting difficulties. Managing the gloomiest Q4 outlook in over a decade will show which vendors are well-positioned for the long-term.”
|
Worldwide smartphone shipments and annual growth Canalys Smartphone Market Pulse: Q3 2022 |
|||||||
|
Vendor |
Q3 2022 shipments (million) |
Q3 2022 |
Q3 2021 |
Q3 2021 |
Annual |
||
|
Samsung |
64.1 |
22% |
69.4 |
22% |
-8% |
||
|
Apple |
53.0 |
18% |
49.2 |
16% |
8% |
||
|
Xiaomi |
40.5 |
14% |
44.0 |
14% |
-8% |
||
|
OPPO |
28.5 |
10% |
36.7 |
12% |
-22% |
||
|
Vivo |
27.4 |
9% |
34.2 |
11% |
-20% |
||
|
Others |
84.3 |
27% |
92.1 |
25% |
-6% |
||
|
Total |
297.8 |
100% |
325.6 |
100% |
-9% |
||
|
Note: percentages may not add up to 100% due to rounding |
|||||||
Source: Canalys
…………………………………………………………………………………………………………………………………
Counterpoint: Global Smartphone Market at Lowest Q3 Level Since 2014
- The global smartphone market declined by 12% YoY even as it grew by 2% QoQ to reach 301 million units in Q3 2022.
- While quarterly growth in Apple and Samsung pushed the global smartphone market above 300 million units, a level it failed to reach last quarter, political and economic instability drove negative consumer sentiment.
- Apple was the only top-five smartphone brand to grow YoY, with shipments increasing 2% YoY, growing market share by two percentage points to 16%.
- Samsung’s shipments declined by 8% YoY but grew 5% QoQ to 64 million.
- Xiaomi, OPPO* and vivo, recovered slightly after receiving heavy beatings due to lockdowns in China in Q2, and as they captured more of the market ceded by Apple and Samsung’s exit from Russia.
Senior Analyst Harmeet Singh Walia said, “Most major vendors continued experiencing annual shipment declines in the third quarter of 2022. Russia’s escalating war in Ukraine, ongoing China-US political distrust and tensions, growing inflationary pressures across regions, a growing fear of recession, and weakening national currencies all caused a further dent in consumer sentiment, hitting already weakened demand. This is also adding to a slow but sustained lengthening of smartphone replacement cycles with smartphones becoming more durable and as technology advancement slows. This is accompanying, and to a smaller degree advancing, a fall in the shipments of mid- and lower-end smartphones, even as the premium segment weathers the economic storm better. Consequently, and thanks to an earlier launch of the latest iPhone series this year, Apple emerged as the only top-five smartphone vendor to manage annual shipment growth in the quarter.”
While Samsung grew QoQ in Q3 2022 thanks to record presales of its premium fold and flip smartphones, compared with the same quarter last year, however, its shipments fell by 8% YoY. This is primarily down to dampening consumer sentiment in several of its key markets. This also affected top Chinese brands, whose shipments remained low compared with last year as they were getting rid of excess inventory and at the same time managing a slowdown in the home market, China. However, they were able to capitalise on Apple and Samsung’s exit from the Russian market, in which their share increased substantially.
Associate Director Jan Stryjak noted, “With the full force of the latest iPhone launch being felt in Q4, we expect further quarterly improvement in the coming quarter, although central banks’ attempts to control inflation will further reduce consumer demand. The channel inventory is still higher, and the OEMs will focus on getting rid of excess inventory in Q4 as well. Hence, shipments are unlikely to reach last year’s levels, let alone pre-pandemic Q4 levels of over 400 million units. Looking further ahead into 2023, we expect sluggish demand with lengthening replacement rates, especially in the first half of the year.”
*OPPO includes OnePlus from Q3 2021
References:
Clearwave Fiber Expands Fiber Buildout in Savannah, Hinesville and Richmond Hill, GA
Clearwave Fiber [1.] continues its construction of a state-of-the art, all-Fiber Internet network in the “Coastal Empire.” This latest expansion for the Savannah-based operation marks a continuation of almost 6,000 route miles of Fiber in the Southeast and Midwest. The company’s goal is to bring the most advanced and fastest Internet available to more than 500,000 homes and businesses across the United States by the end of 2026.
Note 1. Clearwave Fiber was formed in January of 2022 as a rebranding of Hargray Fiber, which has been serving the Southeast for 70+ years. Senior leadership and operations management have a long history with Hargray and now lead Clearwave Fiber during this rapid expansion.

………………………………………………………………………………………………………………………………………………………..
“Clearwave Fiber is excited to contribute to the continual growth in Southeast Georgia and provide such a crucial resource to residents and commercial operations,” said Clearwave Fiber General Manager John Robertson. “We’re committed to providing communities with the high-speed connectivity that is essential for families, businesses and local economies.”
“We’re ingrained in the fabric of Savannah and its surrounding communities,” said Clearwave Fiber Chief Operating Officer Gwynne Lastinger. “Our sales and technical support staff live and work in the Coastal Empire and we continue to add to our team of more than 500 throughout the Southeast and Midwest.”
With gigabit download and upload speeds, Clearwave Fiber will bring 10 times more speed to consumer doorsteps at a time when fast, reliable Internet is becoming increasingly critical to modern households and businesses. Remote work, streaming, gaming, smart home technology and multiple device connectivity all require robust, reliable connections. Clearwave Fiber is committed to providing hassle-free, high-quality Fiber data connection to every location of its growing footprint.
“We’re seeing an increase in households where multiple online activities are occurring at the same time. Many Internet connections aren’t up to the task of keeping it all running at top speeds,” said Robertson. “Clearwave Fiber solves the problem of the bandwidth issues that happen when everyone in the house is connected. We also have solutions for businesses that keep them operating on a fast, reliable network.”
For many consumers, Internet touches every facet of daily life. Remote work, telehealth, and virtual learning all require robust, reliable connections. A 2022 study by Deloitte indicated that 45 percent of surveyed households include one or more remote workers, and 23 percent include at least one or more household member attending school from home. Additionally, 49 percent of U.S. adults had virtual medical appointments in the past year.
In addition, the Deloitte report noted that the average U.S. household now utilizes a total of 22 connected devices, including laptops, tablets, smartphones, smart TVs, game consoles, home concierge systems like Amazon Echo and Google Nest, fitness trackers, camera and security systems, and smart home devices such as connected exercise machines and thermostats.
Supporting this burgeoning ecosystem of household devices can challenge companies serving customers over DSL or cable systems. “Older copper wire and coaxial networks worked just fine for the technologies they were built for. Copper lines are great for telephone calls and coax worked well for cable TV, but those networks struggle to deliver the kind of bandwidth possible with fiber,” noted Lastinger. “Fiber optic technology is the future. Fiber networks are more durable, more consistent, and they move data at the speed of light. Best of all, our network easily keeps pace with technology innovations, exponentially increasing demands for bandwidth, and evolving customer needs. The options are almost limitless.”
Fiber networks are currently being installed on Wilmington and Whitemarsh Islands, Windsor Forest, Hinesville, Rincon, Pooler and Richmond Hill. Clearwave Fiber is scheduled to complete these projects by the end of November and will continue working in other areas in the region into 2023 and beyond.
For more information, visit ClearwaveFiber.com
References:


