

Cloud Infrastructure Spending
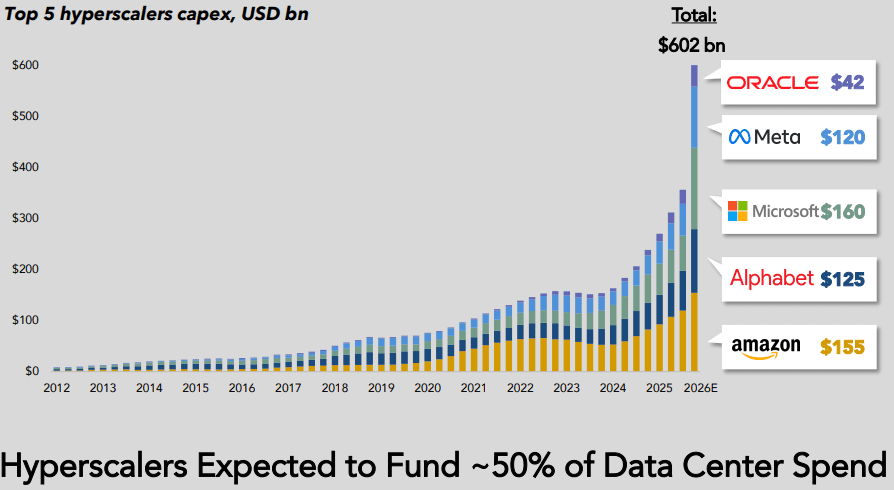
Hyperscaler capex > $600 bn in 2026 a 36% increase over 2025 while global spending on cloud infrastructure services skyrockets
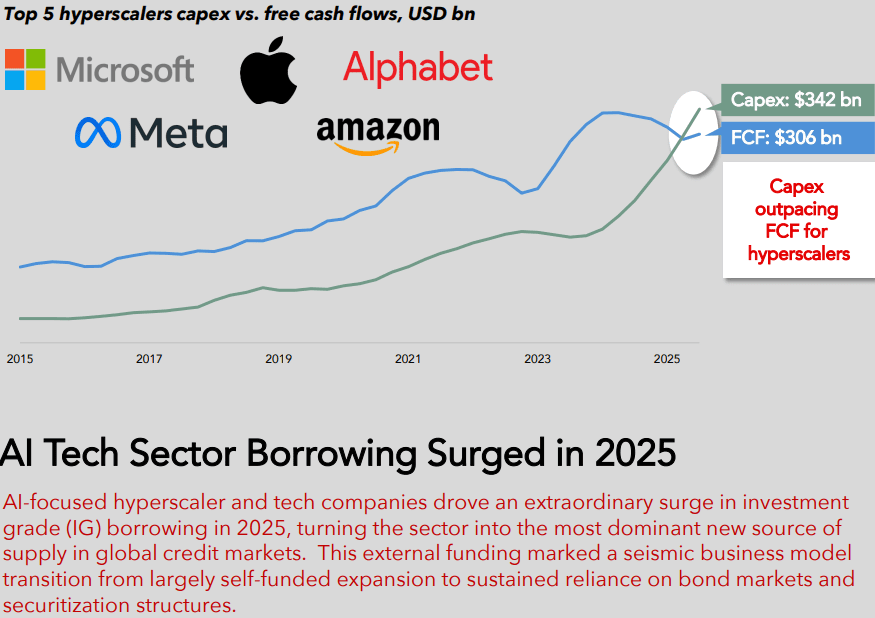
Hyperscaler capex for the “big five” (Amazon, Alphabet/Google, Microsoft, Meta/Facebook, Oracle) is now widely forecast to exceed $600 bn in 2026, a 36% increase over 2025. Roughly 75%, or $450 bn, of that spend is directly tied to AI infrastructure (i.e., servers, GPUs, datacenters, equipment), rather than traditional cloud. Hyperscalers are increasingly leaning on debt markets to bridge the gap between rapidly rising AI capex budgets and internal free cash flow, transforming historically cash-funded business models into ones utilizing leverage, albeit with still very strong balance sheets. Aggregate capex for “the big five”, after buybacks and dividends are included, are now above projected cash flows, thereby necessitating external funding needs.
……………………………………………………………………………………………………………………………………………………………………………………………………………………..
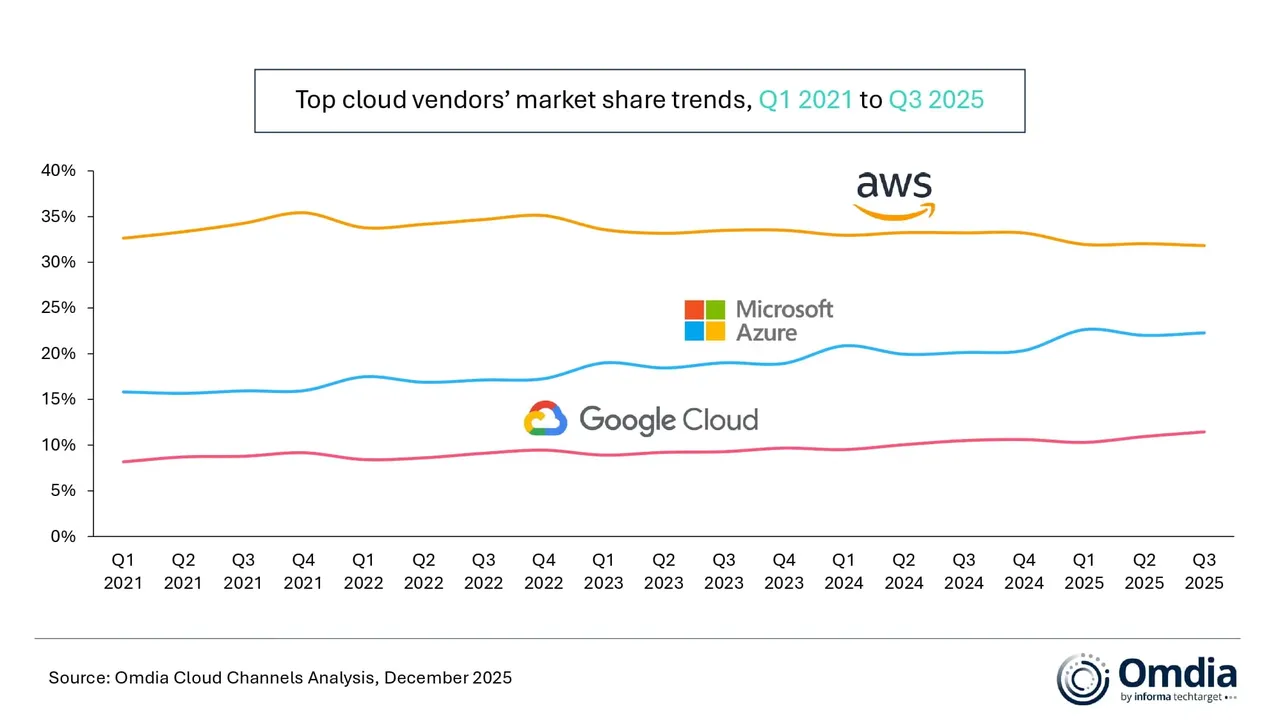
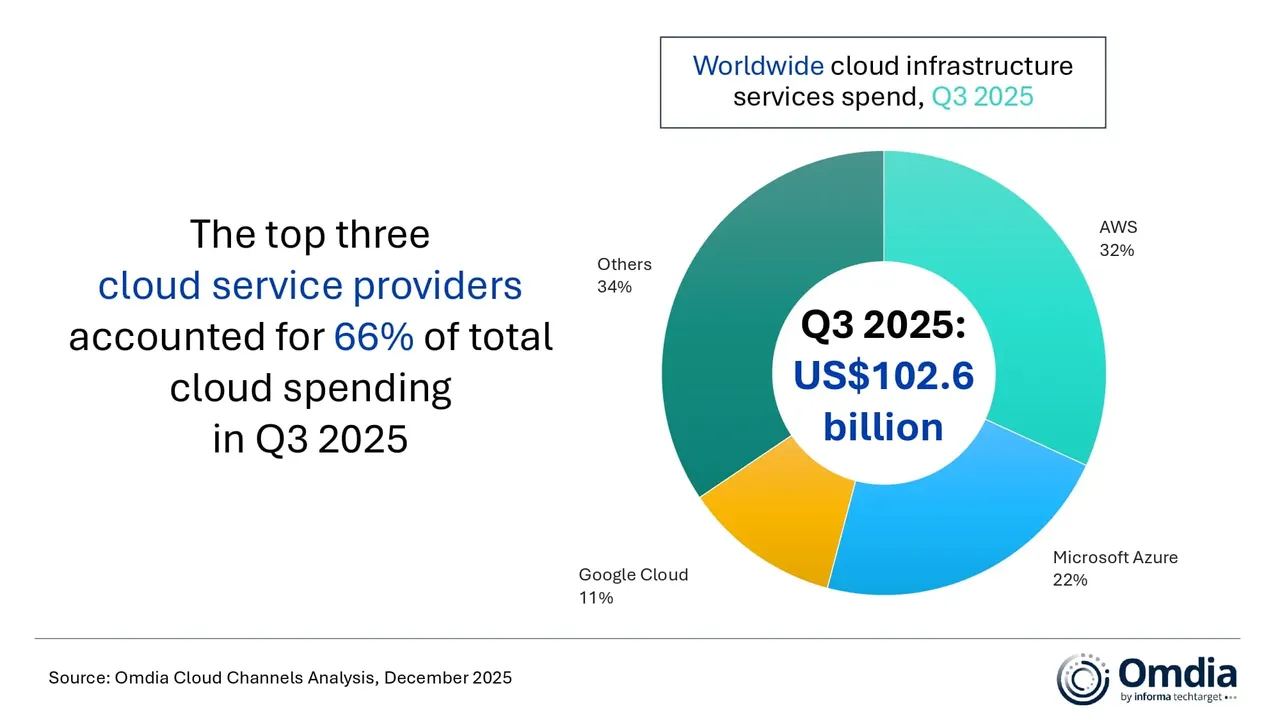
According to market research from Omdia (owned by Informa) global spending on cloud infrastructure services reached $102.6 billion in Q3 2025 — a 25% year-on-year increase. It was the fifth consecutive quarter in which cloud spending growth remained above 20%. Omdia says it “reflects a significant shift in the technology landscape as enterprise demand for AI moves beyond early experimentation toward scaled production deployment.” AWS, Microsoft Azure, and Google Cloud – maintained their market rankings from the previous quarter, and collectively accounted for 66% of global cloud infrastructure spending. Together, the three firms had 29% year-on-year growth in their cloud spending.
Hyperscaler AI strategies are shifting from a focus on incremental model performance to platform-driven, production-ready approaches. Enterprises are now evaluating AI platforms based not solely on model capabilities, but also on their support for multi-model strategies and agent-based applications. This evolution is accelerating hyperscalers’ move toward platform-level AI capabilities. According to the report, Amazon Web Services (AWS), Microsoft Azure, and Google Cloud are integrating proprietary foundation models with a growing range of third-party and open-weight models to meet these new demands.
“Collaboration across the ecosystem remains critical,” said Rachel Brindley, Senior Director at Omdia. “Multi-model support is increasingly viewed as a production requirement rather than a feature, as enterprises seek resilience, cost control, and deployment flexibility across generative AI workloads.”
Facing challenges with practical application, major cloud providers are boosting resources for AI agent lifecycle management, including creation and operationalization, as enterprise-level deployment proves more intricate than anticipated.
Yi Zhang, Senior Analyst at Omdia, said, “Many enterprises still lack standardized building blocks that can support business continuity, customer experience, and compliance at the same time, which is slowing the real-world deployment of AI agents. This is where hyperscalers are increasingly stepping in, using platform-led approaches to make it easier for enterprises to build and run agents in production environments.”
This past October, Omdia released a report forecasting that growth of cloud adoption among communications service providers (CSPs) will double this year. It also forecasted a compound annual growth rate (CAGR) of 7.3% to 2030, resulting in the telco cloud market being worth $24.8 billion.
………………………………………………………………………………………………………………………………………………………………………………………………………………………..
Editor’s Note: Does anyone remember the stupendous increase in fiber optic spending from 1998-2001 till that bubble burst? Caveat Emptor!
………………………………………………………………………………………………………………………………………………………………………………………………………………………..
References:
https://www.telecoms.com/public-cloud/global-cloud-infrastructure-spend-up-25-in-q3
https://www.telecoms.com/public-cloud/telco-investment-in-cloud-infrastructure-is-accelerating-omdia
AI infrastructure spending boom: a path towards AGI or speculative bubble?
Expose: AI is more than a bubble; it’s a data center debt bomb
Can the debt fueling the new wave of AI infrastructure buildouts ever be repaid?
AI spending boom accelerates: Big tech to invest an aggregate of $400 billion in 2025; much more in 2026!
Gartner: AI spending >$2 trillion in 2026 driven by hyperscalers data center investments
AI spending is surging; companies accelerate AI adoption, but job cuts loom large
Will billions of dollars big tech is spending on Gen AI data centers produce a decent ROI?
Big tech spending on AI data centers and infrastructure vs the fiber optic buildout during the dot-com boom (& bust)
Canalys & Gartner: AI investments drive growth in cloud infrastructure spending
Sovereign AI infrastructure for telecom companies: implementation and challenges
AI Echo Chamber: “Upstream AI” companies huge spending fuels profit growth for “Downstream AI” firms
Custom AI Chips: Powering the next wave of Intelligent Computing
Canalys & Gartner: AI investments drive growth in cloud infrastructure spending
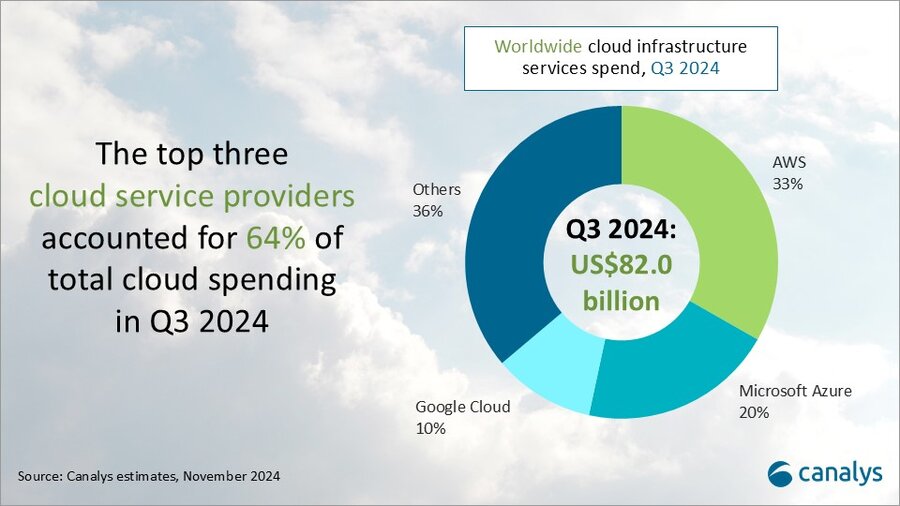
According to market research firm Canalys, global spending on cloud infrastructure services [1.] increased by 21% year on year, reaching US$82.0 billion in the 3rd quarter of 2024. Customer investment in the hyperscalers’ AI offerings fueled growth, prompting leading cloud vendors to escalate their investments in AI.
Note 1. Canalys defines cloud infrastructure services as services providing infrastructure (IaaS and bare metal) and platforms that are hosted by third-party providers and made available to users via the Internet.
The rankings of the top three cloud service providers – Amazon AWS, Microsoft Azure and Google Cloud – remained stable from the previous quarter, with these providers together accounting for 64% of total expenditure. Total combined spending with these three providers grew by 26% year on year, and all three reported sequential growth. Market leader AWS maintained a year-on-year growth rate of 19%, consistent with the previous quarter. That was outpaced by both Microsoft, with 33% growth, and Google Cloud, with 36% growth. In actual dollar terms, however, AWS outgrew both Microsoft and Google Cloud, increasing sales by almost US$4.4 billion on the previous year.
In Q3 2024, the cloud services market saw strong, steady growth. All three cloud hyperscalers reported positive returns on their AI investments, which have begun to contribute to their overall cloud business performance. These returns reflect a growing reliance on AI as a key driver for innovation and competitive advantage in the cloud.
With the increasing adoption of AI technologies, demand for high-performance computing and storage continues to rise, putting pressure on cloud providers to expand their infrastructure. In response, leading cloud providers are prioritizing large-scale investments in next-generation AI infrastructure. To mitigate the risks associated with under-investment – such as being unprepared for future demand or missing key opportunities – they have adopted over-investment strategies, ensuring their ability to scale offerings in line with the growing needs of their AI customers. Enterprises are convinced that AI will deliver an unprecedented boost in efficiency and productivity, so they are pouring money into hyperscalers’ AI solutions. Accordingly, cloud service provider capital spending (CAPEX) will sustain their rapid growth trajectories and are expected to continue on this path into 2025.
“Continued substantial expenditure will present new challenges, requiring cloud vendors to carefully balance their investments in AI with the cost discipline needed to fund these initiatives,” said Rachel Brindley, Senior Director at Canalys. “While companies should invest sufficiently in AI to capitalize on technological growth, they must also exercise caution to avoid overspending or inefficient resource allocation. Ensuring the sustainability of these investments over time will be vital to maintaining long-term financial health and competitive advantage.”
“On the other hand, the three leading cloud providers are also expediting the update and iteration of their AI foundational models, continuously expanding their associated product portfolios,” said Yi Zhang, Analyst at Canalys. “As these AI foundational models mature, cloud providers are focused on leveraging their enhanced capabilities to empower a broader range of core products and services. By integrating these advanced models into their existing offerings, they aim to enhance functionality, improve performance and increase user engagement across their platforms, thereby unlocking new revenue streams.”
Amazon Web Services (AWS) maintained its lead in the global cloud market in Q3 2024, capturing a 33% market share and achieving 19% year-on-year revenue growth. It continued to enhance and broaden its AI offerings by launching new models through Amazon Bedrock and SageMaker, including Anthropic’s upgraded Claude 3.5 Sonnet and Meta’s Llama 3.2. It reported a triple-digit year-on-year increase in AI-related revenue, outpacing its overall growth by more than three times. Over the past 18 months, AWS has introduced nearly twice as many machine learning and generative AI features as the combined offerings of the other leading cloud providers. In terms of capital expenditure, AWS announced plans to further increase investment, with projected spending of approximately US$75 billion in 2024. This investment will primarily be allocated to expanding technology infrastructure to meet the rising demand for AI services, underscoring AWS’ commitment to staying at the forefront of technological innovation and service capability.
Microsoft Azure remains the second-largest cloud provider, with a 20% market share and impressive annual growth of 33%. This growth was partly driven by AI services, which contributed approximately 12% to the overall increase. Over the past six months, use of Azure OpenAI has more than doubled, driven by increased adoption by both digital-native companies and established enterprises transitioning their applications from testing phases to full-scale production environments. To further enhance its offerings, Microsoft is expanding Azure AI by introducing industry-specific models, including advanced multimodal medical imaging models, aimed at providing tailored solutions for a broader customer base. Additionally, the company announced new cloud and AI infrastructure investments in Brazil, Italy, Mexico and Sweden to expand capacity in alignment with long-term demand forecasts.
Google Cloud, the third-largest provider, maintained a 10% market share, achieving robust year-on-year growth of 36%. It showed the strongest AI-driven revenue growth among the leading providers, with a clear acceleration compared with the previous quarter. As of September 2024, its revenue backlog increased to US$86.8 billion, up from US$78.8 billion in Q2, signaling continued momentum in the near term. Its enterprise AI platform, Vertex, has garnered substantial user adoption, with Gemini API calls increasing nearly 14-fold over the past six months. Google Cloud is actively seeking and developing new ways to apply AI tools across different scenarios and use cases. It introduced the GenAI Partner Companion, an AI-driven advisory tool designed to offer service partners personalized access to training resources, enhancing learning and supporting successful project execution. In Q3 2024, Google announced over US$7 billion in planned data center investments, with nearly US$6 billion allocated to projects within the United States.
Separate statistics from Gartner corroborate hyperscale CAPEX optimism. Gartner predicts that worldwide end-user spending on public cloud services is on course to reach $723.4 billion next year, up from a projected $595.7 billion in 2024. All segments of the cloud market – platform-as-a-service (PaaS), software-as-a-service (SaaS), desktop-as-a-service (DaaS), and infrastructure-as-a-service (IaaS) – are expected to achieve double-digit growth.
While SaaS will be the biggest single segment, accounting for $299.1 billion, IaaS will grow the fastest, jumping 24.8 percent to $211.9 million.

Like Canalys, Gartner also singles out AI for special attention. “The use of AI technologies in IT and business operations is unabatedly accelerating the role of cloud computing in supporting business operations and outcomes,” said Sid Nag, vice president analyst at Gartner. “Cloud use cases continue to expand with increasing focus on distributed, hybrid, cloud-native, and multicloud environments supported by a cross-cloud framework, making the public cloud services market achieve a 21.5 percent growth in 2025.”
……………………………………………………………………………………………………………………………………………………………………………………………………..
References:
https://canalys.com/newsroom/global-cloud-services-q3-2024
https://www.telecoms.com/public-cloud/ai-hype-fuels-21-percent-jump-in-q3-cloud-spending
Cloud Service Providers struggle with Generative AI; Users face vendor lock-in; “The hype is here, the revenue is not”
MTN Consulting: Top Telco Network Infrastructure (equipment) vendors + revenue growth changes favor cloud service providers
IDC: Public Cloud software at 2/3 of all enterprise applications revenue in 2026; SaaS is essential!
IDC: Cloud Infrastructure Spending +13.5% YoY in 4Q-2021 to $21.1 billion; Forecast CAGR of 12.6% from 2021-2026
IDC: Worldwide Public Cloud Services Revenues Grew 29% to $408.6 Billion in 2021 with Microsoft #1?
Synergy Research: Microsoft and Amazon (AWS) Dominate IT Vendor Revenue & Growth; Popularity of Multi-cloud in 2021
Google Cloud revenues up 54% YoY; Cloud native security is a top priority
Canalys: Global cloud infrastructure services spending up 16% in Q3-2023
Global spending on cloud infrastructure services reached US$73.5 billion in Q3 2023, a 16% year-on-year increase. Q3 growth remained consistent with the previous quarter, showing we are entering a stable phase. The impact of enterprise IT spending cuts on the cloud services market is slowly easing. In Q3 2023, the top three cloud providers – AWS, Microsoft Azure and Google Cloud – jointly grew by 20%, slightly outpacing the overall market and accounting for 65% of total spending. AWS mirrored its performance in the previous quarter, while Microsoft saw an uptick in its growth rate. Google Cloud, however, saw a drop in its rate in Q3 2023.
In August, Canalys said that AI would be a major driver of cloud service provider investments.
Cloud market showing signs of resilience – helped by growing interest in AI
Despite enterprises continuing to optimize overall IT spending, the cloud market is beginning to show signs of resilience, helped in part by a growing interest in AI. While the broader market continues to grapple with the repercussions of cost-cutting behavior, the performance of the leading cloud vendors hints at a shift in the market dynamic. Growing demand for AI solutions is gradually offsetting the impact of reduced IT spending as enterprises begin to invest in cloud computing to support AI strategies.
Top three vendors launch AI-focused partner programs
Microsoft’s efforts to commercialize its AI products are gaining momentum, with the recent introduction of Copilot driving significant customer and partner interest. Looking ahead to next year and beyond, discussions around GenAI will take center stage, and it will become a key growth driver for the channel. Following AWS’ and Microsoft’s recent AI-focused partner program launches, Google Cloud introduced the Generative AI Partner Initiative in Q3, as it seeks to work with partners to drive enterprise adoption of its AI solutions, including Duet AI.
“Generative AI unlocks a wealth of opportunities for channel partners to venture into new areas of business growth,” said Alex Smith, VP at Canalys. “The big cloud players and their partners can seize this exponential growth opportunity by identifying customers with an appetite for AI solutions, while simultaneously strengthening their AI capabilities and offering comprehensive portfolios of AI-related products and services to address these evolving needs.”
“Apart from capitalizing on new business opportunities arising from GenAI, channel partners can incorporate GenAI internally to boost productivity,” said Yi Zhang, Analyst at Canalys. “To succeed in this rapidly evolving landscape, channel partners must stay ahead of the game by establishing robust AI strategies and investing in strategic AI partnerships.”
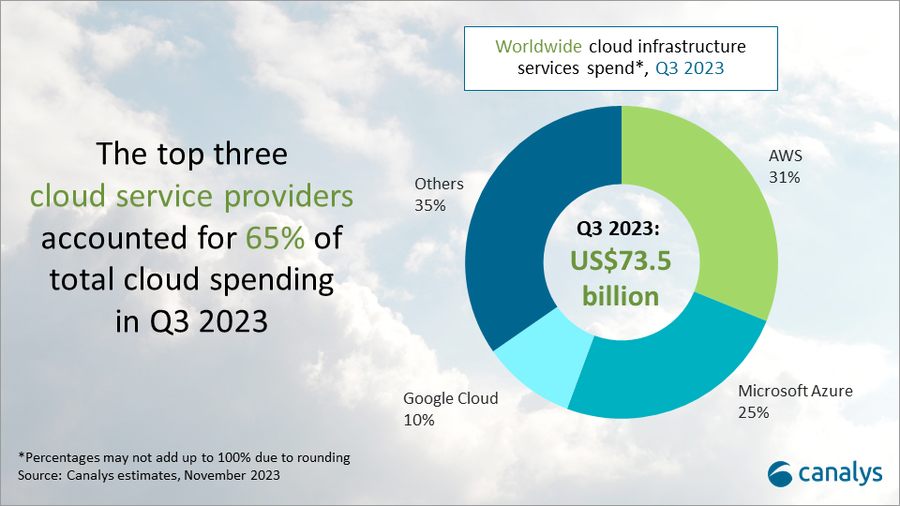
AWS continues to reign supreme with 31% market share
Amazon Web Services (AWS) continued to dominate the cloud infrastructure services market in Q3 2023, with a stable market share of 31%. Year-on-year growth of 12% was in line with the previous quarter but still below the overall market’s growth rate. The company’s efforts to cut costs and enhance efficiency resulted in substantial profit improvements in Q3 2023. AWS unveiled plans to open new data centers in South Korea and Malaysia, responding to the increasing demand for cloud computing in these regions. It also enhanced its cloud marketplace, as growing numbers of ISVs are seeing transactions accelerate via AWS Marketplace. AWS has committed to improving the AWS Marketplace and Partner Central in the coming months, aiming to empower partners to use AWS Marketplace to accelerate sales.
Microsoft Azure bounces back with 25% market share and rising growth rate
Microsoft Azure held second place in the cloud infrastructure services market in Q3 with a 25% market share. Following seven consecutive quarters of slowing year-on-year growth, it saw an uptick in its growth rate, which was up 29% compared with Q3 last year. The impact of the AI surge is palpable – marked by increased demand for cloud following the launch of Microsoft Copilot for Windows in September. Business performance is expected to remain steady, given the 18% increase in its cloud order backlog, which reached US$212 billion in Q3 2023. Since August, partners have had access to the new Microsoft AI Cloud Partner Program, designed to support partners in harnessing the advantages of incorporating AI capabilities into their organizations and capitalizing on the business opportunities presented by Microsoft AI-related products and Microsoft Azure.
Google Cloud takes 10% market share with growth below expectations
Google Cloud reached a market share of 10% in Q3 2023 after growing 24% year on year, securing third place in the cloud infrastructure services market. Growth was below expectations, and this was the first time that Google Cloud’s growth rate dipped below that of Microsoft Azure’s in the last three years. The dip was primarily due to the delayed impact of enterprises’ IT cost-cutting measures. Emphasizing its partner-first vision, Google Cloud is highlighting the Google Cloud partner ecosystem, particularly in the context of AI. It also committed to an open approach to GenAI development, facilitating the integration of partner-developed AI models into the Google Cloud Platform.
Canalys defines cloud infrastructure services as those services that provide infrastructure-as-a-service and platform-as-a-service, either on dedicated hosted private infrastructure or shared public infrastructure. This excludes software-as-a-service expenditure directly but includes revenue generated from the infrastructure services being consumed to host and operate them.
…………………………………………………………………………………………………………………………………..
According to Nick Wood at telecoms.com, the overall cloud infrastructure services market – which for Canalys encompasses infrastructure-as-a-service (IaaS) and platform-as-a-service (IaaS) – is on course to fall short of Canalys’ full-year expectations. In February, Canalys predicted that cloud spending in 2023 would grow 23% on last year, when it reached $247.1 billion. That makes for a projected total of around $304 billion.
However, since then, macroeconomic conditions have taken their toll on spending, tempering expectations for this year. The year to date total for 2023 is $212.3 billion, which means there is $91.7 billion worth of ground to make up in Q4 if spending is going to meet that target.
Achieving this looks like a tall order, because it would mean the year-on-year growth rate in Q4 would need to be 39.7%. Given the market grew by 19% in Q1, and 16% in both Q2 and Q3, a sudden surge in spending is unlikely.
References:
https://canalys.com/newsroom/global-cloud-services-q3-2023
https://telecoms.com/524974/cloud-spending-set-to-miss-full-year-forecast-despite-solid-q3-growth/
Cloud infrastructure services market grows; AI will be a major driver of future cloud service provider investments
Canalys: Cloud marketplace sales to be > $45 billion by 2025
Canalys: Global cloud services spending +33% in Q2 2022 to $62.3B
Gartner Forecast: Worldwide Public Cloud End-User Spending ~$679 Billion in 2024; GenAI to Support Industry Cloud Platforms
IDC: Public Cloud services spending to hit $1.35 trillion in 2027
Canalys: Global cloud services spending +33% in Q2 2022 to $62.3B
Synergy: Q3 Cloud Spending Up Over $11 Billion YoY; Google Cloud gained market share in 3Q-2022
AWS, Microsoft Azure, Google Cloud account for 62% – 66% of cloud spending in 1Q-2022
IDC: Public Cloud services spending to hit $1.35 trillion in 2027
Global spending on public cloud services is projected to reach $1.35 trillion in 2027, according to IT market research firm IDC. Although annual cloud spending growth is expected to slow slightly over the 2023-2027 forecast period, the market is forecast to achieve a five-year compound annual growth rate (CAGR) of 19.9%.
IDC forecasts that the U.S. will be the largest geographic public cloud market and will reach $697 billion in 2027. Western Europe is predicted to be in second place with $273 billion, followed by China at $117 billion in 2027.
Eileen Smith, program VP for data & analytics at IDC, said cloud is dominating spending in the tech sector across infrastructure, platforms and applications. She wrote:
“Cloud now dominates tech spending across infrastructure, platforms, and applications. Most organizations have adopted the public cloud as a cost-effective platform for hosting enterprise applications and for developing and deploying customer-facing solutions. Looking forward, the cloud model remains incredibly well positioned to serve customer needs for innovation in application development and deployment, including as data, artificial intelligence/machine learning (AI/ML), and edge needs continue to define the forefront of innovation.”
Of the 28 industries* covered in the IDC Spending Guide, the three largest in 2027 – Banking, Software and Information Services, and Telecommunications – will together represent $326 billion in public cloud services spending.
IDC forecasts that software-as-a-service (SaaS) applications to be the largest cloud computing category, garnering about 40% of all public cloud spending. Next largest is infrastructure as a service (IaaS) with a CAGR of 23.5%, followed by platform as a service (PaaS) with a five-year CAGR of 27.2%. SaaS – system infrastructure software (SIS) is forecast to be the smallest category of cloud spending, cornering about 15% of the market.
…………………………………………………………………………………………………………………….
References:
https://www.idc.com/getdoc.jsp?containerId=prUS51179523
https://www.idc.com/getdoc.jsp?containerId=IDC_P33214
IDC: Public Cloud software at 2/3 of all enterprise applications revenue in 2026; SaaS is essential!
https://techblog.comsoc.org/2022/02/09/gartner-accelerated-move-to-public-cloud-to-overtake-traditional-it-spending-in-2025/
IDC: Worldwide Public Cloud Services Revenues Grew 29% to $408.6 Billion in 2021 with Microsoft #1?
Cloud infrastructure services market grows; AI will be a major driver of future cloud service provider investments
According to Canalys, worldwide cloud infrastructure services spending increased 16% to $72.4 billion in Q2 2023. This growth rate represents a decline against the previous quarter’s 19%, as the market feels the effect of spending pressures, though slower growth is also a consequence of the market’s greater size. In Q2 2023, the top three vendors, AWS, Microsoft Azure and Google Cloud, collectively grew 20% – down from 22% in Q1 – to account for 65% of total spending. While AWS and Microsoft both saw a deceleration in growth, Google Cloud’s growth rate remained stable compared with the previous quarter, at 31%.
The cloud infrastructure services market is feeling the impact of pressure on customer spending, the analyst firm noted, but pointed out that the slower growth is also a result of the increased size of the market.
Although AI hasn’t yet had a meaningful impact on revenues, there is plenty of cause for optimism. Canalys says AI represents a major driver of cloud investment in the future, and all the major cloud vendors continue to invest heavily in AI technologies. However, cloud service providers will have to be selective when deciding who to partner with in this market.
In the current business landscape, where emphasis is placed on cost control, cloud vendors must secure a significant influx of new customers and workloads to drive revenue growth. The emergence of AI technology is introducing new cloud workloads and is set to fuel massive demand for computing capacity, creating new opportunities for cloud growth. Notably in this quarter, both AWS and Microsoft launched new AI-oriented partner programs, recognizing the importance of collaborating with partners to drive customers’ use of their AI products.
“The most common collaboration model involves partners contributing their industry expertise, business process knowledge and data analytics experience within relationships,” said Yi Zhang, Research Analyst at Canalys. “Cloud providers, in turn, offer partners early exposure to their emerging technologies and provide technical support.”
“In the meantime, vendors need to separate the wheat from the chaff when it comes to driving their AI strategies through partners,” said Alex Smith, VP at Canalys. “That means focusing on partners that are building service practices around AI, engaging in sales and marketing initiatives that focus on AI, producing original thought leadership and compelling case studies around AI applications, and selling solutions that are embedded with AI capabilities. It’s these partners that will assume a leading role in steering companies toward being leaders in this field.”

Amazon Web Services (AWS) continued to lead the cloud infrastructure services market in Q2 2023, accounting for 30% of total spend, an increase of 12% year on year. AWS’s growth has more than halved since the same period last year. In the face of subdued revenue growth, AWS is actively increasing its investments in AI. It invested US$100 million in a new generative AI program, which was launched in June 2023. As part of the program, the AWS Generative AI Innovation Center will serve as a hub for free workshops and training and is expected to help enterprises accelerate the development of generative AI-based applications while connecting AWS’ technology with customers and partners. Recent announcements from AWS reveal that thousands of customers are engaging with its new AI service and, concurrently, AWS has established new partnerships with Omnicom and 3M Health Information Systems.
Microsoft Azure accounted for 26% of the market after growing 26% annually, positioning it as the second-largest cloud service provider in Q2 2023. Business performance is expected to remain steady, given the 19% increase in its cloud order backlog, which reached US$224 billion in Q2 2023. It has seen significant momentum in its Azure OpenAI Service, winning noteworthy clients including Ikea, Volvo Group and Zurich Insurance. In light of the projected surge in AI demand, it introduced the Microsoft AI Cloud Partner Program during its global partner event, Microsoft Inspire 2023. This aims to encourage Microsoft’s partner ecosystem to develop solutions that use Microsoft’s AI technology. Microsoft aims to ensure a smooth transition for its existing partners, automatically enrolling them in the new program while retaining their previous benefits and designations.
Google Cloud grew 31% year on year in Q2 2023, the strongest growth of the top three hyperscalers, to capture 9% of the cloud market. Its approach to extending the depreciation period for servers and network equipment helped control operating costs and bolstered Google Cloud’s profitability. Google Cloud’s partner ecosystem continues to provide support in the development of its generative AI applications. Hundreds of ISVs and SaaS providers, including Box, Salesforce and Snorkel, along with GSIs, have committed to training over 150,000 individuals on Google Cloud’s Generative AI. Google Cloud claims to command the allegiance of over 70% of burgeoning tech startups that specialize in generative AI. This roster features standout names such as Cohere, Jasper and Typeface, exemplifying the trust startups place in Google Cloud’s AI capabilities.
Canalys defines cloud infrastructure services as those services that provide infrastructure-as-a-service and platform-as-a-service, either on dedicated hosted private infrastructure or shared public infrastructure. This excludes software-as-a-service expenditure directly but includes revenue generated from the infrastructure services being consumed to host and operate them.
For more information, please contact:
Alex Smith: [email protected]
Yi Zhang: [email protected]
References:
https://canalys.com/newsroom/global-cloud-services-q2-2023
Canalys: Cloud marketplace sales to be > $45 billion by 2025
Global Cloud VPN Market Report: Rising Demand for Cloud-based Security Services
Synergy & IDC: Hosted and Cloud Services are driving the Unified Communications & Collaboration Markets
Forbes: Cloud is a huge challenge for enterprise networks; AI adds complexity
IDC: Cloud Infrastructure Spending +13.5% YoY in 4Q-2021 to $21.1 billion; Forecast CAGR of 12.6% from 2021-2026
Strong growth for global cloud infrastructure spending by hyperscalers and enterprise customers
Canalys: Cloud marketplace sales to be > $45 billion by 2025
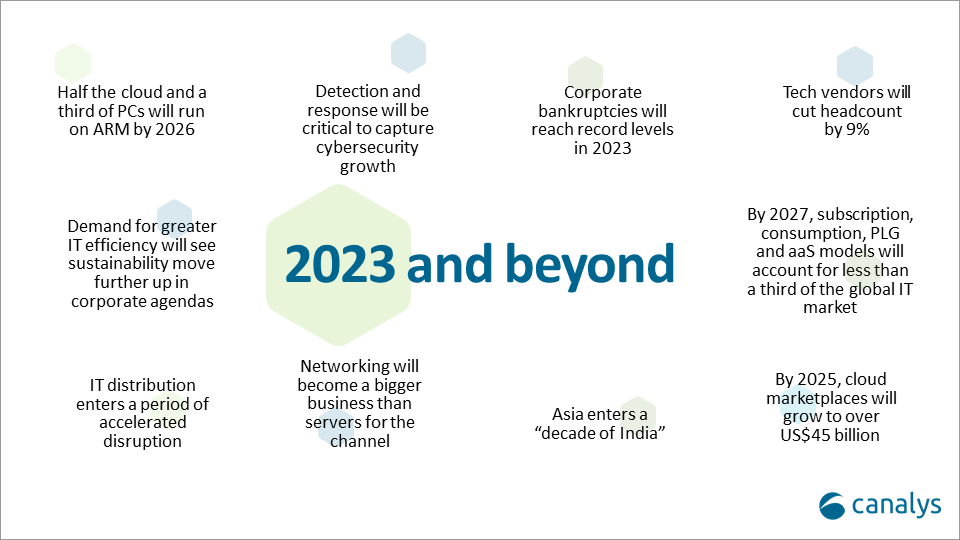
Canalys now expects that by 2025, cloud marketplaces will grow to more than $45 billion, representing an 84% CAGR. That was one of the market research firm’s predictions for 2023 and beyond (see chart below).
Cloud marketplaces [1.] are accelerating as a route to market for technology, led by hyperscale cloud vendors such as Alibaba, Amazon Web Services, Microsoft, Google and Salesforce, which are pouring billions of development dollars into the sector.
Note 1. A cloud marketplace is an online storefront operated by a cloud service provider. A cloud marketplace provides customers with access to software applications and services that are built on, integrate with or complement the cloud service provider’s offerings. A marketplace typically provides customers with native cloud applications and approved apps created by third-party developers. Applications from third-party developers not only help the cloud provider fill niche gaps in its portfolio and meet the needs of more customers, but they also provide the customer with peace of mind by knowing that all purchases from the vendor’s marketplace will integrate with each other smoothly.
…………………………………………………………………………………………………………………………………………………………………….
“The marketplace route to market is on fire and cannot be ignored by any channel leader,” said Canalys Chief Analyst, Jay McBain. “Marketplaces grew more in the first three months of the pandemic than in the previous decade and have just kept growing,” he added.
“We under-called it,” explained Steven Kiernan, vice president at Canalys. “Cloud marketplaces are accelerating at such a dizzying speed that we’ve doubled our pre-pandemic forecast.
Some software vendors that are active on marketplaces, in particular cybersecurity vendors, are publicly reporting as much as 600% year-on-year growth via this channel, according to McBain.
In addition, the hyperscalers are now reporting growing numbers of billion-dollar customer commitments through enterprise cloud consumption credits, which cover more than just software.
The large cloud marketplaces have lowered fees from upwards of 20% down to 3%, enabling vendors to fund multi-partner offers inside the transaction.
Private equity is funding billions more into marketplace development firms such as AppDirect, Mirakl, Vendasta and CloudBlue to enable hundreds of niche marketplaces across different buyers, industries, geographies, customer segments, product areas and business models.

Canalys Chief Analyst, Alastair Edwards:
“The rise of this route to market represents a threat to both resellers and two-tier distribution. But as more complex technologies are consumed via marketplaces, end customers are also turning to trusted partners to help them discover, procure and manage marketplace purchases. The hyperscalers are increasingly recognizing the value of channel partners, allowing them to create customized vendor offers for end-customers, and supporting the flow of channel margins through their marketplaces. Hyperscalers’ cloud marketplaces are becoming a growing force in global IT distribution as a result.”
By 2025, Canalys conservatively forecasts that almost a third of marketplace procurement will be done via channel partners on behalf of their end customers.
Canalys key predictions for 2023 and beyond:
About Canalys:
Canalys is an independent analyst company that strives to guide clients on the future of the technology industry and to think beyond the business models of the past. We deliver smart market insights to IT, channel and service provider professionals around the world. We stake our reputation on the quality of our data, our innovative use of technology and our high level of customer service.
References:
https://canalys.com/newsroom/cloud-marketplace-forecast-2023
https://www.canalys.com/resources/Canalys-outlook-2023-predictions-for-the-technology-industry
https://www.techtarget.com/searchitchannel/definition/cloud-marketplace
Canalys: Global cloud services spending +33% in Q2 2022 to $62.3B
AWS, Microsoft Azure, Google Cloud account for 62% – 66% of cloud spending in 1Q-2022
IDC: Cloud Infrastructure Spending +13.5% YoY in 4Q-2021 to $21.1 billion; Forecast CAGR of 12.6% from 2021-2026
AWS, Google, Microsoft, Oracle win $9B DoD cloud computing contract (JWCC)
The U.S. Department of Defense (DoD) finally revealed the awards for its revamped cloud contract “Joint Warfighting Cloud Capability (JWCC),” with Amazon Web Services (AWS), Microsoft, Google and Oracle collectively getting $9 billion to improve the agency’s IT operations. The contracts run through 2028 the Pentagon said in a news release.
JWCC is a multiple-award contract vehicle that will provide the DoD the opportunity to acquire commercial cloud capabilities and services directly from the commercial Cloud Service Providers (CSPs) at the speed of mission, at all classification levels, from headquarters to the tactical edge.
This Indefinite-Delivery, Indefinite-Quantity (IDIQ) contract vehicle offers commercial pricing, or better, and streamlined provisioning of cloud services. With JWCC, warfighters will now have the opportunity to acquire the following capabilities under one contract:
- global accessibility
- available and resilient services
- centralized management and distributed control
- ease of use
- commercial parity
- elastic computing, storage, and network infrastructure
- advanced data analytics
- fortified security
- tactical edge devices
To get started using JWCC or to learn more, visit to contact the Defense Information Systems Agency (DISA) Hosting and Compute Center (HaCC) or to log-in to the JWCC Customer Portal. DISA has developed user-friendly cloud accelerators to make it easier for DOD customers to purchase, provision, and onboard into the cloud.

Photo of the U.S. Pentagon/DoD
The decision to award contracts to four companies was a shift for the Pentagon, three years after it had given a $10 billion cloud-computing contract to Microsoft. That contract, for the Joint Enterprise Defense Infrastructure, known as JEDI, became part of a legal battle over claims that President Donald J. Trump interfered in a process that favored Microsoft over its rival bidder, Amazon. In 2021, the Defense Department said it would not move forward with the Microsoft contract, as it “was developed at a time when the department’s needs were different and our cloud conversancy less mature.”
Instead, the Pentagon said, it would seek bids from multiple technology companies for the Joint Warfighting Cloud Capability. While market research indicated that Microsoft and Amazon would be best positioned to meet the needs, officials said they would also reach out to IBM, Oracle and Google.
“This is the biggest cloud Beltway deal in history and was a key deal to win for all the software vendors in this multiyear soap opera,” Dan Ives, a tech analyst with Wedbush Securities, said in an email. “It’s good to finally end this chapter and get a cloud deal finally done for the Pentagon after years of a roller coaster,” he added.
An AWS spokesperson said in an email, “We are honored to have been selected for the Joint Warfighting Cloud Capability contract and look forward to continuing our support for the Department of Defense. From the enterprise to the tactical edge, we are ready to deliver industry-leading cloud services to enable the DoD to achieve its critical mission.”
References:
Synergy: Q3 Cloud Spending Up Over $11 Billion YoY; Google Cloud gained market share in 3Q-2022
Synergy Research estimates the cloud infrastructure market at $57B in Q3-2022. That was up by well over $11 billion from the third quarter of last year despite two fierce headwinds – historically strong U.S. dollar and a severely restricted Chinese market. The incremental spending represents year-on-year growth of 24%. If exchange rates had remained constant over the last year, the growth rate would have been over 30%. As the market continues on a strong growth trajectory,
Google is alone among the hyper-scaler giants to be gaining market share. Google Cloud increased its market share in Q3 compared to the prior quarter, while Amazon and Microsoft market shares remained relatively unchanged. Compared to a year ago all three have increased their market share by at least a percentage point. Amazon, Microsoft and Google combined had a 66% share of the worldwide market in the quarter, up from 61% a year ago. In aggregate all other cloud providers have tripled their revenues since late 2017, though their collective market share has plunged from 50% to 34% as their growth rates remain far below the market leaders.

Synergy estimates that quarterly cloud infrastructure service revenues (including IaaS, PaaS and hosted private cloud services) were $57.5 billion, with trailing twelve-month revenues reaching $217 billion. Public IaaS and PaaS services account for the bulk of the market and those grew by 26% in Q3. The dominance of the major cloud providers is even more pronounced in public cloud, where the top three control 72% of the market. Geographically, the cloud market continues to grow strongly in all regions of the world.
“It is a strong testament to the benefits of cloud computing that despite two major obstacles to growth the worldwide market still expanded by 24% from last year. Had exchange rates remained stable and had the Chinese market remained on a more normal path then the growth rate percentage would have been well into the thirties,” said John Dinsdale, a Chief Analyst at Synergy Research Group. “The three leading cloud providers all report their financials in US dollars so their growth rates are all beaten down by the historic strength of their home currency. Despite that all three have increased their share of a rapidly growing market over the last year, which is a strong testament to their strategies and performance. Beyond these three, all other cloud providers in aggregate have been losing around three percentage points of market share per year but are still seeing strong double-digit revenue growth. The key for these companies is to focus on specific portions of the market where they can outperform the big three.”
Synergy provides quarterly market tracking and segmentation data on IT and Cloud related markets, including vendor revenues by segment and by region. Market shares and forecasts are provided via Synergy’s uniquely designed online database SIA™, which enables easy access to complex data sets. Synergy’s Competitive Matrix™ and CustomView™ take this research capability one step further, enabling our clients to receive on-going quantitative market research that matches their internal, executive view of the market segments they compete in.
References:
Synergy Research: public cloud service and infrastructure market hit $126B in 1Q-2022
Cloud Computing Giants Growth Slows; Recession Looms, Layoffs Begin
Canalys: Global cloud services spending +33% in Q2 2022 to $62.3B
According to market research firm Canalys, cloud infrastructure services continued to be in high demand in Q2 2022. Worldwide cloud spending increased 33% year on year to US$62.3 billion, driven by a range of factors, including demand for data analytics and machine learning, data center consolidation, application migration, cloud-native development and service delivery. The growing use of industry-specific cloud applications also contributed to the broader horizontal use cases seen across IT transformation. The latest Canalys data shows expenditure was over US$6 billion more than in the previous quarter and US$15 billion more than in Q2 2021.
The top three vendors in Q2 2022, Amazon Web Services (AWS), Microsoft Azure and Google Cloud, together accounted for 63% of global spending in Q2 2022 and collectively grew 42%. The key to increasing global market share is continually growing and upgrading cloud data center infrastructure, which all big three cloud service providers are working on.
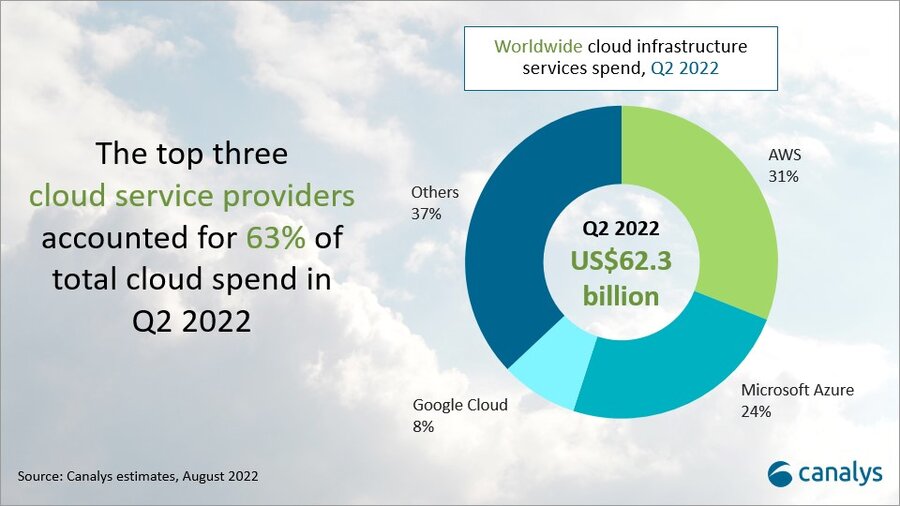
- AWS accounted for 31% of total cloud infrastructure services spend in Q2 2022, making it the leading cloud service provider. It grew 33% on an annual basis.
- Microsoft Azure was the second largest cloud service provider in Q2, with a 24% market share after growing 40% annually.
- Google Cloud grew 45% in the latest quarter and accounted for an 8% market share.
In the next year, AWS plans to launch 24 new availability zones in eight regions, and Microsoft plans to launch 10 new cloud regions. Google Cloud, which accounted for 8% of Q2 cloud spend, recently announced Latin America expansion plans.
The hyperscale battle between leader AWS and challenger Microsoft Azure continues to intensify, with Azure closing the gap on its rival. Fueling this growth, Microsoft had a record number of larger multi-year deals in both the US$100 million-plus and US$1 billion-plus segments. Microsoft also said it plans to increase the efficiency of its server and network equipment by extending the depreciable useful life from four years to six.
A diverse go-to-market ecosystem, combined with a broad portfolio and wide range of software partnerships is enabling Microsoft to stay hot on the heels of AWS in the race to be #1 in cloud services.
“Cloud remains the strong growth segment in tech,” said Canalys VP Alex Smith. “While opportunities abound for providers large and small, the interesting battle remains right at the top between AWS and Microsoft. The race to invest in infrastructure to keep pace with demand will be intense and test the nerves of the companies’ CFOs as both inflation and rising interest rates create cost headwinds.”
Both AWS and Microsoft are continuing to roll out infrastructure. AWS has plans to launch 24 availability zones across eight regions, while Microsoft plans to launch 10 new regions over the next year. In both cases, the providers are increasing investment outside of the US as they look to capture global demand and ensure they can provide low-latency and high data sovereignty solutions.
“Microsoft announced it would extend the depreciable useful life of its server and network equipment from four to six years, citing efficiency improvements in how it is using technology,” said Smith. “This will improve operating income and suggests that Microsoft will sweat its assets more, which helps investment cycles as the scale of its infrastructure continues to soar. The question will be whether customers feel any negative impact in terms of user experience in the future, as some services will inevitably run on legacy equipment.”
Beyond the capacity investments, software capabilities and partnerships will be vital to meet customers’ cloud demands, especially when considering the compute needs of highly specialized services across different verticals.
“Most companies have gone beyond the initial step of moving a portion of their workloads to the cloud and are looking at migrating key services,” said Canalys Research Analyst Yi Zhang. “The top cloud vendors are accelerating their partnerships with a variety of software companies to demonstrate a differentiated value proposition. Recently, Microsoft pointed to expanded services to migrate more Oracle workloads to Azure, which in turn are connected to databases running in Oracle Cloud.”
Canalys defines cloud infrastructure services as those that provide infrastructure-as-a-service and platform-as-a-service, either on dedicated hosted private infrastructure or shared public infrastructure. This excludes software-as-a-service expenditure directly, but includes revenue generated from the infrastructure services being consumed to host and operate them.
For more information, please contact: Alex Smith: [email protected] OR Yi Zhang: [email protected]
References:
IDC: Worldwide Public Cloud Services Revenues Grew 29% to $408.6 Billion in 2021 with Microsoft #1?
The worldwide public cloud services market, including Infrastructure as a Service (IaaS), Platform as a Service (PaaS), Software as a Service – System Infrastructure Software (SaaS – SIS), and Software as a Service – Applications, grew 29.0% year over year in 2021 with revenues totaling $408.6 billion, according to the International Data Corporation (IDC) Worldwide Semiannual Public Cloud Services Tracker.
Spending continued to consolidate in 2021 with the combined revenue of the top 5 public cloud service providers (Microsoft, Amazon Web Services, Salesforce Inc., Google, and SAP) capturing nearly 40% of the worldwide total and growing 36.6% year over year. With offerings in all four deployment categories, Microsoft captured the top position in the overall public cloud services market with 14.4% share in 2021, followed closely by Amazon Web Services with 13.7% share.
“Organizations continued their strong adoption of shared public cloud services in 2021 to align IT investments more closely with business outcomes and ensure rapid access to the innovations required to be a digital-first business,” said Rick Villars, group vice president, Worldwide Research at IDC. “For the next several years, leading cloud providers will play a critical role in helping enterprises navigate the current storms of disruption (inflation, supply chain, and geopolitical tensions), but IT teams will also focus more on bringing greater financial accountability to the variable spend models of public cloud services.”
While the overall public cloud services market grew 29.0% in 2021, revenue for foundational cloud services* that support digital-first strategies saw revenue growth of 38.5%. This highlights the increasing reliance of enterprises on a cloud innovation platform built around widely deployed compute services, data/AI services, and app framework services to drive innovation. IDC expects spending on foundational cloud services (especially IaaS and PaaS elements) to continue growing at a higher rate than the overall cloud market as enterprises leverage cloud to overcome the current disruptions and accelerate their shift toward digital business.
“The last few years have demonstrated that in challenging times, businesses increasingly rely on cloud services to modernize their operations and deliver more value to customers,” said Dave McCarthy, research vice president, Cloud and Edge Infrastructure Services. “This trend is expected to continue as public cloud providers offer more ways of extending cloud services to on-premises datacenters and edge locations. These expanded deployment options reduce many barriers to migration and will facilitate the next wave of cloud adoption.”
“In the digital-first world, enterprises that are serious about competing for the long term use the lens of business outcomes to evaluate strategic technology decisions, which fuels the fast-growing ecosystem seen in the public cloud market,” said Lara Greden, research director, Platform as a Service, IDC. “Cloud service providers showed relentless drive to enhance the productivity of developers and overall speed of application delivery, including emphasis on containers-first and serverless-first approaches.”
“SaaS applications remain the largest and most mature segment of public cloud, with 2021 revenues that have now reached $177 billion. The tailwinds of the pandemic continued to fuel expedited upgrades and replacements of older systems in 2021, though company goals haven’t changed. Companies seek applications that will help increase enterprise intelligence, improve operational efficiency, and drive better decision making. Ease of use, ease of implementation and integration, streamlined workflows, data and analytical accessibility, and time to value are the key criteria driving purchasing decisions, though verticalization has also steadily increased as a key priority,” said Eric Newmark, group vice president and general manager of IDC’s SaaS, Enterprise Software, and Worldwide Services division.
| Worldwide Public Cloud Services Revenue and Year-over-Year Growth, Calendar Year 2021 (revenues in US$ billions) | |||||
| Deployment Category | 2021 Revenue | Market Share | 2020 Revenue | Market Share | Year-over-Year Growth |
| IaaS | $91.3 | 22.4% | $67.3 | 21.3% | 35.6% |
| PaaS | $68.2 | 16.7% | $49.1 | 15.5% | 39.1% |
| SaaS – Applications | $177.8 | 43.5% | $143.9 | 45.4% | 23.5% |
| SaaS – System Infrastructure Software | $71.2 | 17.4% | $56.4 | 17.8% | 26.4% |
| Total | $408.6 | 100% | $316.7 | 100% | 29.0% |
| Source: IDC Worldwide Semiannual Public Cloud Services Tracker, 2H 2021 | |||||
While both the foundational cloud services market and the SaaS – Applications market are led by a small number of companies, there continues to be a healthy long tail of companies delivering cloud services around the globe. In the foundational cloud services market, these leading companies account for nearly three quarters of the market’s revenues with targeted use case-specific PaaS services or cross-cloud compute, data, or network governance services. The long tail is more pronounced in the SaaS– Applications market, where customers’ growing focus on specific outcomes ensures that over two thirds of the spending is captured outside the top 5.
Analysis:
We remain SUPER SKEPTICAL about IDC’s claim that Microsoft beat out cloud rival Amazon Web Services (AWS) in capturing the largest share of global public cloud services revenue last year. That conflicts with all our other resource checks!!!
IDC reported that Microsoft accumulated 14.4% of the market’s $408.6 billion in revenues last year, just a whisker ahead of the 13.7% that AWS snared. Microsoft has offerings in all four sections of the public cloud services market lumped by IDC into its report, including infrastructure as a service (IaaS), platform as a service (PaaS), system infrastructure SaaS, and application SaaS.
Salesforce, Google, and SAP rounded out the top five in IDC’s ranking, with those vendors capturing 40% of the total market. Overall market revenues increased 29% compared to the previous year.
SaaS applications brought in the most cloud services revenue with $177.8 billion, representing 23.5% growth from the year prior. IaaS accounted for $91.3 billion of revenue, followed by system infrastructure SaaS and PaaS.
Of the categories comprising IDC’s public cloud foundational services, PaaS saw the highest year-over-year growth at 39.1%, though it brought in the least 2021 revenue at $68.2 billion.
“Organizations continued their strong adoption of shared public cloud services in 2021 to align IT investments more closely with business outcomes and ensure rapid access to the innovations required to be a digital-first business,” IDC VP Rick Villars said in a statement.
In an increasingly digital world, enterprises that are truly thinking ahead use a business outcomes lens to make strategic decisions, and this is what fuels public cloud ecosystem growth, IDC PaaS Research Director Lara Greden explained.
Cloud service providers played their part in that growth this year with a “relentless drive” to improve developer productivity and speed of application delivery, “including emphasis on containers-first and serverless-first approaches,” she added.
Villars expects these cloud giants will continue to have a crucial role in helping enterprises solve persistent market challenges like supply chain disruption, inflation, and geopolitical tension.
“IT teams will also focus more on bringing greater financial accountability to the variable spend models of public cloud services,” Villars added.
……………………………………………………………………………………………………………………………………..
* Note: IDC defines Foundational Cloud Services as the Infrastructure as a Service (IaaS), Platform as a Service (PaaS), and Software as a Service – System Infrastructure Software (SaaS – SIS) market segments where the top eight public cloud services providers (Amazon Web Services, Microsoft, Google, Alibaba Group, IBM, Tencent, Huawei, and Oracle) account for most of the revenue. These include the following key service portfolios:
- Compute Services: Virtualized x86 Compute, Bare Metal Compute, Block Storage, Accelerated Compute, Other Compute, and Software-Defined Compute Software.
- Data Services: Data Management Systems, Object Storage, File Storage, and Event Stream Processing Software.
- App Framework Services: Developer-centric software to develop and deploy applications in the cloud, including lifecycle management. These services include Integration Software, Deployment-Centric Application Platforms, and AI Lifecycle Software.
- Usage Multiplier Services: Services that encourage greater/more effective use of high value services by making it easier to adopt, connect, deploy, track, secure, and update those services. Includes load balancing and DNS as well as marketplaces and bundles of open-source software solutions.
References:
https://www.idc.com/getdoc.jsp?containerId=prUS49420022
IDC’s New Public Cloud Numbers: Microsoft Azure Edged Out AWS in 2021
IDC: Microsoft Azure now tied with AWS as top global cloud services provider
