Month: May 2021
IDC: Microsoft Azure now tied with AWS as top global cloud services provider
Spending continued to consolidate in 2020 with the combined revenue of the top five public cloud service providers (Amazon Web Services (AWS), Microsoft (Azure), Salesforce.com, Google, and Oracle) increased their spending by 32% and captured 38% of the worldwide total market.
Thanks to an expanding portfolio of SaaS and SISaaS offerings, Microsoft now shares the top position with Amazon Web Services in the whole public cloud services market with both companies holding 12.8% revenue share for the year.
“Access to shared infrastructure, data, and application resources in public clouds played a critical role in helping organizations and individuals navigate the disruptions of the past year,” said Rick Villars, group vice president, Worldwide Research at IDC. “In the coming years, enterprises’ ability to govern a growing portfolio of cloud services will be the foundation for introducing greater automation into business and IT processes while also becoming more digitally resilient.”
While the overall public cloud services market grew 24.1% in 2020, consistent with the past four years, the IaaS and PaaS segments have consistently grown at much faster rates. This highlights the increasing reliance of enterprises on a cloud foundation built on cloud infrastructure, software defined data, compute and governance solutions as a Service, and cloud-native platforms for application deployment for enterprise IT internal applications. IDC expects spending on foundational cloud services (especially IaaS and PaaS) to continue growing at a higher rate than the overall cloud market as resilience, flexibility, and agility guide IT platform decisions.
“Cloud service providers are rapidly expanding their portfolio of infrastructure and platform services to address confidential computing, performance intensive computing, and hybrid deployment scenarios,” said Dave McCarthy, vice president, Cloud and Edge Infrastructure Services. “Extending these foundational cloud services to customer premises and communications networks enables a broader set of use cases than previously possible.”
“The high pace of growth in PaaS, IaaS, and SISaaS, which combined account for about half of the public cloud services market, reflects the demand for solutions that accelerate and automate the development and delivery of modern applications” said Lara Greden, research director, Platform as a Service. “As organizations adopt DevOps approaches and align according to value streams, we are seeing PaaS, IaaS, and SISaaS solutions become increasingly adopted and, at the same time, grow in the range of services and thus value they provide. Innovations in edge and IoT use cases are also contributing to the faster rates of growth in these markets.”
“SaaS applications are the largest and most mature segment of public cloud with 2020 revenues of $148 billion. Organizations across industries hastened the replacement of legacy business applications with a new breed of SaaS applications that is data-driven, intuitive, composable, and ideally suited for more distributed cloud architectures. Organizations looking for industry-specific applications can choose from a growing assortment of vertical applications. The SaaS apps market is dominated by a longtail of providers that account for 65% of the total market,” said Frank Della Rosa, research director, SaaS and Cloud Software.
Worldwide Public Cloud Services Revenue and Year-over-Year Growth, Calendar Year 2020 (revenues in US$ billions)
| Segment | 2020 Revenue | Market Share | 2019 Revenue | Market Share | Year-over-Year Growth |
| IaaS | $67.2 | 21.5% | $50.2 | 19.9% | 33.9% |
| SaaS – System Infrastructure Software | $49.2 | 15.7% | $40.2 | 16.0% | 22.4% |
| PaaS | $47.6 | 15.2% | $36.1 | 14.4% | 31.8% |
| SaaS – Applications | $148.4 | 47.5% | $125.2 | 49.7% | 18.6% |
| Total | $312.4 | 100% | $251.7 | 100% | 24.1% |
| Source: IDC Worldwide Semiannual Public Cloud Services Tracker, 2H20 | |||||
Looking at the segment results, a combined view of IaaS, SISaaS, and PaaS spending is relevant because it represents the foundational set of services that end customers and SaaS companies consume when running, modernizing, building, and governing applications on shared public clouds. In the combined IaaS, SISaaS and PaaS market, the top 5 companies (Amazon Web Services, Microsoft, Google, Alibaba, and IBM) captured over 51% of global revenues. But there continues to be a healthy long tail, representing nearly half the market total. These are companies with targeted use case-specific PaaS services or cross-cloud compute, data, or network governance services. The long tail is even more pronounced in SaaS, where customers growing focus on specific outcomes ensures that over two thirds of the spending is captured outside the top five.
5 European telcos publish Open RAN Technical Priorities Document
Five major European network operators have issued a white paper outlining their technical requirements for the open, disaggregated radio access network products they want to deploy in significant deployments starting next year.
The telco quintet – Deutsche Telekom, Orange, Telefónica, TIM (Telecom Italia) and Vodafone – signed the Memorandum of Understanding (MoU) on The Implementation of Open RAN Based Networks In Europe earlier this year and have now set out their technical stall so that the vendor community has some guidance with which to work.
The ‘Technical Priorities Document’ provides a set of “technical requirements that the signatories of the Open RAN MoU consider priorities for Open RAN architecture. It serves as a guidance to the RAN supplier industry on where to focus to accelerate market deployments in Europe, focusing on commercial product availability in the short term, as well as solution development in the medium term. In terms of timeframe, the operators wish to ensure the readiness of Open RAN solutions for large scale network roll-out from 2022 onwards. Macro deployment is identified as the primary target for the operators.”
The telco quintet say they are not seeking to develop new specifications or standards in this process, but simply identify their preferences in terms of technology and architecture that are based primarily on the specifications being developed by the O-RAN Alliance.
There are many requirements, particularly around the IT requirements underpinning the Open Cloud architecture that needs to support containerized cloud native functions (CNFs). You can read the full document here.
Opinion:
How many Open RAN technical requirements and spec writing consortiums/alliances are necessary? We already have O-RAN Alliance, TIP Open RAN Project, Open RAN Policy Committee, and slew of company alliances. That is NOT the way specifications are created as there are surely overlaps, duplications and gaps in one or more of these entities requirements documents. This will surely result in mass confusion and slow the market for Open RAN equipment.
The way to proceed, IMHO, is to have the operators work through the O-RAN Alliance to state which of their requirements are mandatory and which are optional. This is what PTT’s did from 1976-1996 within CCITT to standardize X.21, X.25, ISDN, Frame Relay, and ATM. They did likewise from 1998-2000 to standardize ADSL and VDSL within ITU-T.
……………………………………………………………………………………………………………………………………………….
The Open RAN Requirements document highlights multiple interfaces that need specific attention by technology developers. For example, adherence to an Open F1 interface for the centralized unit/distributed unit (CU/DU) split, as well as Open X2/Xn interfaces for connectivity between base stations – but stresses the importance of open fronthaul, described as “the prime interface to be supported in a fully interoperable manner, without compromising network performance, especially for Massive-MIMO.” The O-RAN Alliance 7.2x interface the preference of the five operators, though they note there is the need to “further investigate UL [uplink] enhancements for the 7.2x split in order to improve performance and robustness particularly in mobility scenarios.”
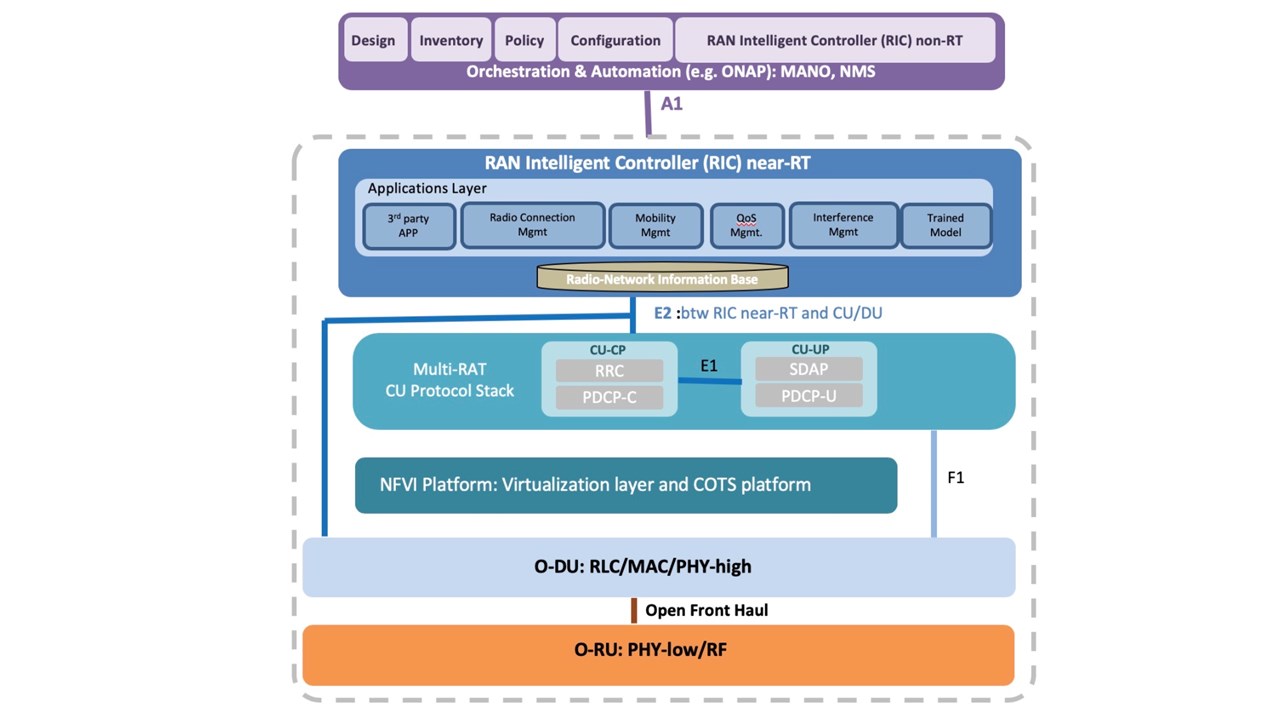
The paper also stresses that focus should be on 4G/5G in the 3.4-3.8 GHz bands as well as legacy FDD (frequency division duplex) bands. The operators believe that mmWave bands are more specific to certain markets and so not as important initially for this set of operators. As for interoperability with legacy mobile networks, the paper notes that “the operators are interested in inter-operability between 2G/3G baseband units and RUs, based on proprietary interfaces, since no open interface has been specified successfully. This applies mainly to hybrid Radio Units supporting 2G/3G/4G/5G, but also for legacy 2G/3G only RUs already deployed.”
In addition, the operators need to be sure that the Open RAN technology they deploy will enable RAN sharing: “While MORAN [multi-operator RAN] with shared O-RU only and MOCN [multi-operator core network] support is unanimously requested, both shared infra and dedicated infra per operator is relevant, depending on whether the infra is deployed on the same site or deployed autonomously by each operator in their target location (e.g. in their own cloud). Efficient RAN sharing management is required to allow sufficient independence between operators to manage their own CNFs on a shared infra, while avoiding any potential conflicts.”
References:
NTT DoCoMo: Higher Earnings; Big plans for 5G but lots of competition
NTT DoCoMo, now a fully owned unit of parent NTT Group, reported 6.3% higher full-year earnings of 629 billion yen (US$5.74 million). Revenue was 1.6% higher at 4.73 trillion yen ($43.14 billion) while operating costs were flat.
Quarterly mobile revenue, which had fallen in the first half of the year, grew slightly in the last two quarters, although over the full year it was flat at 2.7 trillion yen ($24.6 billion). The new Ahamo discount plans, launched in March, attracted more than 1 million new customers to the end of March, most of them aged under 30, DoCoMo CEO Motoyuki Ii told analysts on Thursday.
In its presentation to investors, the company described their 5G goals:
- Build 5G coverage that exceeds competitions’ in both speed and breadth while elevating our service offerings. Concentrate managerial resources on 5G to deliver on efficiency improvement at the same time.
- Concentrate network investments on 5G and improve efficiency of 4G spend, to achieve reduction in total expenditures.
- Accelerate replacement of base stations from 3G to 5G to suppress total network costs
DoCoMo had 3.09 million 5G customers as of March 31st, with a target of 10 million in the current fiscal year. In fiscal year 2020, there were 7,100 base stations deployed (in 574 major cities in Japan). In fiscal year 2021, the company expects to deploy 20,000 base stations and commence 5G core/SA service. The 5G SA network will be deployed only “where there is actual demand” for enterprise services such as network slicing.
Also, 55% of Japan’s population will be covered by “Lightning Speed 5G” (that uses sub-6GHz bands and millimeter wave spectrum).
DoCoMo’s most promising 5G solution was a joint venture with machinery company Komatsu to provide smart construction services, Ii said. The LANDLOG open platform connects land, equipment and materials for innovative and smart construction. These would be sold globally through NTT Group sales channels as well as locally.
Image Credit: Getty Images
……………………………………………………………………………………………………………………………….
Challenge toward a “New DoCoMo” include the following initiatives:
- Drive innovation and bring major changes to society.
- Pursue “customer-first” and deliver new value that exceeds customers’ expectations.
- Enhance customer experience (CX) and realize business structure reform by promoting and executing digitalization of business operations and data utilization.
- Promote business and ESG management in an integrated manner, thereby contributing to the creation of a sustainable society.
FY 2021 Principal Actions include:
Telecom Business:
- Expand customer base by offering rate plans and services catered to diverse customer needs.
- Achieving both Early expansion of 5G coverage and improvement of network cost efficiency.
- Accelerate digital shift of sales channel and digital transformation (DX) of call centers and DoCoMo Shops (converged online/offline CX).
Enterprise Business:
- Expand areas/industries where 5G solutions are applied and achieve nationwide deployment.
- Support DX of small- and medium-sized companies through early proliferation of “Business d Account.”
Smart Life Business:
- Expand finance/payment business and establish data-driven B2B2X ecosystem.
- Create new lifestyles centered on video offerings and expand new business domains.
With respect to earnings guidance, DoCoMo forecast a 1.4% increase in operating profit for the 2021-22 financial year, with Smart Life services expected to improve earnings by 9.3%. Telecom group operating profit is projected to fall 1.6%.
……………………………………………………………………………………………………………………………………
Sidebar: Japan Mobile Network Competition for DoCoMo
Mobile sites in Japan (courtesy of Light Reading)
| Mobile sites | 5G sites | 5G sites target | |
| KDDI | 110,000 | 10,000 | 50,000 by March 2022 |
| NTT DoCoMo | 80,000 | 7,100 | 20,000 by March 2022 |
| Rakuten | 44,000 (summer target) | 1,000 | N/A |
| SoftBank | 230,000 | N/A | 50,000 by March 2022 |
| Source: Companies | |||
KDDI says it had 10,000 5G base stations deployed at the end of March and is targeting 50,000 by March next year. KDDI estimates the latter number will provide population coverage of 90% of Japan’s population. Last year alone, it spent about JPY174 billion ($1.6 billion) on 4G and 5G rollout, as well as JPY200 billion ($1.8 billion) on “common equipment.”
SoftBank, the third operator, has precisely the same target of 50,000 base stations and 90% population coverage by March 2022.
………………………………………………………………………………………………………………………………………………
References:
https://www.nttdocomo.co.jp/english/corporate/ir/library/presentation/index.html
https://www.lightreading.com/5g/rakuten-and-curious-case-of-missing-5g-plan/d/d-id/769477?
Facebook to test 5G small cell network with SON features; Combine 5G access with Terragraph wireless backhaul?
The FCC today approved Facebook’s application to test a 5G small cell network across a wide range of mid-band spectrum bands (see below) at its Menlo Park, California headquarters.
Facebook told the FCC in its application:
The experiment involves short-term testing of a 5G over-the-air setup for an outdoor demonstration that is not likely to last more than six months, making an STA (Special Temporary Authority) more appropriate than a conventional experimental license.
The purpose of operation is to demonstrate the self-organizing network (“SON”) features in a 5G over-the-air setup operating in a small cell configuration. Lab testing does not allow feature realization. The outdoor test setup aims at validating the improvements done to 5G cellular networks.
The improvements involve:
(1) Load balancing between the cells in an attempt to optimize the resource utilization, reduce call drops, and create a better user experience by means of improved quality of service; and
(2) Run time selection and updates of the 5G cell physical layer cell identifiers (“PCIs”) to avoid conflict between neighboring cells, thereby avoiding UE drops and reducing network signaling traffic.
The frequency bands to be used are: 2.496-2.690 GHz, 3.3-3.6 GHz, 3.7-3.8 GHz, and 4.8-4.9GHz. A directional antenna will be used to beam the 5G signals.
Facebook did not name the network equipment suppliers for this test nor did they state why they needed to perform these tests. The only hint given was to test “self-organizing network (“SON”) features in a 5G over-the-air setup operating in a small cell configuration.”
One could speculate that Facebook might want to deploy a private 5G network across its sprawling Menlo Park campus. Or they might want to provide 5G access to municipalities using mid-band spectrum.
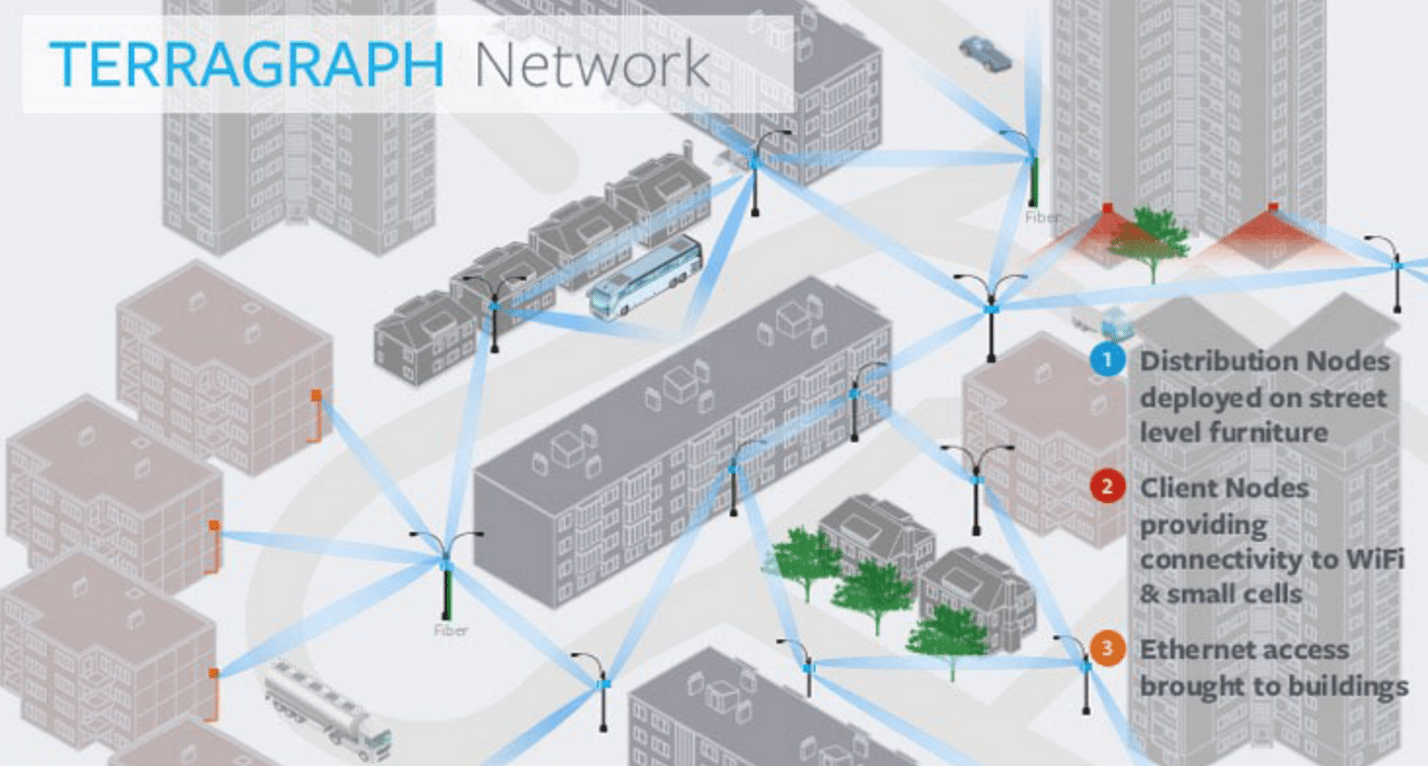
The company does have some recent experience designing and deploying millimeter wave wireless distribution networks (based on Terragraph) which could be combined with a 5G access network.
- Facebook’s Terragraph wireless backhaul technology is being used by Cambium Networks in their 60 GHz cnWave solution. Terragraph is a high-bandwidth, low-cost wireless solution to connect cities. Rapidly deployed on street poles or rooftops to create a mmWave wireless distribution network, Terragraph is capable of delivering fiber-like connectivity at a lower cost than fiber, making it ideally suited for applications such as fixed wireless access and Wi-Fi backhaul.
- In June 2018, Magyar Telekom, subsidiary of Deutsche Telekom, deployed their first Terragraph network in Mikebuda, Hungary. Terragraph improved local network speeds from 5M bps to 650M bps.
- Common Networks, a California based Internet Service Provider, deployed a Terragraph network to serve customers in Alameda, CA. Local businesses and customers of Common Networks saw an immediate improvement in internet speeds. Common Networks presented their approach at a 2018 IEEE ComSoc SCV technical meeting in Santa Clara, CA.
References:
https://apps.fcc.gov/oetcf/els/reports/STA_Print.cfm?mode=current&application_seq=106515
https://apps.fcc.gov/oetcf/els/reports/GetApplicationInfo.cfm?id_file_num=0482-EX-ST-2021
https://connectivity.fb.com/terragraph/
Facebook’s Terragraph gains momentum with operator, vendor buy-in
FTTH Council Europe: FTTH/B reaches nearly 183 million (>50% of all homes)
Europe has passed over half of homes able to receive fiber broadband. According to the latest figures compiled by Idate for the FTTH Council Europe, 52.5% of homes will be covered by FTTH/B at the end of September 2020. That’s up from 49.9% a year earlier.
FTTH Council Europe revealed the following:
• Number of homes passed by fiber (FTTH/B) reaches nearly 183 million homes in EU39.
• Europe’s fiber footprint (number of homes passed) expanded the most in the past year in France (+4.6M homes passed), Italy (+2.8M), Germany (+2.7M) and the UK (+1.7M).
• Three countries are accounting for almost 60% of homes left to be passed with fiber in the EU27+UK region.
• FTTH/B Coverage in Europe surpasses more than half of total homes.
• 16.6% growth in the number of fiber subscribers.
• Iceland leads the European FTTH/B league table second year in a row. 70.7% of its households having fiber connections. Belarus (70.4%) and Spain (62.6%) came in second and third.
• Belgium, Israel, Malta and Cyprus enter the FTTH/B ranking for the first time.
The above figures cover 39 countries across Europe, where nearly 183 million homes have fibre access. For the EU and UK alone, penetration reached 43.8 percent in September, up from 39.4 percent a year earlier.
The report also shows fiber take-up is accelerating, with a subscriber penetration of 44.9 percent of lines in the 39 countries, compared to 43 percent in September 2019. In total there were 81.9 million FTTH/B subscribers in September 2020, up 16.6 percent from a year earlier. Annual growth was again strongest in France, with nearly 2.8 million subscribers added in the 12 months, followed by Russia with 1.7 million and Spain with 1.4 million.
The countries with the highest fiber penetration across Europe are Iceland and Belarus, with over 70 percent of households using fiber broadband. Spain and Sweden are at over 60 percent, and Norway, Lithuania and Portugal over 50 percent.
“The telecoms sector can play a critical role in Europe’s ability to meet its sustainability commitments
by reshaping how Europeans work, live and do business. As the most sustainable telecommunication
infrastructure technology, full fibre is a prerequisite to achieve the European Green Deal and make the
European Union’s economy more sustainable. Competitive investments in this technology should,
therefore, remain a high political priority and we look forward to working with the EU institutions,
national governments and NRAs towards removing barriers in a way to full-fibre Europe” said Vincent
Garnier, Director General of the FTTH Council Europe.
About the FTTH Council Europe:
The FTTH Council Europe is an industry organization with a mission to advance ubiquitous full fibre based connectivity to the whole of Europe. Our vision is that fiber connectivity will transform and
enhance the way we live, do business and interact, connecting everyone and everything,
everywhere.
Fiber is the future-proof, climate-friendly infrastructure which is a crucial prerequisite for
safeguarding Europe’s global competitiveness while playing a leading global role in sustainability.
The FTTH Council Europe consists of more than 150 member companies.
Contacts:
Eric Joyce, Chair, Market Intelligence Committee
[email protected]
Sergejs Mikaeljans. Communications and Public Affairs Officer
[email protected] Tel: +32 474 81 04 54
……………………………………………………………………………………………………………………
Separately, BT has increased its its total FTTP network build target from 20 million to 25 million premises by December 2026, with Openreach working to connect up to 4 million premises a year.
……………………………………………………………………………………………………………………..
References:
https://www.ftthcouncil.eu/documents/Fibre_Market_Panorama_2021_PR_final.pdf
https://register.gotowebinar.com/register/2424555495368131344 (webinar registration)
Verizon: Private 5G market at $8B in 4 years
Verizon distinguishes between a private wireless network product and mobile edge compute (MEC) offerings, he noted, but likes it when both come together. That’s when “the full power of 5G” can be exploited, he said, with features like low power usage and high device density. Verizon has ambitions for both public and private MEC, in partnerships with Microsoft and AWS.
Asked about moving beyond just providing connectivity and driving new revenue streams with private wireless, he pointed to recurring services such as security, managed services, and running custom applications or IoT.
“The private network piece, very few can do it as well as us, but it’s the layers of services on top that creates a pretty compelling revenue case for us,” Sowmyanarayan said. “But more importantly use-cases for the customer.”
He acknowledged that typically with large customers there’s also a significant upfront piece to get the private network up and running. The private network is essentially a scaled down version of the macro network consisting of core, radio, and other elements at a local location. But afterwards the recurring services are attractive for both Verizon and private wireless customers who can then keep attention on their main business functions.
“They are able to look to a large partner to offload some of the complex work so they can focus on what their core is,” Sowmyanarayan noted, pointing to mines as an example.
Verizon also has a private wireless offering for international customers, which uses Nokia network equipment. The carrier recently signed its first European 5G private wireless deal with Associated British Ports (ABP) for the Port of Southampton in the U.K. Sowmyanarayan said the carrier is very excited about the ABP deal and categorized it as “a sign for things to come” for Verizon.

In the 1st Quarter of 2021, Verizon posted a loss of 170,000 monthly wireless subscribers. Analysts had predicted 82,100 new customers. The top U.S. wireless carrier continues to see partnerships like its ones with Amazon.com Inc. and Corning Inc. as the best path to bring advanced 5G services from development to actual sales.
……………………………………………………………………………………………………………………………………..
References:
https://www.fiercewireless.com/private-wireless/verizon-chases-7-8b-private-wireless-market
https://www.fiercedigitaltechevents.com/private-wireless-networks-summit
IDC: Global Telecoms Market at $1.53T in 2020; Meager Growth Forecast
According to IDC’s Worldwide Semiannual Telecom Services Tracker. the worldwide market for telecoms and pay-TV services experienced a recovery during the second half of 2020, following the turbulent first half of the year as Covid-19 encouraged much greater on-line access and video binging.
Worldwide telecommunications services and pay TV services revenues totaled $1,53-trillion in 2020, representing flat year-over-year growth. Americas was the largest region, accounting for $583 billion in services revenues, 38% of the total market. Asia-Pacific telcos generated $482 billion from services (more than 31% of the total), while those in EMEA generated services sales valued at $471 billion (almost 31% of the total).
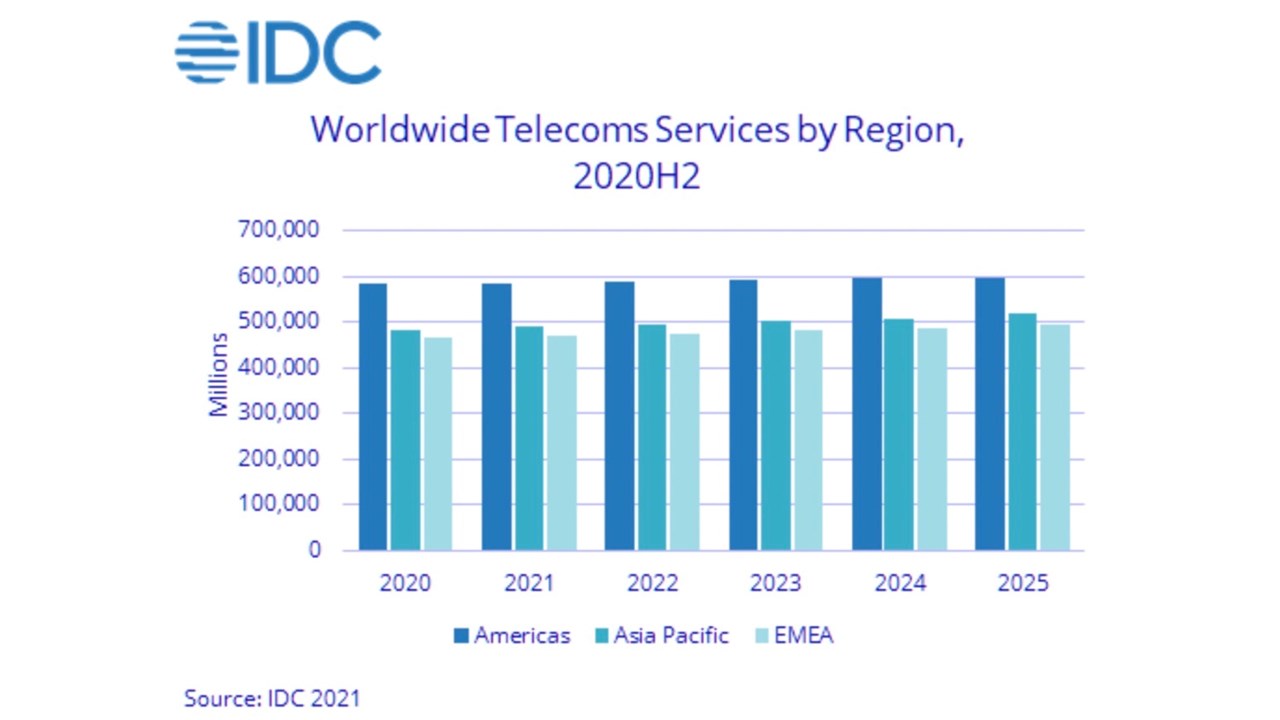
| Global Regional Services Revenue and Year-on-Year Growth (revenues in $B) | |||
| Global Region | 2020 Revenue | 2019 Revenue | 2020/2019
Growth |
| Americas | $583 | $579 | 0.7% |
| Asia/Pacific | $482 | $482 | 0.0% |
| EMEA | $467 | $471 | -0.8% |
| WW Total | $1,532 | $1,532 | 0.0% |
| Source: IDC Worldwide Semiannual Services Tracker – 2H 2020 | |||
Although the revenue outcome in 2020 was neutral, the pandemic drastically changed the trends that have shaped the global telco market for a long time. Consumer fixed data services have suddenly become the most important type of connectivity, enabling home-bound people to work and entertain. Business fixed data services have temporarily lost momentum due to the migration of traffic to the consumer segment, but most of these connections were preserved as they were protected by long-term contracts. Fixed voice services saw a slight increase in dropout rates because some companies within the small business segments went bankrupt and more residential clients gave up their connections for cost-cutting purposes. Mobile services spending also declined slightly due to slower renewal of contract agreements, reduction of out-of-bundle spending, and a sharp decrease in roaming revenues due to travel restrictions. In the Pay TV segment, the migration from traditional Pay TV to Over the Top (OTT) services accelerated during the COVID-19 crisis, driven by increased consumption of video content and new OTT service launches.
IDC expects worldwide telecom services spending to increase by a meager 0.7% in 2021 reaching a total of $1,54-trillion. Growth during each of the next four years will take the market over the $1.6 trillion mark by 2025.
Is that tiny growth in revenues (not profits) enough to give the network operators the confidence to invest suitably in their networks (especially 5G), autonomous systems, operations and processes?
Telecom TV’s Ray Lemaistre addresses that question in a blog post:
There are two ways to look at this, using ‘5G’ as the lens (which is a valid perspective given the industry focus in terms of stated service potential and investment focus).
The first is the ‘glass half full’ view, that service providers are managing to at least grow and that without the benefits of enhanced mobile and fixed broadband services they’d be shrinking and in trouble.
The second (glass half empty) perspective is that a very small level of annual growth in a global market that underpins the strategies of pretty every other vertical sector, enables high-value enterprise and consumer services and now has 5G as a new value creator following significant levels of investment (that are ongoing) should be generating much greater returns on investment and sales growth – if IDC is right, the market is little better than ‘flat’, which isn’t much to get excited about.
So is IDC being too pessimistic? Or realistic? Or even too positive about the service revenue trends of the telcos? The world is now revolving around digital services, yet the traditional suppliers of communications services don’t appear to be the ones that will financially benefit, no matter how much time, effort and money they pump into 5G.
IDC believes that connectivity will become an even more critical asset for households and businesses after the pandemic, as some of the habits adopted during the crisis (remote working, collaboration, online media consumption) are expected to become part of everyday life. The migration toward FttP access is expected to accelerate in most of the country markets, while the business fixed data market will recover in the longer term as the economic recovery drives increased investments in the cloudification of enterprise business activities. Revenue growth in the mobile services space will be buoyed to a degree by 5G adoption, which will invite users to deploy more advanced data capabilities and uptake the content and services dependent on high-speed data connectivity.
The global telco market was put to a serious test in 2020 and it successfully passed. IDC believes that the lessons learned last year will help the industry to secure stable growth in the coming period. “The COVID-19 pandemic demonstrates the resilience and value of the telecoms industry,” said Chris Barnard, vice president, European Infrastructure and Telecoms. “New ways of working will persist beyond the pandemic, shaping future revenue opportunities, while the network-centricity of consumers will drive bandwidth requirements in that segment as well.”
About IDC Trackers
IDC Tracker products provide accurate and timely market size, vendor share, and forecasts for hundreds of technology markets from more than 100 countries around the globe. Using proprietary tools and research processes, IDC’s Trackers are updated on a semiannual, quarterly, and monthly basis. Tracker results are delivered to clients in user-friendly Excel deliverables and on-line query tools.
For more information about IDC’s Worldwide Semiannual Telecom Services Tracker, please contact Kathy Nagamine at 650-350-6423 or [email protected].
……………………………………………………………………………………………………………………………………
References:
https://www.idc.com/getdoc.jsp?containerId=prUS47671521
US Cellular touts 5G millimeter wave and cell tower agreement with Dish Network
US Cellular is investing in network modernization, 5G, and spectrum assets. Laurent Therivel (LT), the company’s President & Chief Executive Officer said during their 1st Quarter 2021 earnings call that US Cellular is focusing on low band and millimeter wave spectrum for 5G. Their initial deployment is in clean, low band spectrum. “US Cellular 5G is available to some degree in 18 states today,” LT said.
The company is satisfied with their C band spectrum purchases, especially when combined with their CBRS holdings. Mid-band spectrum is available in nearly all of US Cellular’s “operating footprint.”
Millimeter wave spectrum has been deployed to offer fixed wireless access in three test markets pilot launch in those markets is expected to occur in the third quarter of this year. LT expanded on millimeter wave:
“We need to be optimistic on the performance capabilities of millimeter wave spectrum. We recently performed additional millimeter wave spectrum testing the base station and radio enhancement we achieved a line of sight propagation distance of the 7 kilometers with average speeds, approaching 1 gigabit per second this exceeds our results from last year where we achieved this the 5 kilometers of average speed with 100 megabits per second.”
Strategic partnerships were said to be an area of opportunity to better leverage the value of US Cellular assets. In April, US Cellular signed a Tower MLA (master lease agreement) with Dish Network. The company expects “this agreement to contribute to our tower revenue growth beginning in 2022.” However, any details on the deal have to remain confidential, LT said. US Cellular recently hired Austin Summerford to oversee its cell towers strategy.
US Cellular CFO Douglas Chambers highlighted the importance of the Towers MLA with Dish Network:
“The control of our towers remains very important. By owning our towers we ensure we maintain the operational flexibility to add new equipment to make other changes to our cell sites without incurring additional costs which is very important, particularly given our current technology evolution. As you can see on the slide with the assistance of our third -party marketing agreement, we have seen steady growth in tower rental revenues. As I mentioned first quarter tower rental revenues increased by 9% year-over-year. As LT noted earlier, new master lease agreement we signed with DISH Wireless and we will continue to focus on growing revenues from these strategic assets.”
In answer to a Morgan Stanley analyst question about growth drivers, LT again alluded to the towers deal with Dish (grammar corrections):
‘The best thing we did is, we said look, we’ve got assets in those towers in the form of generators, shelters and backhaul and we’re willing to share that with our partners if the economics makes sense. We’ve taken those actions. I think the DISH deal is the first example of those actions bearing fruit, and I expect to see more. So, I hope that gives you some flavor about how we’re doing from a growth perspective. I’m encouraged — I expect to see those efforts continue to bear fruit; certainly throughout the rest of this year and particularly going into next.”
“We still see significant unrecognized market value in the [US Cellular] towers,” stated financial analysts at Raymond James in a May 10th note to clients. US Cellular owned 4,270 towers at the end of the 1st quarter of 2021. Analyst Ric Prentiss wrote that Raymond James does not expect an outright sale of US Cellular towers, which is a question that has come up repeatedly in the past. Operationally, the company’s 4,300 tower portfolio produced $20.3 million in third-party revenue in the 1st quarter of 2021.
“Importantly, USM announced it has had signed a Master Lease Agreement (MLA) with Dish in April, and as Dish ramps the deployment of its greenfield nationwide 5G network in 2H21/2022, USM should see some upside. Moreover, USM under new (as of July 2020) CEO Laurent Therivel (LT) has focused on ‘sweating’ the tower assets, including more aggressive marketing, faster application cycle times, and sharing backhaul/generators/shelters at tower sites with tenants,” Prentiss stated.
US Cellular is somewhat unique in the U.S. wireless industry because it owns thousands of cell towers. Most wireless network operators like Verizon and AT&T have sold off most of their towers and now primarily rent space on towers owned by other companies like Crown Castle.
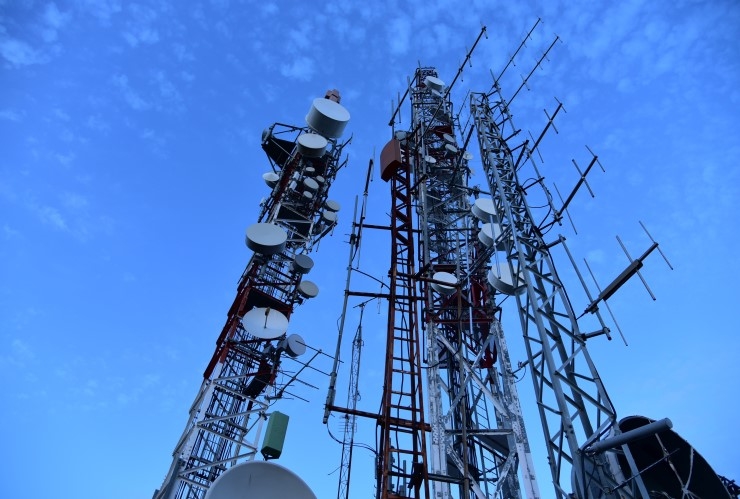
Image credit: Pixabay
…………………………………………………………………………………………………………………………………………
US Cellular reported total operating revenues of around $1 billion, up from the $963 million it reported in the same quarter a year ago. US Cellular ended the period with roughly 5 million total wireless subscribers, which was a subscriber net loss of 6,000. Smartphone connections increased by 15,000 during the quarter and by 56,000 over the course of the past 12 months. There were lower additions of Internet products such as hotspots and routers compared to the prior year when there was an increase in demand due to COVID 19.
…………………………………………………………………………………………………………………………………………..
Dish Network and Cell Towers:
To comply with Dish Network’s 2019 agreement with the U.S. Department of Justice, Dish is to cover 20% of the U.S. population by June 2022 with 5G, and 70% by June 2023. It will need to do so via thousands of cell towers across the country. Dish has already signed agreements with a wide variety of cell tower companies, including Crown Castle, American Tower, Vertical Bridge among others.
New Street Research analysts wrote in a note to clients this week:
“Between cash on hand and ongoing cash generation, the company has all the resources it needs to fund the early stages of the network buildout. The company will need to raise more capital to fully fund the build, but they will likely do that after proving out their technology platform and its commercialization, starting with its [5G] deployment in Las Vegas later this year.”
The majority of cell towers in the U.S. are owned by three cell tower companies:
- American Tower 40,586
- Crown Castle 40,567
- SBA Communications 16,401
………………………………………………………………………………………………………………………………………
References:
https://www.lightreading.com/5g/dish-teams-with-uscellular-for-5g-towers/d/d-id/769381?
https://www.fiercewireless.com/operators/uscellular-touts-tower-deal-dish
IDC forecasts $522B semiconductor market in 2021; robust growth in 5G; Samsung #1
Worldwide semiconductor revenue grew to $464 billion in 2020, an increase of 10.8% compared to 2019, according to the Semiconductor Applications Forecaster (SAF) from International Data Corporation (IDC). IDC forecasts the semiconductor market will reach $522 billion in 2021, a 12.5% year-over-year growth rate. IDC anticipates continued robust growth in consumer, computing, 5G, and automotive semiconductors.
Supply constraints will continue through 2021. While shortages initially occurred in automotive semiconductors, the impact is being felt across the board in semiconductors manufactured at older technology nodes. Much like a traffic jam and the ripple effect, a disruption on the semiconductor supply chain operating close to capacity will impact across the supply chain. The industry will continue to struggle to rebalance across different industry segments, while investment in capacity now will improve the industry’s resiliency in a few years. Looking forward to 2021, IDC sees continued strong growth in semiconductor sales worldwide as adoption of cloud technologies and demand for data and services remain unchanged. Global fiscal and monetary policy remain accommodative and will provide a tailwind for continued capital investments in long term infrastructure.
The market for semiconductors in Computing systems, such as PCs and servers, outpaced the overall semiconductor market, growing 17.3% year over year to $160 billion in 2020. “Demand for PC processors remains strong, especially in value-oriented segments,” said Shane Rau, research vice president, Computing Semiconductors. “The PC processors market looks strong through the first half and likely the whole year.” IDC forecasts Computing systems revenues will grow 7.7% to $173 billion in 2021.
Growth in Mobile Phone semiconductors was resilient in 2020. “Mobile phone shipments fell by more than ten percent in 2020, but mobile phone semiconductor revenues grew by 9.1% due to a shift to higher priced 5G semiconductors, more memory per phone, sensors, and RF support for more spectrum bands,” said Phil Solis, research director for Connectivity and Smartphone Semiconductors.
“2021 will be an especially important year for semiconductor vendors as 5G phones capture 34% of all mobile phone shipments while semiconductors for 5G phones will capture nearly two thirds of the revenue in the segment.” IDC forecasts mobile phone semiconductor revenues will grow by 23.3% in 2021 to $147 billion.
The Consumer semiconductor market segment rebounded in 2020. Robust sales of game consoles, tablets, wireless headphones and earbuds, smart watches, and OTT streaming media devices fueled segment growth by 7.7% year over year to $60 billion. “Apple, AMD, and Intel showed exceptional growth as consumers upgraded their digital spaces at home,” said Rudy Torrijos, research manager, Consumer Semiconductors. “New gaming consoles from Microsoft and Sony, continued strong sales of wearables from Apple, and the rise in smart home networks managed by Amazon Alexa and Google Assistant will accelerate growth in 2021 to 8.9% year over year.”
“Automotive sales recovered in the second half of 2020, but the supply constraints for the automotive semiconductor market for some products will last through 2021 as fires and fab shutdowns further impacted the automotive semiconductor market and it takes time for chips to move through the automotive ecosystem, specifically in the U.S. and Europe,” said Nina Turner, research manager, Automotive Semiconductors. For 2021, IDC forecasts that automotive semiconductor revenue will grow 13.6%.
“Overall, the semiconductor industry remains on track to deliver another strong year of growth as the super cycle that began at the end of 2019 strengthens this year,” said Mario Morales, program vice president, Semiconductors at IDC. “The markets remain narrowly focused on shortages across specific sectors of the supply chain, but what is more important to emphasize is how critical semiconductors are to every major system category and content growth that remains unabated.”
The IDC Worldwide Semiconductor Applications Forecaster (SAF) database serves as the basis for IDC’s semiconductor supply-side research, including our market forecasts and custom market models. This database contains revenue data collected from over 150 of the top semiconductor companies for 2015-2020 and forecasts for 2021-2025. Revenue for over twenty semiconductor device areas, five geographic regions, seven industry segments, and more than 65 end-device applications are included in the database and pivot tables.
For more information about the SAF, please contact Nina Turner at [email protected]
……………………………………………………………………………………………………………………………….
Separately, IC Insights believes that Samsung will again replace Intel as the leading semiconductor producer beginning in the second quarter of this year.
Intel was the world’s top semiconductor manufacturer from 1993 through 2016. However, after nearly a quarter of a century, the semiconductor industry saw a new number-one supplier beginning in 2017 when the memory market surged and Samsung displaced Intel. This unseating marked a milestone achievement not only for Samsung, but also for all other competing semiconductor producers who had tried for years to supplant Intel as the world’s largest supplier, according to IC Insights.
Samsung held the leading semiconductor supplier spot for six quarters before the memory market collapsed in late 2018 and Intel once again became the leading IC supplier in the fourth quarter of 2018, IC Insights indicated. The memory market plunge was so steep in late 2018 and early 2019 that Samsung went from having 17% more revenue than Intel in third-quarter 2018 to having 18% less sales than Intel just two quarters later. Intel endured its own sales slump in the first quarter of 2019, although it was nowhere near the decline exhibited by the memory producers.
With the DRAM market on the rise and the NAND flash market forecast to gain momentum in the second half of the year, it appears likely that Samsung will once again position itself at the number-one semiconductor supplier for the full year 2021, IC Insights said.

References:
https://www.digitimes.com/news/a20210505PR201.html
FCC permits Verizon to test 5G and carrier aggregation in CBRS spectrum band
The Federal Communications Committee (FCC) has given Verizon Wireless permission to conduct a series of tests in the 3.55 to 3.7GHz CBRS spectrum band using three radio stations in Minneapolis, Minnesota. Verizon said the tests will involve 5G and carrier aggregation technology. The FCC grant reads as follows:
Verizon Wireless is working with 5G base station and mobile device equipment vendors to
conduct product testing of 3.5 GHz in outdoor locations listed below.
Station Locations:
1. Minneapolis (HENNEPIN), MN – NL 44-48-26; WL 93-22-29; MOBILE: within 0.75 km
radius of center point location, within 0.75 km, centered around NL 44-48-26;
2. Minneapolis (HENNEPIN), MN – NL 44-48-24; WL 93-22-29; MOBILE: within 0.75 km
radius of center point location, within 0.75 km, centered around NL 44-48-24;
3. Minneapolis (HENNEPIN), MN – NL 44-48-24; WL 93-22-29; MOBILE: within 0.75 km
radius of center point location, within 0.75 km, centered around NL 44-48-24.
“Verizon and partners plan to conduct the proposed 5G tests using pre-commercial equipment in prototype form,” Verizon said in its FCC application. The operator did not name the device or network equipment partners it will be working with for the tests.
PCMag reported that Verizon has only been using CBRS spectrum only for 4G – LTE. In Jackson Heights (Queens, NY), the CBRS-enhanced 4G clocked 456Mbps, while 5G DSS at the same times and similar locations hit 232Mbps. The PCMag author previously observed Verizon’s 5G Ultra Wideband at about3.2Gbps.
Therefore, the move to 5G over CBRS is significant. Verizon added that it plans to evaluate “intra-band and inter-band carrier aggregation between 3.5GHz and licensed (and/or unlicensed) bands,” including its licensed 700MHz, PCS and AWS bands. [Carrier aggregation technology can be used to bond together transmissions across different spectrum bands, thus dramatically increasing users’ connection speeds.]
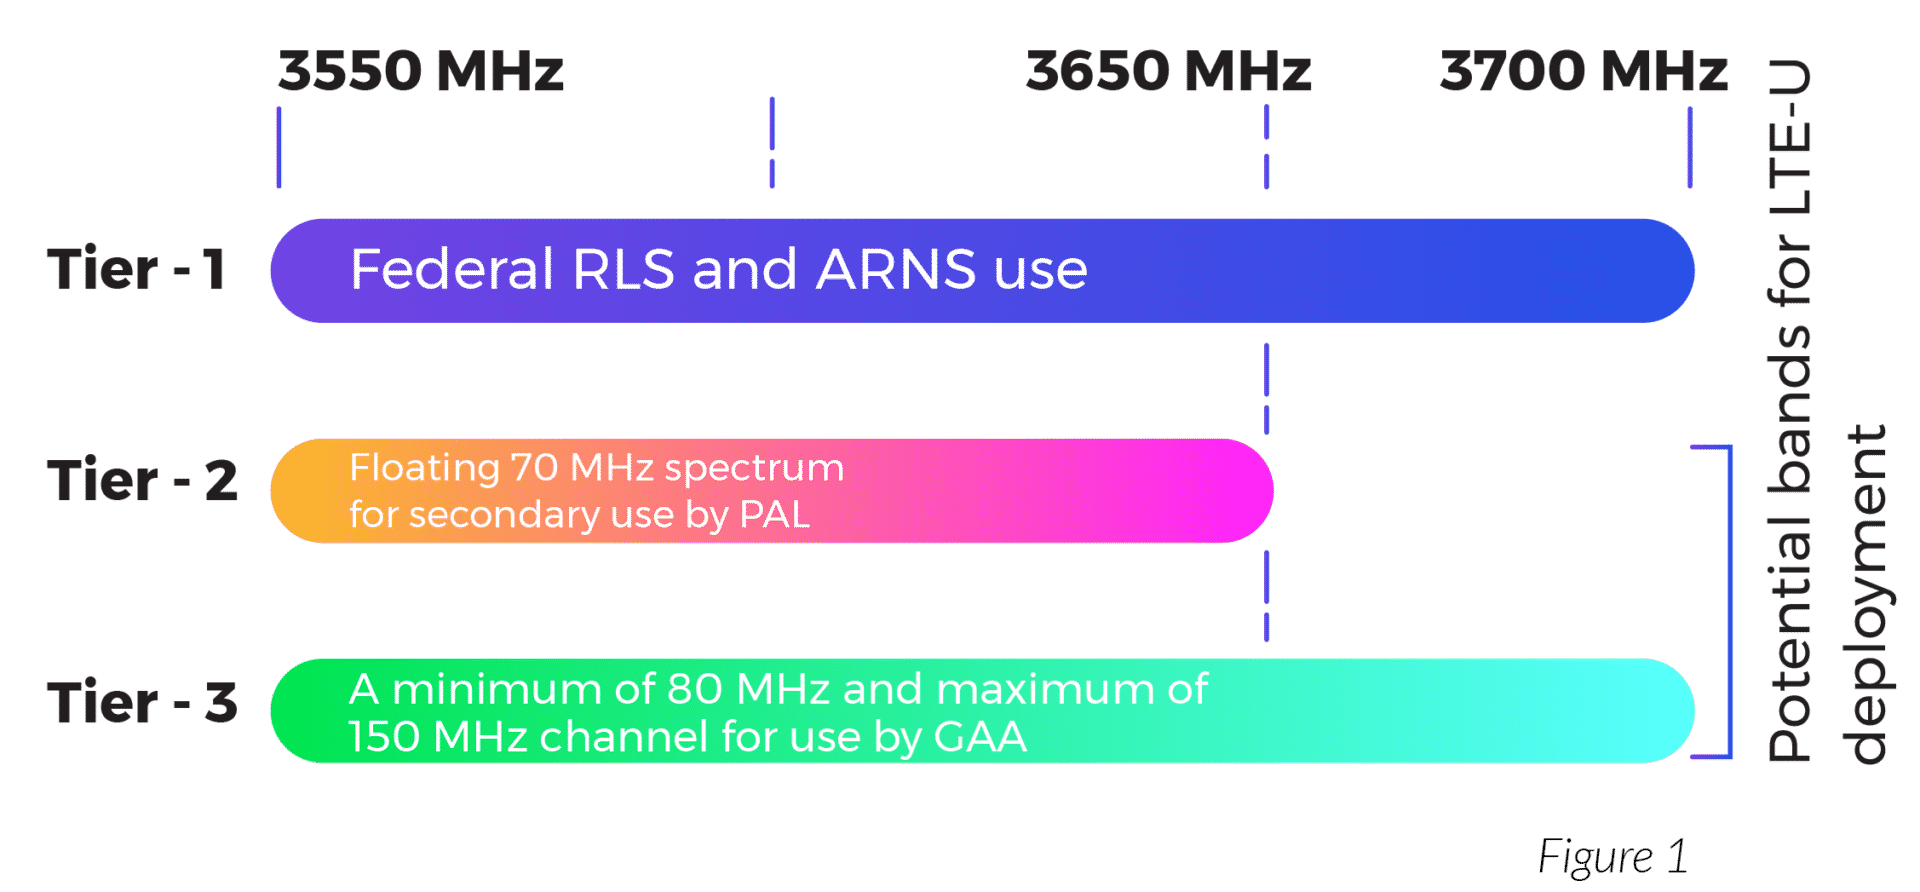
Light Reading’s Mike Dano says that Verizon has been adding support for the 3.5GHz CBRS spectrum band to its network for years. And last year Verizon spent $1.9 billion to purchase CBRS spectrum licenses across the country in an FCC auction.
Verizon’s tests roughly coincide with the operator’s three-year, $10 billion program to put its C-band spectrum licenses into use. Verizon succeeded in more than doubling its existing mid-band spectrum holdings by adding an average of 161 MHz of C-Band nationwide paying $52.9 billion including incentive payments and clearing costs.
References:
https://apps.fcc.gov/oetcf/els/reports/GetApplicationInfo.cfm?id_file_num=0461-EX-ST-2021
https://apps.fcc.gov/oetcf/els/reports/STA_Print.cfm?mode=current&application_seq=106415
https://apps.fcc.gov/els/GetAtt.html?id=273078&x=.
https://www.fiercewireless.com/operators/verizon-boosts-lte-speeds-philly-via-cbrs-spectrum
https://www.verizon.com/about/news/verizon-announces-c-band-auction-results


