

Broadband Status
Dell’Oro: Broadband network equipment spending to drop again in 2024 to ~$16.5 B
Executive Summary:
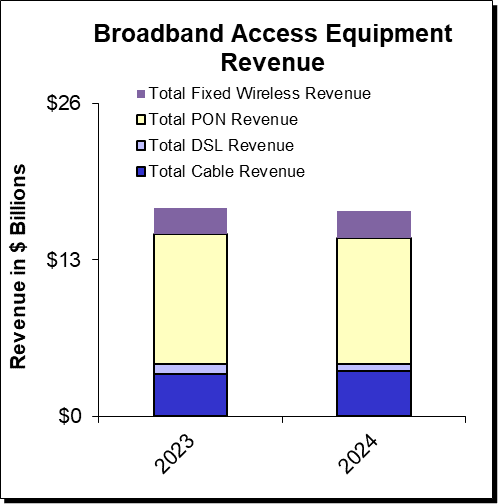
Operator spending on broadband network equipment will remain sluggish well into 2024, forecasts Dell’Oro’s Jeff Heynen. “Inventory Correction, Inventory Realignment,” or whatever term you prefer to call the root cause of 2023’s broadband spending slowdown will likely persist well into 2024, he wrote. Without the benefit of fourth quarter numbers, total spending on broadband equipment in 2023 is expected to show a decline of around 10%. Early projections for 2024 indicate an additional 5% year-over-year decrease, as the lagging impact of interest rate increases to curb inflation will be felt more acutely. This additional 5% decrease would put total spending to around $16.5 B—roughly equal to 2021 spending levels.
The expected declines in 2023 and 2024 follow three straight years of white-hot growth in broadband network and service investments from 2020 to 2022. During this period, year-over-year growth rates reached 9%, 15%, and 17%, respectively. Similar periods of growth from 2003-2006 and 2010-2014 were both followed by two subsequent years of reduced spending, as operators—particularly in China—shifted their capital expenditure focus from broadband to mobile RAN.
However, there are signs of a return to growth in 2025 as money from BEAD and other broadband subsidy programs trickle down to broadband equipment suppliers. Well before that, pockets of growth in fixed wireless CPE, cable DAA equipment and CPE, and continued spending on PON equipment by tier 2 and tier 3 operators should make the broadband market one in which the headlines might communicate malaise, but a peek under the hood shows clear signs of resilience powering an inevitable return to growth.
Cable Operators Travel Different Paths to Fend off Fixed Wireless and Fiber:
Just like last year, in the minds of cable consumers, cable operators find themselves stuck battling against the perception that they are the provider with inferior copper technology that can’t be flexible when it comes to offering plans that meet a consumer’s budget, like fixed wireless currently can. As a result of this situation, larger cable operators are seeing increased broadband subscriber churn and quarters of net subscriber losses.
Comcast is pushing hard to counter those perceptions and is already offering its X-Class Internet tiers, which offer symmetrical speeds of 2 Gbps in Atlanta, Colorado Springs, and Philadelphia. Additional cities are expected to roll out these service tiers in 2024. Comcast’s use of full-duplex DOCSIS 4.0 (FDX), including brand new CPE using Broadcom’s D4.0 silicon in a two-box configuration. Later this year, we expect to see a combined gateway that also incorporates Wi-Fi 7, as Comcast looks to battle back against FTTH providers by providing the most advanced residential gateway to customers.
Meanwhile, in 2024, Charter’s Remote PHY and vCMTS rollouts will kick into high gear. (At the time of this publication, we are awaiting fourth quarter earnings from both Harmonic and Vecima, the announced RPD partners for Charter’s buildout to determine how much equipment the operator purchased in advance of this significant deployment.) For Charter, which is employing Extended Spectrum DOCSIS 4.0, 2024 will also bring much wider availability of 1.8 GHz amplifiers and taps, as well as a choice of CPE with dedicated silicon for ESD, as well as silicon that combines both FDX and ESD variants.
Charter will likely also announce additional vendors for its upgrade efforts, as the operator has been public about its desire for a multi-vendor environment.
Cox will also begin rolling out 1.8 GHz amplifiers this year but, like Charter, will likely run those at 1.2 GHz until taps and CPE become more widely available.
Meanwhile, for those operators that weren’t part of the initial DOCSIS 4.0 Joint Development Agreement (JDA) with Broadcom (and for some of those who were), DOCSIS 3.1 Plus is quickly becoming an important stopgap measure to help increase throughput within the existing DOCSIS 3.1 framework by leveraging additional OFDM channels. Operators can either use existing integrated CCAP chassis (with either legacy line cards supporting 3 OFDM blocks or newer cards supporting 4 OFDM blocks) or vCMTS platforms. This can be combined with either DOCSIS 4.0 modems or modems designed specifically for D3.1 Plus deployments, which won’t require the additional gain amplifier (and cost) needed for full DOCSIS 4.0.
While it remains to be seen which type of CPE operators deploying DOCSIS 3.1 Plus will move forward with, the fact that there is significant interest in the technology means that there will now be additional operators who will likely move on from DOCSIS 4.0 and instead buy themselves time with DOCSIS 3.1 Plus before moving forward with fiber overbuilds. The biggest question here is just how many operators will do so.
As Light Reading previously reported, Broadcom and MaxLinear are working on new D3.1 chipsets that can beef up downstream capacity and speed through the support of additional OFDM (orthogonal frequency-division multiplexing) channels. Some operators are likewise exploring the deployment of new D4.0 modems on their D3.1 networks to achieve similar capacity gains.
That approach could extend the life of DOCSIS 3.1 networks, delay D4.0 upgrades or become an interim step before a future leap to fiber-to-the-premises. But it’s still not clear how many operators will pursue this path.
Heynen expects to see additional FTTH deployments—both greenfield and overbuild—by cable operators around the world. Whether using Remote OLT platforms or more traditional OLT platforms, cable operators will take advantage of work being done at CabeLabs to standardize the integration of ITU-T PON recommendations into existing DOCSIS management frameworks. This will make it far easier for MSOs (aka Cablecos) to deploy XGS-PON, as well as 25GS-PON and, potentially 50G- and 100G-PON.
XGS-PON to Dominate Fiber Spend This Year:
The PON equipment market will be the most dynamic this year, with tier 1 operators besides of BT OpenReach and Deutsche Telekom, all continuing to better align their inventories with anticipated subscriber growth, as well as reduced homes passed goals. For larger tier 1s, the short-term reduction in homes passed goals will ultimately give way to a renewed construction phase beginning in 2025 that should propel the overall PON market through the end of the decade.
But while the tier 1s slow, there will be no slowing the continued efforts by tier 2 and tier 3 operators in both North America and Europe to both upgrade and expand their fiber networks. In fact, the same dynamic that played out in North America in 2023 will likely repeat in 2024, as tier 2, tier 3, utilities, municipalities, and co-ops all continue their buildouts.
The technology beneficiary will be XGS-PON, which already surpassed 2.5 Gbps GPON revenue back in 2022, but will more than double it in 2024. And in markets where operators are beginning to see cable operators deliver symmetric 2 Gbps services, there is a strong chance they will also sprinkle in some 25GS-PON to comfortably deliver symmetric 5-10 Gbps services.
Meanwhile in China, which is expected to show a marked decline in new OLT port shipments in 2023, will likely see another decline until 50G-PON rollouts begin in earnest later this decade. On the flip side, ONT unit shipments in China are expected to increase as FTTR (Fiber to the Room) deployments expand, delivering 2-3 ONTs per home as opposed to the traditional architecture of using a single ONT to terminate fiber.
Wi-Fi 7 Progress Will Accelerate:
With the Wi-Fi Alliance recently announcing the opening of certification testing for Wi-Fi 7 products, don’t be surprised to see dozens of Wi-Fi 7 residential routers and broadband CPE models being deployed by operators by the end of this year. Early gateway models, though pricey, have already been introduced to the market and will become much more widely available this Spring, and then well before the Holiday season. As of our July 2023 forecast, we expect over 2.5 million residential Wi-Fi routers and broadband gateways to ship in 2024, though we are undoubtedly increasing this forecast based on the certification testing opening up.
Operators can’t wait to deploy Wi-Fi 7 products to help differentiate themselves in increasingly crowded broadband markets and to eliminate much of the confusion in the market with the coexistence of Wi-Fi 6 and Wi-Fi 6E.
References:
2024 Outlook: Broadband Market Faces Challenge Amidst Lower Spending from 2023
https://www.lightreading.com/broadband/broadband-equipment-spending-to-dip-again-in-2024-dell-oro
Dell’Oro: Broadband Equipment Spending to exceed $120B from 2022 to 2027
MTN Consulting: Top Telco Network Infrastructure (equipment) vendors + revenue growth changes favor cloud service providers
Dell’Oro: U.S. suppliers ~20% of global telecom equipment market; struggling in RAN business
Dell’Oro: Worldwide Telecom Equipment Market Growth +3% in 2022; MTN: +2% Network Infrastructure Growth in 2022
Dell’Oro: XGS, 25G, and Early 50G PON Rollouts to Fuel Broadband Spending
ZTE sees demand for fixed broadband and smart home solutions while 5G lags
According to a senior executive, ZTE Corp has seen “tremendous” opportunities due to the increased demand for high-speed internet and smart home solutions globally following the COVID-19 pandemic. That’s despite a slower-than-expected development of 5G outside of China.
“Deployment of 5G technology in overseas markets has been slower than what we previously thought and investments in the field have also lagged behind,” said Chen Zhiping, vice-president of ZTE Corp.
“However, we have seen rapid growth of two sectors in our business – fixed broadband and home network solutions – internationally, especially in the Latin American market.”

The COVID-19 pandemic has pushed up demand for these two types of businesses, as people who were confined to their homes became more reliant on high-speed internet connections and home automation, she said.
“We are actively promoting these two areas of business in Latin America. Besides, the Asia-Pacific region is also where we put great focus on, such as Indonesia, Malaysia and Thailand, as the region has a huge demand for network convergence, network modernization and digitalization,” Chen said.
The Asia-Pacific region is a market from which the company generates most of its overseas revenue, she added.
ZTE posted 60.7 billion yuan ($8.36 billion) in operating revenue in the first half of the year, up 1.5 percent from the year-ago period, according to its interim results announced on Aug 18. Of the total, 17.6 billion yuan, or 29 percent, came from international markets.
Net profit grew 19.9 percent on a yearly basis to 5.47 billion yuan.
“Exploring the domestic market is far from enough for a technology company, whether it is research and development or marketing. We have been committed to the international markets and promoting the globalization of research and development, supply chain and collaboration all along,” she said.
Chen acknowledged that factors such as geopolitical tensions, economic slowdown and a deteriorating business environment in some countries have posed serious challenges to ZTE‘s operations in overseas markets. She stressed that the company had established a sound system of management as well as risk identification and control to deal with potential risks.
On November 225, 2022, the Federal Communications Commission (FCC) voted unanimously to ban U.S. sales of new Chinese telecommunications equipment and devices produced by Huawei and ZTE—as well as to restrict the use of other Chinese-made video surveillance equipment—over national security concerns. The Chinese companies have denied the allegations.
According to a report by German market intelligence platform Statista, the global ICT market is expected to reach $6 trillion in 2023, up from $5.5 trillion last year. China would rank third in global market share with over 11%, following the United States and European Union (EU).
References:
https://www.chinadaily.com.cn/a/202309/02/WS64f26e23a310d2dce4bb384f.html
Vodafone Idea (Vi) to launch 5G services “soon;” Awards optical network equipment contract to ZTE
FCC bans Huawei, ZTE, China based connected camera and 2-way radio makers
Leichtman Research Group: U.S. added 840,000 broadband subs in 2Q-2023
Leichtman Research Group, Inc. (LRG) found that the largest cable and wireline phone providers and fixed wireless services in the U.S. – representing about 96% of the market – acquired about 840,000 net additional broadband Internet subscribers in 2Q 2023, compared to a pro forma gain of about 700,000 subscribers in 2Q 2022.
These top broadband providers now account for over 112.9 million subscribers, with top cable companies having about 76.2 million broadband subscribers, top wireline phone companies having about 30.7 million subscribers, and top fixed wireless services having about 5.9 million subscribers.
Findings for the quarter include:
- Overall, broadband additions in 2Q 2023 were 120% of those in 2Q 2022
- The top cable companies added about 10,000 subscribers in 2Q 2023 – compared to a loss of about 60,000 in 2Q 2022
- The top wireline phone companies lost about 60,000 total broadband subscribers in 2Q 2023 – similar to about 60,000 net losses in 2Q 2022
- Wireline Telcos had about 450,000 net adds via fiber in 2Q 2023, and about 510,000 non-fiber net losses
- Fixed wireless/5G home Internet services from T-Mobile and Verizon added about 890,000 subscribers in 2Q 2023 – compared to 815,000 net adds in 2Q 2022
“Top broadband providers added about 840,000 subscribers in 2Q 2023, led by another strong quarter from fixed wireless,” said Bruce Leichtman, president and principal analyst for Leichtman Research Group, Inc. “Fixed wireless services have acquired over 800,000 net adds in each of the past five quarters, accounting for about 4.45 million net adds in that period.”
| Broadband Providers | Subscribers at end of 2Q 2023 | Net Adds in 2Q 2023 |
| Cable Companies | ||
| Comcast | 32,305,000 | (19,000) |
| Charter | 30,586,000 | 77,000 |
| Altice | 4,576,100 | (36,600) |
| Cable One | 1,057,900 | (5,100) |
| Breezeline* | 680,785 | (6,734) |
| Other major private companies** | 7,035,000 | 0 |
| Total Top Cable | 76,240,785 | 9,566 |
| Wireline Phone Companies | ||
| AT&T | 15,304,000 | (41,000) |
| Verizon | 7,562,000 | 34,000 |
| Lumen | 2,909,000 | (72,000) |
| Frontier | 2,865,000 | 2,000 |
| Windstream^ | 1,175,000 | 0 |
| TDS | 523,600 | 8,200 |
| Consolidated | 376,829 | 6,967 |
| Total Top Wireline Phone | 30,715,429 | (61,833) |
| Fixed Wireless Services | ||
| T-Mobile | 3,678,000 | 509,000 |
| Verizon* | 2,260,000 | 384,000 |
| Total Top Fixed Wireless | 5,938,000 | 893,000 |
| Total Top Broadband | 112,894,214 | 840,733 |
Leichtman Research Group, Inc. (LRG) specializes in research and analysis on broadband, media and entertainment industries. LRG combines ongoing consumer surveys with industry tracking and analysis, to provide companies with a richer understanding of current market conditions, and the potential impact and adoption of new products and services. For more information about LRG, please call (603) 397-5400 or visit www.LeichtmanResearch.com.
Leichtman Research Group: Fixed Wireless Services Accounted for 90% of the Broadband Net Adds in 2022!
AT&T, Verizon and Comcast all lost fixed broadband subscribers in 2Q-2023
ABI Research joins the chorus: 5G FWA is a competitive alternative to wired broadband access
Leichtman Research Group: U.S. broadband growth returns to pre-pandemic levels in Q3-2021
Dell’Oro: Broadband Equipment Spending to exceed $120B from 2022 to 2027
Dell’Oro Group predicts the broadband equipment market will surpass $120 billion in cumulative spending between 2022 and 2027. The market research firm says sales of PON equipment for fiber-to-the-home deployments, cable broadband access equipment, and fixed wireless CPE will show a 0.2% Compounded Annual Growth Rate (CAGR) from 2022 to 2027. Service providers continue to expand their fiber and DOCSIS 3.1/4.0 networks, while also increasing the reliability and sustainability of their broadband access networks.
“After three consecutive years of tremendous broadband network expansions and upgrades, 2023 is expected to show a return to normalized levels of spending,” said Jeff Heynen, Vice President of Broadband Access and Home Networking research at Dell’Oro Group. “After 2023, spending is expected to increase through 2026 and 2027, driven by 25 Gbps and 50 Gbps PON, Fixed Wireless CPE, as well as DAA and DOCSIS 4.0 deployments.”
Labor markets are “still being challenged” and a number of fiber based network operators (AT&T, Altice USA, Frontier) have reduced their expansion plans and homes passed targets. “To close out 2022 we did see a significant uptake in equipment purchases, and what happened there was supply chains appeased. A lot of orders that had been on the books for a long time have been fulfilled.”
Network equipment vendors are working through that inventory they had built up while taking on “additional equipment purchases.
Additional highlights from the Broadband Access & Home Networking 5-Year July 2023 Forecast Report:
- PON equipment revenue is expected to grow from $11.8 B in 2022 to $13.3 B in 2027, driven largely by XGS-PON deployments in North America, EMEA, and CALA.
- Revenue for Cable Distributed Access Equipment (Virtual CCAP, Remote PHY Devices, Remote MACPHY Devices, and Remote OLTs) is expected to reach $1.6 B by 2027, as operators ramp their DOCSIS 4.0 and fiber deployments.
- Revenue for Fixed Wireless CPE is expected to reach $2.7 B by 2027, led by shipments of 5G sub-6GHz and 5G Millimeter Wave units.
- Revenue for Residential Wi-Fi Routers will surpass $5.2 B in 2027, owing to massive shipments of Wi-Fi 7 units.
“Which isn’t going to float to manufacturers until you know, late 2024, really into 2025,” he said. “I think in the interim, XGS-PON in the European market is certainly going to catch up. We’re also seeing considerable growth in XGS-PON deployments now in China.”
In Dell’Oro’s five-year forecast published in January, Heynen expected fixed wireless subscriber growth, particularly in North America, would “start to moderate” beginning in 2024, due to factors like “capacity issues and fiber expansion.”
Heynen has increased his revenue predictions for the fixed wireless CPE market – which he previously tipped would hit $2.2 billion in five years – and now predicts subscriber growth to continue into 2025.
“Part of that is because of the net reduction in homes passed for fiber,” he said. “In the meantime, fixed wireless will be able to cover more ground while the operators who are building out fiber kind of extend their overall deployment plans.”
Further, operators like T-Mobile and Verizon “are seeing fixed wireless as a way to secure broadband subscribers away from cable operators. The U.S. market is really dynamic in terms of how services can be marketed.”
The Dell’Oro Group Broadband Access & Home Networking 5-Year Forecast Report provides a complete overview of the Broadband Access market with tables covering manufacturers’ revenue, average selling prices, and port/unit shipments for PON, Cable, Fixed Wireless, and DSL equipment. Covered equipment includes Converged Cable Access Platforms (CCAP), Distributed Access Architectures (DAA), DSL Access Multiplexers (DSLAMs), PON Optical Line Terminals (OLTs), Customer Premises Equipment ([CPE] for Cable, DSL, PON, Fixed Wireless), along with Residential WLAN Equipment, including Wi-Fi 6E and Wi-Fi 7 Gateways and Routers. For more information about the report, please contact [email protected].
Dell’Oro Group is a market research firm that specializes in strategic competitive analysis in the telecommunications, security, enterprise networks, data center infrastructure markets. Our firm provides in-depth quantitative data and qualitative analysis to facilitate critical, fact-based business decisions. For more information, contact Dell’Oro Group at +1.650.622.9400 or visit www.delloro.com.
References:
https://www.fiercetelecom.com/telecom/broadband-equipment-market-eclipse-120b-2027-delloro
Dell’Oro: XGS, 25G, and Early 50G PON Rollouts to Fuel Broadband Spending
Dell’Oro: Bright Future for Campus Network As A Service (NaaS) and Public Cloud Managed LAN
Dell’Oro: FWA revenues on track to advance 35% in 2022 led by North America
Dell’Oro: PONs boost Broadband Access; Total Telecom & Enterprise Network Equipment Markets
Dell’Oro: U.S. suppliers ~20% of global telecom equipment market; struggling in RAN business
Futuriom and Dell’Oro weigh in on SD-WAN and SASE market: single vendor solutions prevail
Point Topic Comprehensive Report: Global Fixed Broadband Connections at 1.377B as of Q1-2023
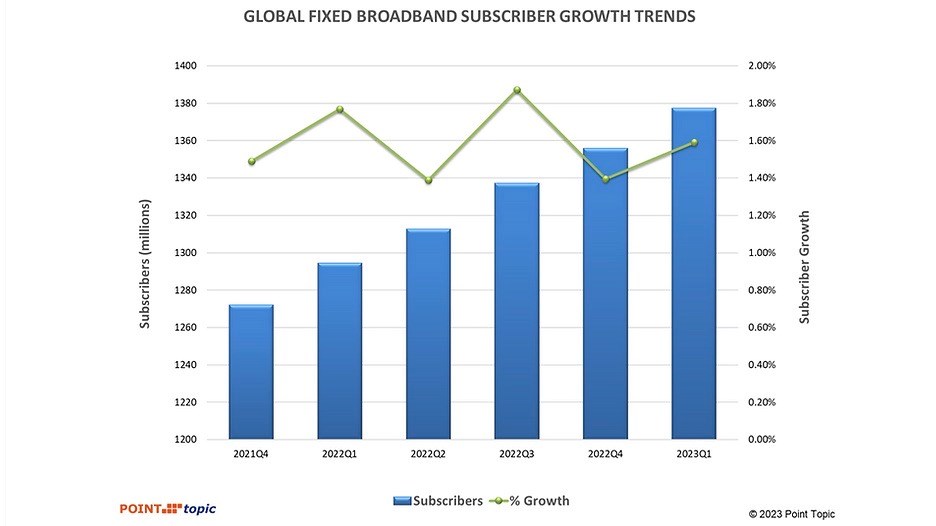
Global fixed broadband connections reached 1.377 billion as of Q1-2023, up by 83 million from a year earlier and reflecting an annual growth rate of 1.59%, according to Point Topic.
There was a decline in fixed broadband subscriptions in 18 countries[1] which mainly include emerging markets, as well as some saturated markets such as Singapore. However, while there were fluctuations in growth rates across regions and markets, the overall trend indicates a steady expansion of global broadband connectivity.
Highlights:
-
Among global regions, Africa, East Asia and America Other saw the fastest growth in broadband connections (2.9%, 2.2% and 1.8%), not least due to healthy increases in broadband subscribers in the vast markets of Egypt, Brazil and China.
-
The share of FTTH/B in the total fixed broadband subscriptions continued to increase and stood at 66.7%. Broadband connections based on other technologies saw their market shares shrink further, with an exception of satellite and wireless (mainly FWA).
-
VDSL subscriber numbers grew in ten countries, while they dropped in at least 22 markets as consumers migrated to FTTH/B.
-
The highest FTTH/B broadband subscriber growth rates in Q1 2023 were in Algeria, Peru and UK.
At 21.6 million, the quarterly net adds were close to the figure we recorded a year ago, though the growth rate (1.59%) was slower, compared to 1.77% in Q1 2022, with global inflation and economic instability having an impact.

East Asia continued to dominate in Q1 2023, maintaining its position as the largest market with a 49.6% share of global fixed broadband subscribers. This substantial market share is primarily driven by China with its vast population.
In Q1 2023, broadband subscriber base grew faster in China, Hong Kong and Korea, compared to Q4 2022. As a result, the region’s net adds share globally went up from 63.2% to 68.8%. Asia Other accounted for 10.8% of the global broadband market, similarly to the previous quarter, though the region’s net adds share went down from 12.8% to 9.4%.

Europe’s market shares remained rather consistent, though Eastern Europe saw their net adds share decline from 3.4% to 0.5%, as a result of slower growth in almost all markets and the decline in broadband subscribers in Russia having an especially significant impact due to its market size.
Similarly, Americas maintained relatively stable market shares of 10.3% and 8.1% respectively, while America – Other’s net adds share increased from 7.8% to 9%, driven by higher growth in such sizeable markets as Brazil, Mexico, Colombia and Chile, to name a few.

Next Point Topic looks at fixed broadband penetration among population, comparing it to growth rates across the regions.
Africa and Asia Other continue to have relatively low fixed broadband penetration rates among their populations. In Q1 2023, this metric in Africa stood at 4.6%, while Asia Other reached 5.6%. These figures indicate the potential for future expansion in these regions. Not surprisingly, Africa also recorded the highest quarterly growth rate of 2.9%.
The markets of East Asia and America Other followed closely with growth rates of 2.2% and 1.8% respectively, despite East Asia already having the highest population penetration at 41.9%. This reflects a widespread adoption of fixed broadband services in East Asia, while America Other showcases steady growth in a region with significant potential, where broadband penetration is among the lowest, at 17.2%.
Eastern Europe displayed a modest growth rate of 0.2% with a population penetration of 24.8%. Some markets in this region still have a lot of headspace when it comes to broadband adoption but the growth was sluggish, likely due to economic pressures. Other European regions showed a slightly higher growth rate, with Europe Other at 0.5%, coupled with the second highest population penetration of 39.4%. These figures indicate a mature market with limited growth opportunities.

Among the largest twenty broadband markets all but one saw fixed broadband subscribers grow in Q1 2023, although in ten of them the growth was slower than in the Q4 2022. There was a slight drop in broadband subscribers in Russia which is under international sanctions.

The less saturated broadband markets of India, Egypt, Brazil and Mexico recorded the highest quarterly growth rates in Q1 2023, all higher than 2%. China recorded an above 2% growth as well. At the other end of the spectrum, the mature markets of Germany, France, Japan, UK, and Italy saw modest growth rates at below 0.5%. At the same time, Italy was among the countries that saw one of the largest improvements in growth rates, from -0.44% in Q4 2022 to 0.04% in Q1 2023, as its GDP growth also went from negative to positive in that period[2]. Mexico, China and Brazil recorded the largest improvements in their growth rates, at +1.14.%, +0.52% and +0.41% respectively.
Between Q4 2022 and Q1 2023, the share of FTTH/B connections in the total fixed broadband subscriptions went up by 0.7% and stood at 66.7%. Broadband connections based on other technologies saw their market shares shrink further, with an exception of satellite and wireless (mainly FWA), which remained stable.

FTTx (mainly VDSL) share stood at 6.7%[3]. VDSL subscriber numbers grew in ten countries (including modest quarterly increase in the large VDSL markets of Turkey, Czech Republic, Greece and Germany, for example), while they fell in 22 other markets as consumers migrated to FTTH/B.

It remains to be seen whether consumers will continue to gravitate toward fibre broadband offerings, particularly as global economies face potential slowdown and inflationary pressures.
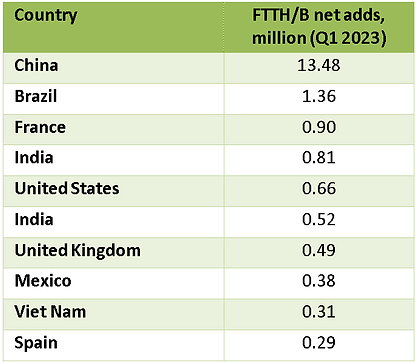
In terms of FTTH/B broadband net additions in Q1 2023, China continued to maintain a significant lead with 13.5 million while Brazil added 1.4 million. Mexico is back in the top ten league, having pushed out Argentina this quarter.
Satellite broadband also saw a modest growth of 1.3% while wireless broadband demonstrated continued relevance with a respectable growth rate of 4.9%. These trends can be attributed to the demand for connectivity in remote or underserved areas where traditional broadband infrastructure is not feasible.

The diverse growth rates among different broadband technologies highlight the dynamic nature of the industry as consumers seek more reliable and high-speed connections. The significant increase in FTTH/B connections and the growth of satellite and wireless broadband underline the ongoing efforts to bridge the digital divide and ensure connectivity for all.
The top ten countries by fixed broadband subscribers remained unchanged (Figure 5). As of Q1 2023, China exceeded 0.6 billion fixed broadband subscribers, having added 14.6 million in the quarter. Also, the country is approaching 1.2 billion 5G subscribers, with the service now being used by 84% of the population.

Overall, the latest fixed broadband subscriber data reveals a clear trend towards advanced, high-speed broadband solutions like FTTH/B, while older technologies such as copper-based broadband (ADSL and VDSL) are experiencing a decline, suggesting that the broadband landscape is continuously evolving to meet the growing demand for faster and more reliable connectivity.
References:
https://www.point-topic.com/post/global-broadband-subscriptions-q1-2023
Point Topic: Global Broadband Tariff Benchmark Report- 2Q-2022
Point Topic: Global fixed broadband connections up 1.7% in 1Q-2022, FTTH at 58% market share
SDFI: Denmark Achieves 94.5% Gigabit Broadband Internet Coverage
New data from the Broadband Mapping 2023 report by the Danish Agency for Data Supply and Efficiency (SDFI) reveals that 97.5% of homes and businesses in Denmark now have access to high-speed broadband internet access.
The latest report from the Styrelsen for Dataforsyning og Infrastruktur (SDFI) sheds light on Denmark’s regional broadband coverage rates. The Region North Jutland has almost reached a 100 percent coverage rate.
According to the report, the coverage rate in Northern Jutland stands at an impressive 98.9%. Central Jutland closely follows with 97.7% coverage, while Southern Denmark boasts a coverage rate of 98.3%t. Zealand, the country’s largest island, achieves a solid coverage rate of 98%.
Although the country has made progress in digital connectivity, according to SDFI, there are still regional disparities in coverage. The Capital Region of Hovedstaden lags behind the other regions with a coverage rate of 96.2% (compared to Northern Jutland with 98.9%). Further, 94.5% of all households in Denmark can access Gigabit speeds, an increase of 2.6 percentage points year-on-year.
The report highlights the ongoing efforts of telecommunications companies in deploying broadband across the country. According to SDFI, 97.5% of homes and businesses currently can access fast broadband with speeds of at least 100 Mbps download and 30 Mbps upload. Moreover, 94.5% of users have access to gigabit speeds, representing a 2.6 percent increase from last year.
The findings of the SDFI report demonstrate Denmark’s commitment to improving broadband infrastructure and connectivity nationwide. As the country continues to prioritize digital transformation, it will pave the way for a more connected and digitally empowered society.
References:
https://www.commsupdate.com/articles/2023/06/30/95-of-danish-households-covered-by-gigabit-speeds/
https://telecomtalk.info/denmark-achieves-945percent-gigabit-broadband-coverage-sdfi/727153/
https://digital-strategy.ec.europa.eu/en/node/9828/printable/pdf
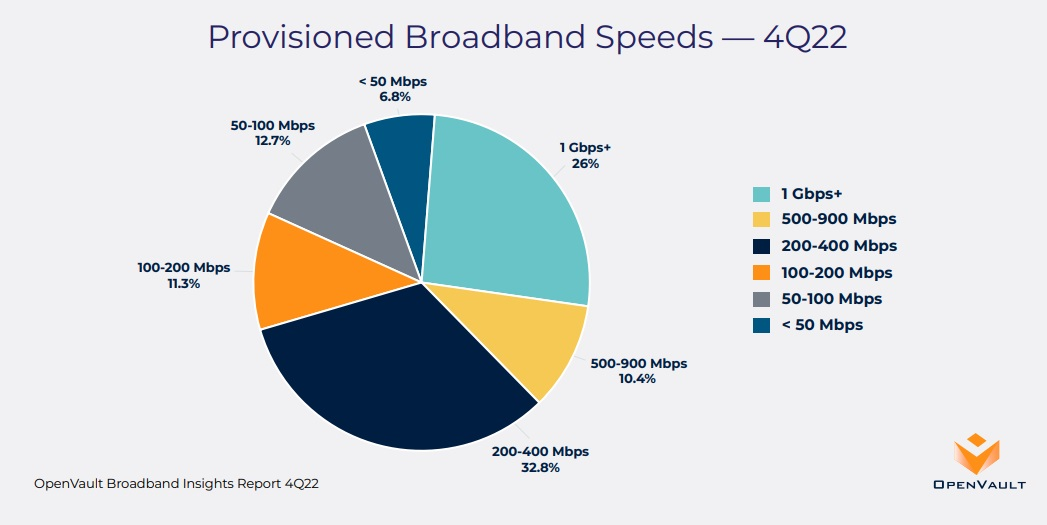
OpenVault: U.S. broadband users on 1-Gig tiers climbed to 26% in Q4 2022
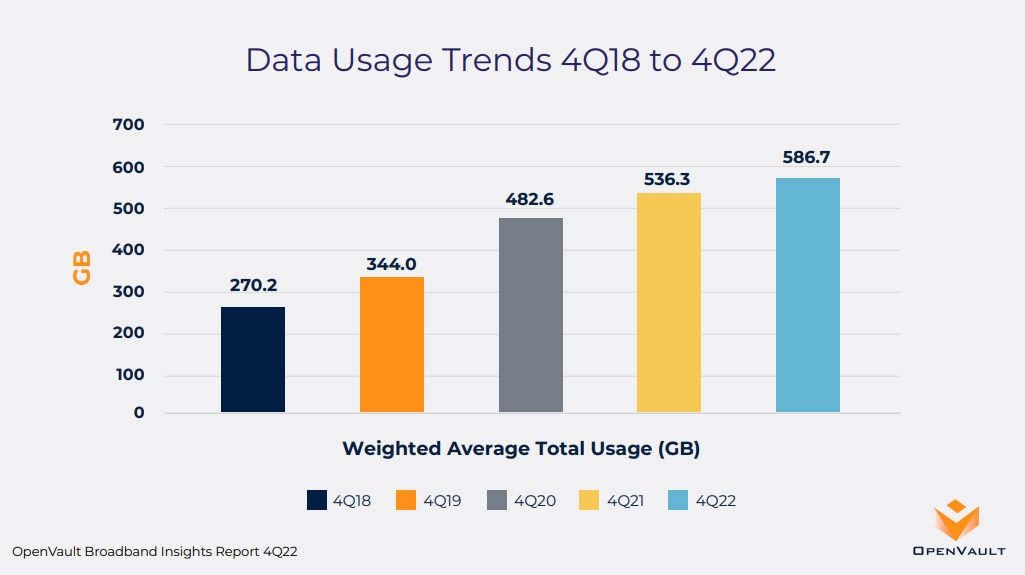
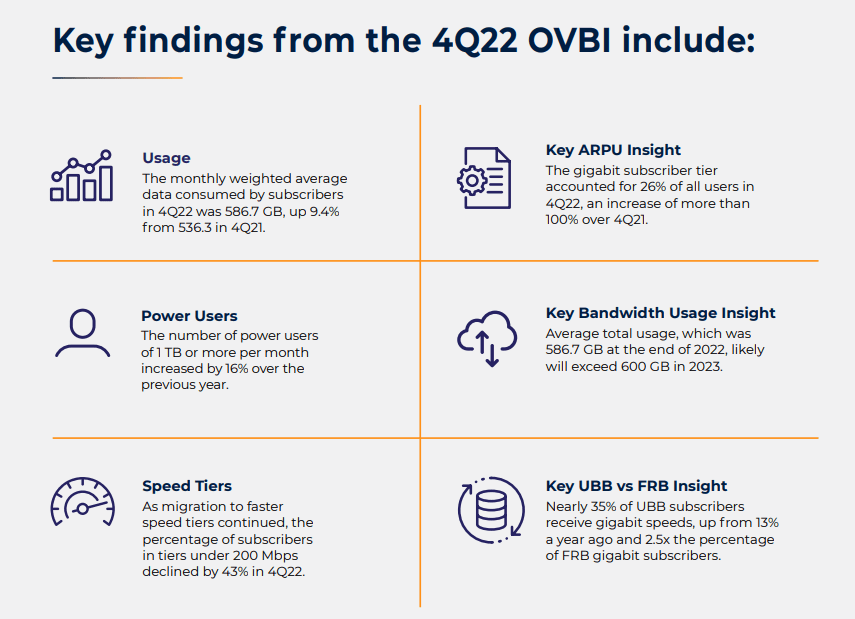
The 4Q22 edition of the OpenVault Broadband Insights (OVBI) report indicates that average household broadband consumption neared 600 GB per month, the percentage of subscribers on gigabit tiers more than doubled, and usage by participants in the FCC’s Affordable Connectivity Program (ACP) continued to outpace that of the general population. OpenVault expects household data usage to surpass 600GB by Q4 2023 and possibly reach 1 terabyte by the end of 2028.
Editor’s Note: OpenVault bases its findings on data from “millions” of individual broadband subscribers that are collected and aggregated from a software-as-a-service broadband service management tool in use by a wide range of ISPs. The data is used to pinpoint usage patterns, including the differences between two key categories: subscribers on flat-rate billing (FRB) plans that offer unlimited data usage and those on usage-based billing (UBB) plans, on which subscribers are billed based on their bandwidth consumption. OpenVault data is used for benchmarking purposes by the Federal Communications Commission (FCC) in specific comparative analyses.
…………………………………………………………………………………………………………………………………….
With broadband consumption on the rise, there’s been an increase in “power users” – households that use more than 1TB of data per month. The percentage of users at that level rose 18.7% year-over-year. “Super power users” – those consuming 2TB or more per month – climbed 25%, from 2.7% to 3.4%. That’s a nearly 30x increase within the past five years, OpenVault said.
- European average data usage (268.1 GB) grew 12.5% from a year ago, a faster pace than the North American annual growth rate of 9.4%.
- North American median data usage (396.6 GB) was more than 2.5x that of European median data usage (148.2 GB) in 4Q22, a slightly smaller difference than observed in 4Q21.
………………………………………………………………………………………………………………………………………………………………………………..
The percentage of U.S. broadband subs on 1-Gig (or higher speed) tiers climbed to 26% in Q4 2022, more than double the 12.2% observed in the year-ago period, OpenVault. As broadband speeds increase, the percentage of broadband customers provisioned for speeds of 200 Mbit/s or less is on the decline – 31% at the end of 2022, down 43% year-over-year, OpenVault found. Adoption of gigabit speeds has jumped significantly among Usage Based Billing (UBB) subscribers, increasing to almost 35% in 4Q22 from 13.4% in 4Q21.
OpenVault found that average data usage in households on the FCC’s Affordable Connectivity Plan (ACP) continues to outpace the field. In Q4, average usage in ACP households was 688.7GB, 17% higher than the broader average of 586.7GB. OpenVault has observed that some households in the ACP program use the funds to upgrade to faster speed packages.
References:
https://openvault.com/resources/ovbi/ (register to download the report)
OpenVault: Broadband data usage surges as 1-Gig adoption climbs to 15.4% of wireline subscribers
Ookla: Fixed Broadband Speeds Increasing Faster than Mobile: 28.4% vs 16.8%
MoffettNathanson: 87.4% of available U.S. homes have broadband; Leichtman Research: 90% of U.S. homes have internet
Alaska Communications uses XGS-PON, FWA, DSL in ~5K homes including Fairbanks and North Pole
That build was funded, in part, through the Connect America Fund II (CAF II) program.
“While we consider fiber to be the gold standard, Alaska’s vast geography, weather conditions and existing middle mile network infrastructure make it hard to deploy a one-size-fits all technology,” the spokesperson said in the email.
Fixed wireless also underlies a project completed in 2022 that made gigabit service available to more than 1,200 homes at Fort Wainwright.
“Our network upgrades on Fort Wainwright use fiber-fed mesh wireless as the last mile delivery,” the spokesperson explained. “Our mesh networks use fiber and radios to create a redundant mesh of connectivity around the customer. We selected mesh because it’s fast to deploy, gives the customer a fiber-like experience and allows rapid deployment on military installations.”
The backhaul infrastructure underlying the Alaska Communications network expansion also used a wide spectrum of technologies.
On one end of the spectrum, the XGS-PON deployment is supported by the company’s core packet switched and optical transport networks. At the other end of the spectrum for lower-speed deployments, the company in “minimal cases” uses bonded copper for backhaul, the spokesperson said. For some of those lower-speed deployments, the company also relies on a combination of fixed wireless and fiber.
Interestingly, Alaska Communications fiber installations use a combination of aerial and buried cable. The use of buried cable is a bit of a surprise, recognizing that the ground in Alaska is frozen solid for a considerable portion of the year.
The company plans further expansion into the Interior in 2023 and beyond, according to a press release about the broadband expansion.
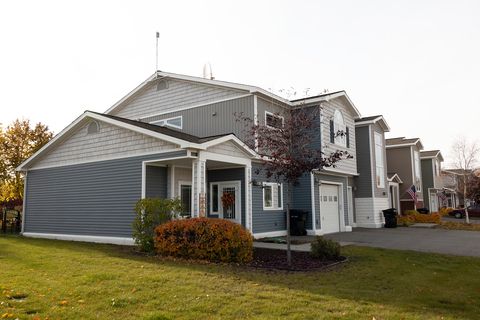
Fort Wainwright family housing equipped with an Alaska Communications receiver. Mesh networks use fiber and radios to create a redundant mesh of connectivity around the customer. (Photo: Business Wire)
Contact:
Heather Marron, Manager, Corporate Communications
[email protected]
……………………………………………………………………………………………………………………………………………….
DZS Inc: 2023 Telecom Trends & Applications Changing the Broadband Industry
by Geoff Burke, DZS Inc. (a global provider of access networking infrastructure, service assurance and consumer experience software solutions). Edited by Alan J Weissberger
There are a handful of significant trends that will emerge over the next several months as service providers navigate their transformation and seek to find their Competitive EDGE. This post will focus on the increasing shift to multi-gigabit services, the growing importance of the network edge and how service providers are being transformed into “experience providers..
- Multi-Gigabit Broadband Services are Becoming the New Standard – The shift to gigabit services was both widespread and well suited for Gigabit Passive Optical Networking (GPON) However, new advanced applications will require symmetrical multi-gigabit speeds. The proliferation of multiple devices using these bandwidth-hungry apps is pushing service providers to begin to think 10 gig services and beyond for both business and residential services. The emergence of the metaverse, with Ultra High Definition (UHD) Augmented Reality/Virtual Reality/Extended Reality (AR/VR/XR) and gaming applications will continue push these boundaries.
- The Network Edge Continues to Rise as a Strategic Location – The rise of 10 Gigabit Symmetrical (XGS)-PON and multi-gigabit services that support the above mentioned applications and more is creating new challenges in the network – especially as these apps require symmetrical bandwidth. Service providers realize that they must push equipment as close to the subscriber as possible to optimize traffic management, but also to minimize latency, which is becoming increasingly important in the world of the metaverse and AR/VR/XR apps. Additionally, leveraging intelligence at the edge moves it closer to where data is actually created and consumed and where the subscriber experience is defined giving service providers increased agility in monitoring, managing and optimizing performance.
- Service Providers are Rapidly Transforming into Experience Providers – As the network becomes increasingly software defined and intelligent equipment is deployed closer to the edge, the ability for carriers to both gather meaningful information that can reflect and provide actionable insights into user experience grows dramatically. As a result, the concept of a true “experience provider” is emerging where subscriber problems can be anticipated and proactively addressed, and user needs can be addressed remotely and immediately in an extraordinarily personalized manner. This transformation is proving to have profound impacts on carrier performance, with dramatically reduced churn, faster responsiveness, better performance, and higher Average Revenue Per User (ARPU).
…………………………………………………………………………………………………………………………………………………………………………………………………………………………………..
DZS Inc says these Applications are Changing the Broadband Industry:
- Connected Home: WiFi everywhere
- Connected Business: Passive Optical LAN
- MDUs: delivering multi-gigabit services
- Multi-gigabit services: they are becoming a major source of differentiation for service providers

References:
https://dzsi.com/resources/blog/the-broadband-trends-that-will-define-2023-part-1/
MoffettNathanson: 87.4% of available U.S. homes have broadband; Leichtman Research: 90% of U.S. homes have internet
When the FCC announced the November 18th release date for their long-awaited broadband mapping update, reflecting location-specific broadband availability as of June 2022, analysts at MoffettNathanson thought it would contain information on how many of U.S. homes have access to broadband and how many are too rural and are therefore unserved. However, that FCC release didn’t offer the numbers they needed, and the market research fim didn’t
have the necessary information to calculate it themselves.
In the underlying FCC datasets, which are provided for public download, each location served by a given technology or provider is a separate entry. One location is equivalent to one street address. But many street addresses in the U.S. correspond to multiple living units, and the number of units per location is not publicly available (the location fabric used by the FCC was contracted to a third party, CostQuest Associates, and that fabric is provided only to the FCC, broadband providers, state/local government entities, and select other interested parties). With approximately 31% of residences in multifamily homes, according to a 2019 survey by the Census Bureau, the number of units per location was, as of the November 18th release, a crucial missing piece for any meaningful coverage analysis we could do on our own.
Principal Analyst Craig Moffett wrote:
The FCC’s new maps of broadband availability can tell us coverage for residential locations or business locations, but not the combined total. The companies we cover sometimes break out residential and commercial, but not always. [As an aside, about half of small businesses in the U.S. are actually operated out of peoples’ homes, but hopefully this, at least, doesn’t introduce further distortion, since we are presumably still seeing just one subscription for one location]. So we’ll do our best to make sure we’re matching numerator and denominator by specifying whether we’re looking at all locations or residential locations only.
The FCC’s coverage data also doesn’t distinguish between occupied and vacant units. For our calculation of penetration, we’d want to exclude most vacant units, since vacant units don’t need broadband. Excluding all vacant units likely understates the denominator, though; for example, some second homes (which are treated as vacant) may have year-round broadband subscriptions. The best we can do is assume the coverage of total units is the same as the coverage of occupied units, and that vacant units with broadband subscriptions are negligible.
The FCC does report service coverage for satellite and fixed wireless. But some of those FWA subscribers are in areas where there’s no access to wired broadband, while others are in areas where wired broadband is available. Naturally, the companies won’t tell us how many of each there are. So we’ll just have to leave them all out. We’ll focus just on the availability of wired broadband.
Editor’s Note: The FCC broadband map for my address show a Licensed Fixed Wireless operator serves my condo. It’s California Internet with symmetrical 1G upstream/1G downstream. Also, there are two Satellite providers – Hughes Network Systems, LLC 25M/3M and Space X 350M/40M. Wired internet is available from AT&T and Comcast.
We’d really want to know how many DSL subscribers are in each of those different cohorts. But the
companies we cover don’t report how many of their DSL subscribers are in areas where there is
also a cable or fiber operator, and how many are in areas where DSL is the only option. The first
group is at risk. The second group is not. So, we’ll just have to include all DSL.
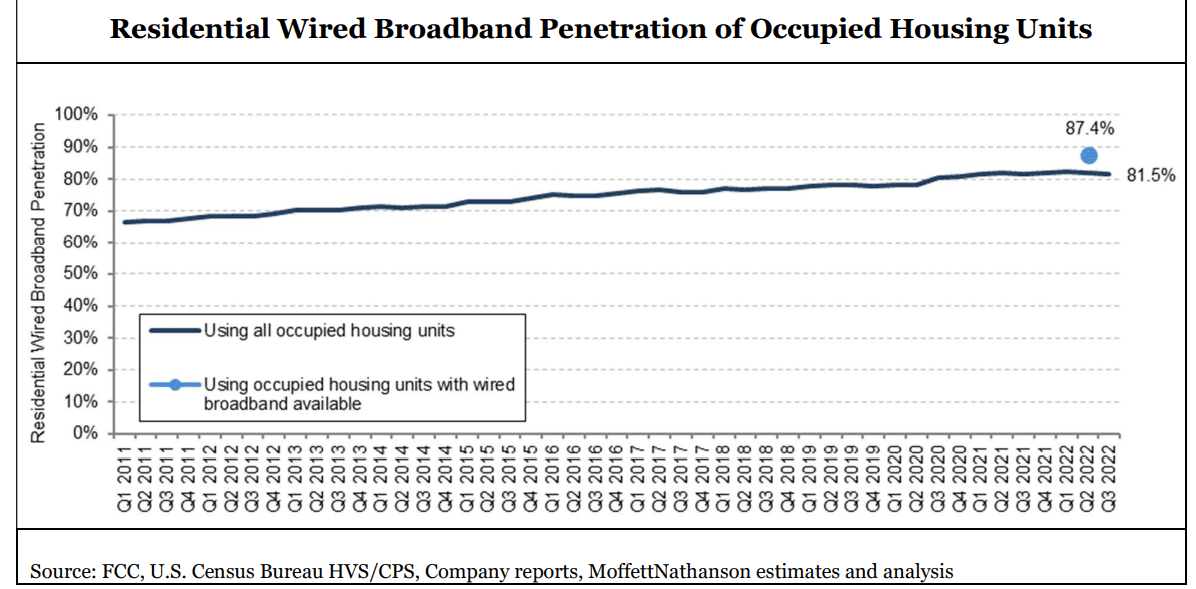
According to the FCC’s current estimates, wired broadband (defined as anything over 200 kbps downstream and 200 kbps upstream) was available to 93.7% of residential units in America as of June 30, 2022. Again, we don’t know the percentage of occupied housing units with wired broadband available, but let’s assume it’s the same. And we don’t know the number of residential units in the location fabric, so we’ll use the Census Bureau’s estimate of 128.1M occupied housing units in the U.S. Given these assumptions, we estimate wired broadband was available to around 120.0M occupied housing units as of June 30, 2022. With, by our count, an estimated 104.9M residential wired broadband subscriptions in America in Q2 2022 – again, including DSL, and sometimes including commercial as well as residential subscribers – that translates into penetration of 87.4% of broadband-available homes. We estimate that 81.5% of all households subscribe to wired broadband.
Craig’s Conclusions:
The goal for the FCC is to create maps that are not frozen in time but instead become living and breathing reflections of a dynamic marketplace. The new maps are subject to a public challenge process, enabling interested parties, including operators, local governments, and even individual would-be subscribers, to dispute reported availability. Challenges will eventually be part of a routine updating process. Indeed, the maps released in November were the product of what had already been a months-long initial challenge process. The maps are, again, a critical input to distribution of $42.5 billion of funds earmarked for rural broadband by the JOBS/Infrastructure Act. The National Telecommunications and Information Administration (NTIA) is required by law to use the FCC’s new map to distribute those funds in what is referred to as the Broadband Equity, Access, and Deployment (BEAD) Program, something they have committed to do by June 2023. They are likely to begin that process almost immediately, based on the number of unserved locations in each state, although NTIA chief Alan Davidson has said they will wait for the FCC to release the second version of its coverage map, later this year, before they actually begin to disburse those funds.
The network operators themselves, including the cable operators in particular, will in our view be major participants in the BEAD process, bidding aggressively to bring broadband to unserved census blocks on the periphery of their current franchise areas.
…………………………………………………………………………………………………………………………………………………………………………….
Meanwhile, Leichtman Research Group indicates that 90 per cent of U.S. households get an Internet service at home, compared to 84 per cent in 2017, and 74 per cent in 2007. Broadband accounts for 99 per cent of households with an Internet service at home, and 89 per cent of all households get a broadband Internet service – an increase from 82 per cent in 2017, and 53 per cent in 2007.
These findings are based on a survey of 1,910 households from throughout the United States and are part of a new LRG study, Broadband Internet in the U.S. 2022. This is LRG’s twentieth annual study on this topic.
Other related findings include:
- Individuals ages 65+ account for 34% of those that do not get an Internet service at home
- 56% of broadband subscribers are very satisfied (8-10 on a 1-10 scale) with their Internet service at home, while 6% are not satisfied (1-3).
- 44% of broadband subscribers do not know the download speed of their service – compared to 60% in 2017
- 61% reporting Internet speeds of >100 Mbps are very satisfied with their service, compared to 41% with speeds <50 Mbps, and 57% that do not know their speed
- 40% of broadband households get a bundle of services from a single provider – compared to 64% in 2017, and 78% in 2012
- 59% of adults with an Internet service at home watch video online daily – compared to 59% in 2020, 43% in 2017, and 17% in 2012
“The percentage of households getting an Internet service at home, including high-speed broadband, is higher than in any previous year,” said Bruce Leichtman, president and principal analyst for Leichtman Research Group, Inc. “Computer usage and knowledge remain the foundation for Internet services in the home. Among those that do not get an Internet service at home, 58% also do not use a computer at home..”
References:
https://broadbandmap.fcc.gov/home
https://www.leichtmanresearch.com/90-of-u-s-households-get-an-internet-service-at-home/
