

Broadcom lending Anthropic up to $42 billion in yet another AI circular financing deal
Backgrounder:
According to Reuters, which obtained Anthropic’s IPO prospectus, the Big Tech giants are depicted in multiple ways in the IPO filing- as distribution partners, financial backers, computer suppliers, and competitors, all at once. They uncovered the clearest view yet of how circular the AI world really is, and how much an AI lab’s success depends on the giants it’s also competing against.
Reuters was able to calculate that Anthropic pays roughly 16% of every dollar it earns from its cloud partners (Amazon, Google, Microsoft) back to those same big tech partners. It counts the full value of contracts sold through a cloud marketplace as revenue, then treats the cloud platform’s cut of revenue as a marketing cost.
OpenAI does the opposite by only counting what it keeps after the cloud partner takes its share. That difference matters for understanding the big numbers floating around, and how to actually compare the two rivals’ toplines as they both eye the public market.
Broadcom’s relationship with Anthropic spans compute supply, equipment leasing and financing — giving the semiconductor company a central role in Anthropic’s infrastructure buildout. That differentiates it from other major partners and investors such as Amazon which primarily provide cloud infrastructure and distribution for Anthropic’s AI model Claude.
As part of that complex relationship, revealed in the IPO filing, Broadcom has agreed to lend Anthropic up to $42 billion to finance infrastructure spending. In turn, Anthropic stands to become the largest customer in Broadcom’s entire chip design business next year, making their relationship a prime example of the reciprocal spending that has animated AI skeptics on Wall Street, even as the AI lab readies a public offering that could see it valued at $2 trillion.
“It feels that there’s quite a concentrated bet right now on two companies being able to generate enough revenues to support all the financing that’s happened,” said Robert Leitao, managing partner of Rothschild & Co.
Anthropic disclosed that Broadcom’s role in supplying hardware and acting as a financing partner creates “potential conflicts of interest” that might affect Anthropic’s ability to access the computing power needed for its work, according to the prospectus.
The AI lab also warned that Broadcom’s decisions around pricing and hardware could affect its ability to procure enough computing infrastructure. Broadcom did not comment. Anthropic declined to comment to Reuters.
In April, Anthropic announced it was teaming up with Broadcom and Google for a deal that would see Google provide its Tensor Processing Unit (TPU) chip capacity to Anthropic, with the supply coming online in 2027. Broadcom designs Google’s TPUs that are manufactured by TSMC in Taiwan.

A Broadcom circuit board for chip testing is pictured during a lab tour as Broadcom prepares to launch new optical chip tech to fend off Nvidia in San Jose, California, U.S., September 5, 2025. Brittany Hosea-Small · REUTERS via Yahoo Finance.
Anthropic is also relying on Broadcom for equipment leasing and financing. Broadcom could designate a financing partner, and the debt instruments could be converted into Anthropic shares. Anthropic said in its filing it doesn’t expect any notes to be sold before it completes its IPO. The convertible note Anthropic would issue could finance about a third of the $125.2 billion commitment the AI lab has made for a five-year lease of tensor processing unit (TPU) computing capacity.
Other Players:
Broadcom rivals Nvidia and AMD have also provided funding to their own customers, including OpenAI and Anthropic, which the labs then used to pay for access to the companies’ high-powered chips. The concern about such circular financial schemes is that if one domino in the row falls, it will cause a chain reaction that will decimate the AI trade and, as a result, the global equities markets that have benefited from and come to rely on AI firms and hyperscalers.
As to the circularity of all of this financing, the BIS notes (via FT Alphaville):
“… circular relationships make reported demand partly endogenous to firms’ own financing decisions. For example, when a supplier finances a customer, part of the supplier’s revenue growth reflects its own capital investment, rather than organic final demand. This makes it harder for investors, lenders and supervisors to gauge what part of the current AI boom is based on organic demand.”
“The parallel with the telecom boom of the late 1990s is instructive: upstream equipment vendors financed network operators so they could buy the vendors’ equipment. This meant that part of the equipment vendors’ reported sales was being funded by the vendors themselves. For a time, as operators expanded their networks, equipment orders also expanded and vendors booked both the sales and loans as assets. However, when operators’ own revenues failed to materialize or slowed, they could neither repay the loans nor sustain the equipment purchases. Equipment vendors then sustained both financial losses and a loss of sales. Such dynamics may also play out in AI if revenue growth and end user demand fall short of firms’ expectations.”
……………………………………………………………………………………………………………………………………………………………………………………………..
- 2026 Debt Issuance: Projected between $220 billion and $250+ billion for major US hyperscalers (Alphabet / Google, Amazon, Meta, Microsoft, and Oracle), with broader AI-related market debt reaching up to $570 billion.
- 2027 Forecast: Goldman Sachs projects direct hyperscaler debt issuance to nearly double to around $400 billion (Jeff Pu estimates $419 billion) as companies finance over a third of their infrastructure needs.
- Aggregate Capex: Combined capital expenditures are expected to hit roughly $940 billion in 2026 and scale past $1.3 trillion in 2027.
- Market Share: Hyperscaler investment-grade bond sales have jumped from roughly 2% of total US supply (2022–2024) to roughly 9% in 2026.
- Credit Impact: Credit spreads on a 10-year hyperscaler credit basket have widened from historical 40–75bp ranges toward 90bp+, driven by leverage concerns.
- Cash Flow Outlook: S&P Global Ratings expects all major hyperscalers to run negative free operating cash flow through 2026 and 2027, with a cash-flow inflection point not projected until 2028–2029.
Source: Google Gemini
…………………………………………………………………………………………………………………………………………………………
References:
https://www.ft.com/content/87875b20-4081-4511-9afe-4ee389409742
Curmudgeon: Caveat Emptor: Huge Debt and Circular Financing Deals Dominate AI Build-Outs (07/23)
Bain & Co: AI Infrastructure Buildout Will Require $6 Trillion Revenue by 2031 to Support Massive CAPEX
The AI Infrastructure Build-Out: A $10 Trillion Bet on Compute, Power, and Networks
Nvidia CEO Huang: AI is the largest infrastructure buildout in human history; AI Data Center CAPEX will generate new revenue streams for operators
AI risks and backlash increase; Recap of the circular loop of fake AI profits and hyperscaler markups of private AI companies
China vs U.S.: Race to Generate Power for AI Data Centers as Electricity Demand Soars
How will fiber and equipment vendors meet the increased demand for fiber optics in 2026 due to AI data center buildouts?
Expose: AI is more than a bubble; it’s a data center debt bomb
Will billions of dollars big tech is spending on Gen AI data centers produce a decent ROI?
Huge Risks for the proposed $500B AI Investments from Giant Wall Street firms
Can the debt fueling the new wave of AI infrastructure buildouts ever be repaid?
Telcos don’t have an AI problem; they have a voice estate visibility problem
By Satish Barot, Co-founder and CTO, Klearcom with Shazia Hasnie
AI is increasing telecom interdependence
This author has spent around twenty years building telephony products, and the last few watching what happens when AI gets added to them. The models are usually fine, but the voice estates around them are not.
Explanation: The voice estate is everything a voice call touches: the number dialed, the carriers delivering it, the menu that answers, the systems behind it, and in every country/location served.
NVIDIA’s February 2026 survey of roughly one thousand telecom respondents found that sixty percent of organizations are using or evaluating generative AI, up from forty nine percent in its 2024 edition. The voice call that once met a gateway and a queue now meets speech recognition, a language model, a synthetic voice, and also identity checks.
Every one of those can be healthy while the call goes wrong. So the useful test is whether you can prove, from outside your own network, that a real customer’s call still ends the way it should.
Why AI amplifies operational complexity
Old fashioned faults announce themselves: a line drops and something logs it. AI is quieter, and it fails in ways worth naming. It gets worse quietly: a model loses accuracy on one kind of request and nothing reports an error. It’s also confidently wrong. WildASR tested seven speech recognition systems on recordings degraded the way phone audio is. When a caller is cut off mid word, by a network delay or by the system deciding they had finished, the models fill in words nobody said. Further down the line that looks like a clean answer. The same benchmark makes a broader point: robustness measured in one language can substantially mispredict behavior in another, so a release validated in one market tells you little about the next.
Speed fails at the edges, not the average. A system that usually answers in under a second, but takes two and a half seconds on one call in ten, feels broken to those callers and healthy on every voice testing team chart. Nor is the result repeatable: EVA-Bench tested twelve systems and found a wide gap between passing once and passing every time, which undoes testing against a single expected answer.
Then the ones nobody looks at: the fallback menu that takes over when the AI gives up is usually the least maintained thing you own, and it runs exactly when things go wrong. None of this turns a light red on a contact center voice dashboard.
The other exposure is a number that anybody can dial. OWASP ranks prompt injection first among risks to applications built on language models, and a voice channel is an open microphone into the instruction path itself: a caller talks the model out of what it was built and told to do. Mitigations exist and they are worth naming. Treat caller speech as untrusted input and keep the transcript out of the context that carries instructions, constrain what the model can emit to a defined set of intents and slots rather than free text, and require confirmation for anything that moves money, changes credentials, or reads account data back.
The customer journey as the real test environment
Take a composite example, assembled from patterns that recur across multi country voice estates rather than drawn from one operator. An operator runs support numbers in fourteen countries behind one AI system. On Friday the team delivers an updated model and a new synthetic voice. Both pass in testing, no issues. By Monday, the share of calls handled without an agent is up by six points, complaints are up in three countries where the release went live first, and every dashboard is green. Nobody knows why.
The new voice made the menus two seconds longer, and nobody adjusted the window in which the system listens for a caller to stop talking. Callers spoke too early, the system heard fragments, filled the gaps, and guessed just confidently enough to keep a person out of the call.
The headline number improved because failures had stopped escalating. Every part did its job, so nothing raised an alarm. What broke was the outcome, and no single part owns the outcome. People given those same recordings transcribed them easily.
Those failures are not hypothetical. Test calls run by my own team over the past two years have found a global biopharmaceutical company whose menu prompts ran into each other faster than callers could answer, a financial services provider whose speech recognition intermittently failed on the word “agent”, so the route to a human worked on some calls and failed on others, and a healthcare data provider whose misrouted number reached an AI assistant that was never meant to answer it. In every case the systems carrying the call reported nothing wrong.
From system monitoring to outcome validation
Monitoring looks inward: are my systems up? Validation looks outward. It places a real call in country and checks the result against what should have happened: is a customer in this country, on this network, right now, getting the right answer?
Monitoring only sees what you own, and these failures hide inside the part causing them. So the two work together: validation tells you something is wrong and where, monitoring tells you why. Three changes follow. Report three numbers where you currently report one: calls the AI resolved correctly, calls it escalated correctly, and calls it failed. Report the slower calls alongside the average ones, and report by country and carrier instead of one global figure.
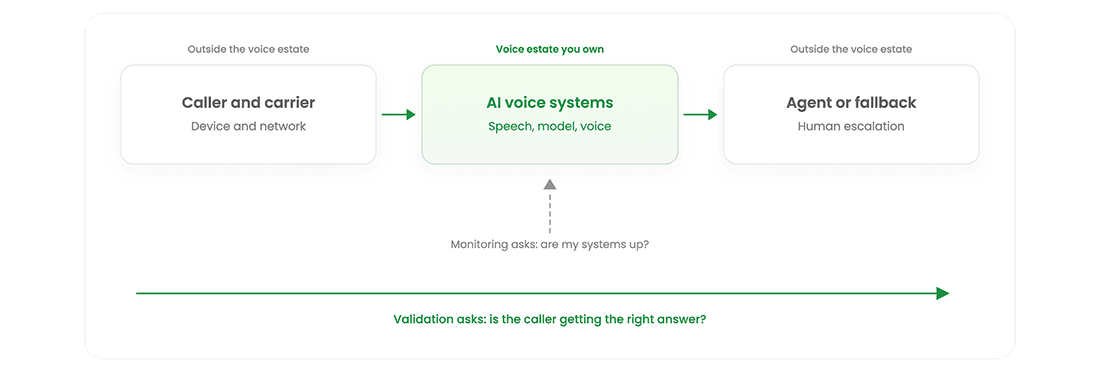
Figure 1. A single call crosses the voice estate an operator owns and systems it does not. Monitoring covers only the shaded stage. Validation traverses the whole path from the caller’s side.
Continuous testing as an assurance layer
The industry already has vocabulary for this. TM Forum’s autonomous network levels give operators a shared scale for how much of the “operate, assure and optimize” loop runs without people, and the same NVIDIA survey places 88% of organizations at Levels 1 to 3 on a scale of 0 to 5. Moving up that scale rests on evidence about delivered outcomes.
If the journey is what breaks, the journey is what you test. That means dialing the real public number, from a real device, on a real carrier in the country the customer is calling from, rather than looping a call back inside your own data center. It means testing from the outside in, and it means doing it on a schedule, across every country and carrier your customers use, fixed and mobile.
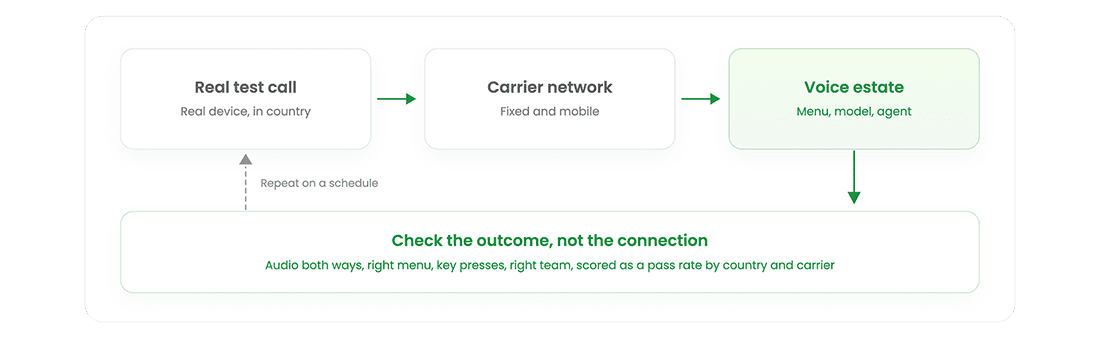
Figure 2. Testing the journey from the outside in. A scheduled call dialed from a real device in the country the customer calls from, scored on the delivered outcome.
Check outcomes, not connections: audio clear both ways, the right menu, key presses registered, the caller reaching the right team with their details intact. Score it across many calls with a library of realistic phrases, accepting a pass rate rather than an exact match, so decline shows as a trend. Treat a model update like a network change: try it on a few numbers first, then pull it back if the pass rate drops.
Several approaches are in this category. Synthetic transaction monitoring from operator owned probes, carrier side test call generation and crowdsourced testing on real handsets all produce outside in evidence, and they trade off differently on country coverage, cost and how closely the test resembles a real customer’s call. The common requirement is that the evidence originates outside the systems being assured, on a call placed in the country where the customer is dialing from.
Practical implications
Keep human escalation as a safety valve, not a number to drive down: cutting it without checking correctness makes the metric look better while the service gets worse. Then give the outcome an owner. Gartner’s June 2025 forecast that over 40% of agentic AI projects will be canceled by the end of 2027 attributes those cancellations to escalating costs, unclear business value and inadequate risk controls. Model capability doesn’t appear anywhere on that list. This is organizational before it’s technical.
These failures are seams between systems that break without producing an error, and monitoring your own equipment cannot see them: the gap sits between what your systems report and what your customer gets. Networks have been tested end to end for decades rather than trusted part by part. Voice estates deserve the same.
References
- NVIDIA (2026) State of AI in Telecommunications: 2026 Trends. Fourth annual survey report, published 19 February 2026, based on responses from 1,038 telecom professionals worldwide. Summary of findings: Survey Reveals AI Advances in Telecom.
- Tay, G., Ma, W., Lee, J., Tang, Y., Lee, D., Yin, W., Shen, D., Meng, S., Zhu, Y., Li, M. and Smola, A. (2026) Back to Basics: Revisiting ASR in the Age of Voice Agents. Boson AI. arXiv preprint arXiv:2603.25727, 26 March 2026. Introduces the WildASR benchmark. Dataset and code: bosonai/WildASR.
- Bogavelli, T., Gauthier Melançon, G., Stankiewicz, K., Bamgbose, O., Riols, F., Nguyen, H.H., Mehndiratta, R., Brin, L.D., Marinier, J., Subramani, H., Madamala, A., Nemala, S.K. and Sunkara, S. (2026) EVA-Bench: A New End-to-end Framework for Evaluating Voice Agents. arXiv preprint arXiv:2605.13841, 13 May 2026, revised 27 May 2026. DOI: 10.48550/arXiv.2605.13841.
- OWASP GenAI Security Project (2025) OWASP Top 10 for LLM Applications 2025. OWASP Foundation. Prompt injection is listed first, as LLM01.
- Gartner (2025) Gartner Predicts Over 40% of Agentic AI Projects Will Be Canceled by End of 2027. Press release, Sydney, 25 June 2025.
- TM Forum (2025) Autonomous Networks Framework v2.0.0 (IG1218F). Introductory Guide, published 20 March 2025, TM Forum Approved 9 May 2025. Levels of autonomy 0 to 5. Evaluation criteria for assigning a level are in Autonomous Network Levels Evaluation Methodology (IG1252).
-
Bain & Co: AI Infrastructure Buildout Will Require $6 Trillion Revenue by 2031 to Support Massive CAPEX
………………………………………………………………………………………………………………………………………………………………………..

About the author:
Satish Barot is co-founder and CTO of Klearcom. He has spent around twenty years building telephony products and leads the engineering team behind Klearcom’s voice testing platform.
Bain & Co: AI Infrastructure Buildout Will Require $6 Trillion Revenue by 2031 to Support Massive CAPEX
Introduction:
Bain & Company estimates that the AI industry will need to generate approximately $6 trillion in annual revenue by 2031 to support the capital intensity (CAPEX) of the global AI infrastructure buildout, including investment in data centers, accelerated computing, memory, networking and power systems. In its latest technology report, released September 29th, Bain projects that new AI-enabled products could account for roughly $4.2 trillion of that revenue requirement. The firm identifies AI-driven innovation across search, advertising, autonomous systems and physical AI as major prospective sources of value creation.
Enterprise adoption could contribute a further $1 trillion to $1.4 trillion annually through productivity gains in software engineering, sales, marketing, customer service and IT operations. Bain characterizes “absorption speed”—the rate at which enterprises operationalize AI—as the emerging competitive variable, with leading AI labs investing more than $9.75 billion in engineering models intended to accelerate enterprise deployment and integration.
“The debate today is fixated on employee productivity. The economics of AI infrastructure demand trillions in new revenue beyond productivity gains. What the industry needs is a wave of innovation that will dwarf what mobile and cloud unlocked,” said David Crawford, chairman of Bain’s global technology practice and lead author of the report.
At a Glance:
- AI infrastructure investment is racing ahead, but generating enough economic value to justify it will require trillions of dollars in new AI-driven revenue.
- Productivity gains from existing enterprise and consumer applications won’t be enough; entirely new markets must emerge to close the funding gap.
- The winners will be those that create breakthrough AI applications that transform industries and expand the global economy.
Consumer AI services, including subscription and advertising-supported offerings, are projected to contribute between $200 billion and $400 billion in annual revenue. This segment is central to the commercial scaling of AI because it extends AI-enabled services to billions of users through consumer platforms, devices and digital-service ecosystems.
“New products and uses that don’t exist today will enable new markets and opportunities from abundant intelligence – these may include drug discovery, mental health and energy generation,” Bain said.
Bain forecasts annual AI infrastructure spending of up to $1.5 trillion by 2031. The figure encompasses greenfield data-center construction, expansion of existing facilities, and continuing investment in GPUs, memory, network fabrics and related infrastructure. Bain assumes that capital expenditure could represent approximately one-quarter of total AI-industry revenue—“an ambitious but reasonable percentage based on trends among cloud providers.” On that basis, the firm calculates that the AI market would need to approach $6 trillion in annual revenue to sustain the projected infrastructure investment cycle.
“The unprecedented speed and scale of the AI buildout, with billions flowing into chips, data centers, networks and power systems, have focused attention on the challenge of building capacity. But the more important question may be whether enough economic value can be created to justify it.”
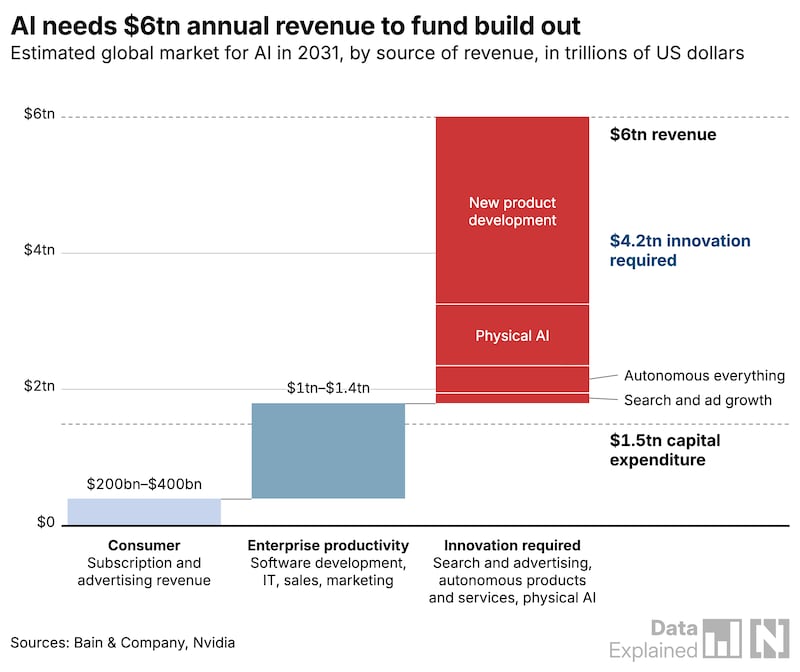
Consider the scale of investment and the gap between that and the revenue model necessary to fund it.
- The arms race among hyperscalers (Microsoft, Google, Amazon, Meta, and Oracle) is accelerating: Their capital expenditures could reach $780 billion in 2026, nearly five times the level of just three years earlier.
- Leading-edge AI data centers today are approaching 1 gigawatt (GW) of power capacity. By 2027, many are expected to approach 2 GW facilities, with 9 GW campuses emerging by the end of the decade.
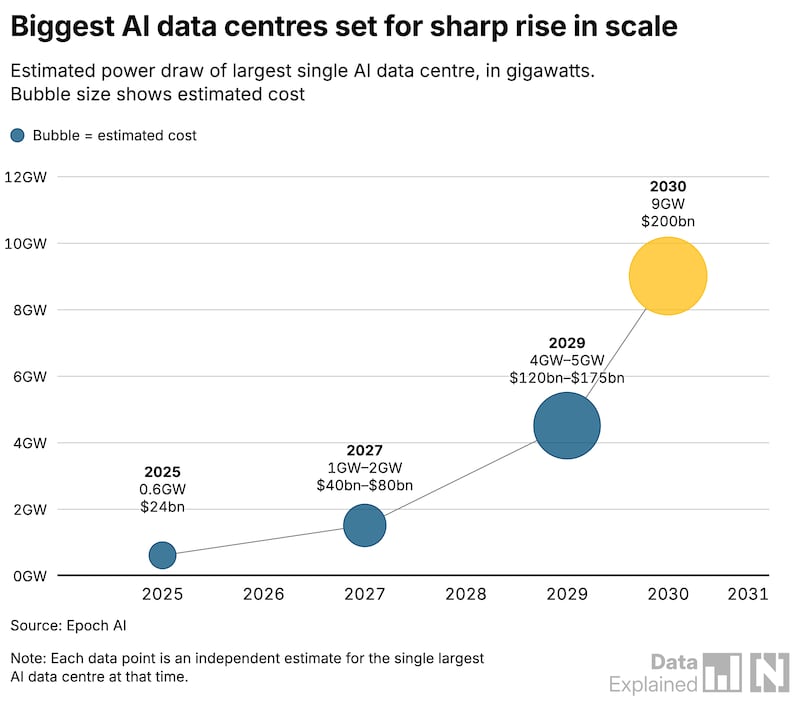
The scale of individual AI data-center projects illustrates the infrastructure requirements underlying those projections. Bain said AI data-center size and cost are increasing rapidly, with leading facilities approximately doubling in scale every 12 to 16 months. Meta Platforms’ Prometheus data center in Ohio, for example, had approximately 600 MW of capacity and an estimated cost of $24 billion in 2025, according to Epoch AI. The facility is projected to reach as much as 2 GW of capacity and cost approximately $80 billion by 2027. Epoch AI projects that Prometheus could reach 5 GW by 2029, with costs of up to $175 billion, and 9 GW by 2030, at an estimated cost of $200 billion.
Such growth places data-center infrastructure squarely within the telecommunications and network-infrastructure domain. Multi-gigawatt AI campuses require high-density optical interconnects, large-scale Ethernet or InfiniBand fabrics, low-latency east-west traffic engineering, high-capacity metro and long-haul connectivity, and resilient access to electric generation and transmission capacity. The infrastructure challenge consequently extends beyond data-center construction to the coordinated scaling of semiconductor supply chains, transport networks, power systems, cooling infrastructure and specialized technical labor.
Bain identified electric-grid capacity, access to GPUs and other critical infrastructure components, talent availability, workforce retention, public acceptance and regulatory requirements as important factors shaping the pace and geography of AI data-center deployment. Resource consumption, noise and community impacts are also becoming material considerations in project planning and approval processes.
Governments in the UAE, Saudi Arabia, the European Union, South Korea and the United States are supporting the expansion of AI and data-centre infrastructure, Bain said. The firm described data centres as increasingly important to technology innovation, economic development and national sovereignty.
The Bain report stated: “Capital needs for data infrastructure will remain high … bottlenecks in power, semiconductors, and other inputs carry large capital needs of their own, opening additional entry points for investors. And as sovereign infrastructure becomes a bigger part of national strategies, partnerships offer both a way in and geographic diversification.”
…………………………………………………………………………………………………………………………………………………………………………………………………………………….
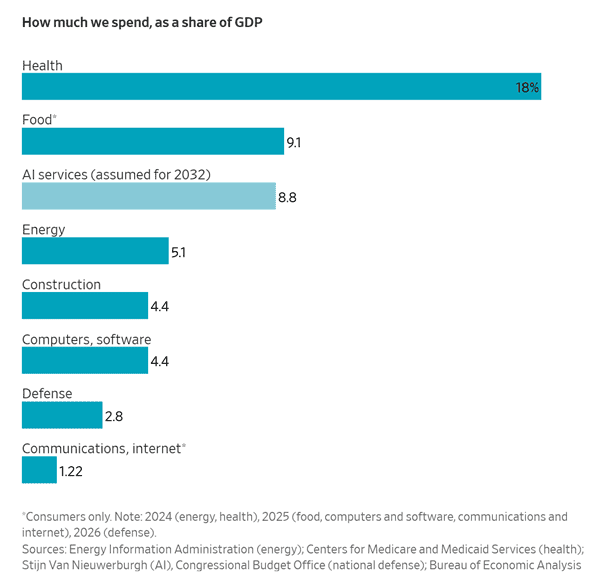
Greg Ip of the WSJ: Believers in the artificial-intelligence boom need to take a very close look at this number: 9% of GDP. That is how much American businesses and consumers eventually have to spend per year on the services of companies like Anthropic and OpenAI to justify the staggering sums being committed to the technology right now.
Is it plausible that Americans will spend as much of their income on this one technology as they do on food? Roughly twice what the nation pays for all forms of energy or all computers and software? Seven times what consumers spend on phone, streaming, and internet services combined?
You should be skeptical. Even the most transformative inventions eventually run into the law of diminishing returns: each additional dollar a user spends yields less additional productivity (or enjoyment) than the last. That imposes a natural ceiling. The question, of course, is where that ceiling is. Whether or not you think 9% of GDP is right, you have to care, because this figure isn’t some fever dream: it is implicit in the dollars that investors and companies are committing right now.
The figure is courtesy of Columbia University finance professor Stijn Van Nieuwerburgh. His paper, first presented at the Brookings Institution, showed that the AI build-out is now bigger than any investment boom in American history. His more intriguing, and sobering, statistic is how much revenue AI would have to garner to justify that boom.
Conclusions:
- Dramatic innovation will be required to deliver the revenue necessary to fund the gap.
- The economics required to generate ROI from AI infrastructure are demanding trillions in new revenue, not just cost savings.
- The industry needs a wave of application innovation comparable with what mobile and cloud unlocked, not just productivity gains on existing workflows.
- The infrastructure is being built ahead of the demand curve, and funding it sustainably will require adding approximately 1% to the annual global GDP growth rate.
- The question is whether the applications arrive in time to pay for it.
……………………………………………………………………………………………………………………………………………………………………………………………………………….
References:
https://www.bain.com/insights/topics/technology-report/
https://www.wsj.com/tech/ai/will-america-spend-9-of-its-gdp-on-ai-the-industry-is-counting-on-it-3501bb4f?st=HkbAZs&reflink=desktopwebshare_permalink&mc_cid=65590ec418&mc_eid=5917efd771
The AI Infrastructure Build-Out: A $10 Trillion Bet on Compute, Power, and Networks
Dell’Oro: Data Center capex grew 92% in 2Q-2026 (caveats galore)
Dell’Oro: 2H2026 Data Center Capex to Accelerate due to massive AI Deployments
PwC: Global AI data center spending to hit $31.6tn by 2050; Role of full stack orchestration layer explained
Nvidia CEO Huang: AI is the largest infrastructure buildout in human history; AI Data Center CAPEX will generate new revenue streams for operators
AI risks and backlash increase; Recap of the circular loop of fake AI profits and hyperscaler markups of private AI companies
China vs U.S.: Race to Generate Power for AI Data Centers as Electricity Demand Soars
How will fiber and equipment vendors meet the increased demand for fiber optics in 2026 due to AI data center buildouts?
Expose: AI is more than a bubble; it’s a data center debt bomb
Will billions of dollars big tech is spending on Gen AI data centers produce a decent ROI?
Huge Risks for the proposed $500B AI Investments from Giant Wall Street firms
Can the debt fueling the new wave of AI infrastructure buildouts ever be repaid?
Meta’s Petal Subsea Cable to Bring Petabit-Class Optics to the Atlantic
Executive Summary:
Meta has announced Petal, a 7,000-km subsea cable connecting the U.S. and France that is designed to carry 1 petabit per second, or 1,000 Tbps, which is roughly twice the capacity Meta attributes to the current top transoceanic systems. If delivered as announced, it would be the first ocean-spanning subsea system engineered for an aggregate design capacity of 1 petabit/s (1,000 Tbps), It is a planned system—not an operational one. Petal is expected to enter service in 2029. At a glance:
- Petal, the next step in Meta’s subsea innovation, will be the first subsea cable to deliver petabit capacity at transoceanic distances, connecting France and the United States over approximately 7,000 km (4,300 mi).
- Expected to enter service in 2029, it will be the first subsea cable system to deploy multi-core fiber technology at scale, doubling the capacity per fiber without a proportional increase in power or physical infrastructure.
- Petal will be built in partnership with NEC and Sumitomo Electric Industries, with support on the French landing from Orange.
- As AI and cloud workloads grow, moving enormous amounts of data between global data centers becomes increasingly important.
- Owning more of the underlying network infrastructure can give hyperscalers greater control over capacity, reliability and future expansion.
Image Credit: Meta
……………………………………………………………………………………………………………………………………………………………………………………………………………………………
Detailed Discussion:
Petal is a roughly 7,000-km / 4,300-mile transatlantic cable connecting the United States and France. Meta announced it on September 21, 2026, saying it will be built with subsea-system supplier NEC, fiber supplier Sumitomo Electric Industries, and with Orange supporting the landing on France’s Atlantic coast.
At 1 Pbps, the raw line-rate equivalent is 125 TB/s—before protocol, FEC, framing, and operational overhead. That is a system-level aggregate capacity, not a claim that any one customer, application, wavelength, or AI training job receives a sustained 1 Pbps connection.
The technical breakthrough:
The key is not merely higher baud rates or more efficient coherent DSP. Petal’s headline architectural change is space-division multiplexing inside the optical fiber itself: two independently usable cores in each fiber.
A conventional single-mode fiber has one light-guiding core. In a two-core fiber, two separate cores sit within the same cladding, creating two spatial channels per fiber. Meta says Petal will be the first system to deploy multi-core fiber at transoceanic distance and that the approach doubles capacity without a proportional rise in physical infrastructure or power.
Conceptually: System capacity=(fiber pairs)×(spatial paths per fiber)×(usable spectrum)×(spectral efficiency)\{System capacity}
Petal attacks the second term. Rather than trying to keep extracting more bits per hertz from a single optical core, it introduces another spatial path in the same fiber. This matters because modern submarine systems are encountering increasingly difficult tradeoffs among:
-
Fiber-pair count and cable diameter.
-
Repeater count, electrical feed limits, and wet-plant power.
-
Amplifier noise and achievable spectral efficiency.
-
Modulation reach over a 7,000-km amplified path.
-
Manufacturing, installation, and repair complexity.
The practical attraction is clear: add spatial capacity before attempting a disproportionate increase in per-core spectral efficiency. This is broadly analogous to the industry’s movement toward more fiber pairs in modern submarine cables, but implemented here through a multi-core-fiber approach.
Why two cores—not many?
Multi-core fiber is not a new research subject, but deploying it in a long-haul undersea system is a materially different engineering proposition from demonstrating it in a laboratory or terrestrial trial. For a transoceanic cable, the relevant questions include:
-
Whether inter-core crosstalk remains acceptably low across the full submerged route and lifetime.
-
Whether repeater/amplifier architecture can amplify both cores efficiently and reliably.
-
Whether field splicing, branching, terminal equipment, fault isolation, and repairs are operationally manageable.
-
Whether yield, mechanical reliability, and cost work at industrial cable-production scale.
-
Whether the added spatial dimension produces capacity gains without undermining the wet plant’s power and reliability economics.
A two-core design is a conservative first operational step relative to more ambitious multi-core approaches. It aims to create meaningful spatial multiplication while keeping the fiber, repeater, and marine-system engineering tractable.
Why it matters for AI:
“AI workload” should not be interpreted as a single workload continuously transmitting a petabit per second over the Atlantic. The more credible rationale is that AI turns inter-data-center transport into a more strategic and less fungible infrastructure layer.
AI raises the value of predictable global capacity:
Large AI clusters are often concentrated where power, land, chips, and data-center construction capacity are available. The data, users, safety systems, content pipelines, training artifacts, model checkpoints, and inference services are global. That creates several high-bandwidth flows:
-
Replication and synchronization of massive data repositories across regions.
-
Model checkpoint and artifact movement among research, training, and serving locations.
-
Distributed training and experimentation, where the bandwidth and latency penalty must be judged against the value of pooling scarce accelerators.
-
Movement of data for preprocessing, evaluation, fine-tuning, and global content or telemetry analysis.
-
Serving-plane transport among regional inference clusters, content-delivery systems, and core application infrastructure.
-
Resilience capacity, enabling a large region to shift traffic or recover faster following a fiber fault, landing-station incident, power disruption, or data-center impairment.
For Meta, Petal also supports the broader reality that its global consumer platforms, data centers, content systems, and AI infrastructure require persistent, high-volume transatlantic connectivity. Meta explicitly frames the project in terms of rising global connectivity demand, while associating the capacity increase with a broader digital-services buildout.
Latency still constrains AI architecture:
A U.S.–France subsea path of roughly 7,000 km has an unavoidable propagation floor. Light travels through fiber at about two-thirds of the speed of light in vacuum, so the one-way physical propagation component alone is on the order of 35 ms, with actual end-to-end latency higher after route geometry, terrestrial legs, switching, and equipment delay.
That means Petal is highly valuable for bulk transport, replication, inference backhaul, data movement, and resilience. It does not eliminate the architectural preference to keep tightly synchronized, latency-sensitive distributed training within a metro, campus, or regional geography. For training workloads with frequent all-reduce operations, the speed-of-light constraint remains decisive.
The likely consequence is not “one worldwide AI supercomputer.” It is a fabric of large regional AI clusters connected by increasingly enormous interregional and intercontinental pipes.
Economic and network significance:
Petal is another indicator that hyperscalers are becoming direct builders and de facto strategic operators of global submarine infrastructure—not merely anchor tenants buying capacity from consortium cables or wholesale carriers.
Meta says it has invested in more than 20 subsea cable projects and cites Project Waterworth as part of that broader effort. This is strategically important for several reasons.
Capacity control:
Owning or controlling cable capacity gives a hyperscaler more freedom to engineer traffic, schedule upgrades, reserve restoration capacity, and match network expansion to data-center deployment. It reduces exposure to capacity scarcity on high-demand corridors and can improve economics relative to repeatedly purchasing long-term capacity leases.
Route diversity and resilience:
A new direct U.S.–France route can improve route diversity, although diversity is real only if the cable’s landing stations, terrestrial backhaul, marine path, and network interconnection are genuinely differentiated from existing failure domains. A cable does not create resilience merely by being new; it must avoid common choke points and be integrated into a broader mesh with restoration options.
Supply-chain positioning:
Petal strengthens the positioning of NEC and Sumitomo Electric in the strategically important subsea market. At the same time, it shows that advanced fiber technology—not just transponder generation or more fiber pairs—is again becoming a major differentiator in submarine-system design.
The utility model is changing:
Traditional cable consortia typically divided ownership and capacity among telecom operators. Hyperscaler investment has shifted the market toward private or hyperscaler-led systems optimized around cloud, content, and AI traffic rather than generalized carrier demand. Petal intensifies that shift: the network’s economic center of gravity is moving toward companies that own both the workload and the data-center footprint.
Important caveats:
The announcement is technically consequential, but it is important not to overstate it.
-
It is a design target, not deployed capacity. Petal is expected to enter service in 2029; its 1-Pbps performance has not yet been demonstrated in an operational transoceanic cable.about.fb
-
“1 Pbps” is aggregate system capacity. It is not a single end-to-end flow, and it should not be treated as equivalent to application throughput.
-
The precise terminal-line-system details remain undisclosed. Meta has not publicly specified the usable optical spectrum, individual wavelength rates, modulation formats, amplifier configuration, repeater spacing, fiber-pair count, landing points, spectrum allocation, or upgrade roadmap. Those details determine how the headline capacity is realized in practice.
-
AI is an important demand driver, but not the only one. The cable will carry a mixture of Meta traffic: consumer application traffic, content systems, cloud-like internal workloads, data replication, inference-related flows, and capacity reserved for protection and growth.
-
“No proportional increase” is not “no increase.” Meta says Petal can transfer twice the data without a proportional increase in power or physical infrastructure. That is a meaningful efficiency claim, but it does not mean the system avoids higher absolute power, equipment, manufacturing, or deployment requirements.
Conclusions:
Petal’s real importance is that it moves multi-core fiber from an advanced optical concept toward transoceanic commercial deployment. The project indicates that the next major submarine-capacity step may come not simply from better coherent optics or wider spectrum, but from adding spatial channels within the wet plant while constraining cable size and power-feed requirements.
For AI infrastructure, Petal is best understood as a global data-center interconnect and capacity-control asset. It will not overcome latency physics or make transatlantic synchronous training universally practical. But it can make it far easier for Meta to move large data sets, replicate state, balance workloads, support cross-region inference and services, and operate a more resilient global AI and application fabric. If it reaches service in 2029 at its stated performance, it will establish a consequential new benchmark for subsea-system architecture.
……………………………………………………………………………………………………………………………………………………………………………………………
References:
Announcing Petal, a First-of-its-Kind Transoceanic Subsea Cable
Inside Petal: Building the World’s First Petabit-Class Transoceanic Subsea Cable
https://tech.facebook.com/engineering/2022/02/economic-impact-subsea-cables/
TechCrunch: Meta to build $10 billion Subsea Cable to manage its global data traffic
Hyperscalers Dominance of Subsea Cable Capacity to Increase in the AI Era
Fiber Optic Networks & Subsea Cable Systems as the foundation for AI and Cloud services
Subsea cable systems: the new high-capacity, high-resilience backbone of the AI-driven global network
FCC updates subsea cable regulations; repeals 98 “outdated” broadcast rules and regulations
Echo and Bifrost: Facebook’s new subsea cables between Asia-Pacific and North America
NEC completes Patara-2 subsea cable system in Indonesia
Meta’s “Iris” AI Chip for MTIA: Implications for Telecom-Grade Optical Networking, DCI and High Capacity Ethernet Fabrics
Google Cloud announces TalayLink subsea cable and new connectivity hubs in Thailand and Australia
Ericsson signs MoU’s with Murata and Sumitomo to progress next-gen mobile network infrastructure
Introduction:
Ericsson has signed separate memoranda of understanding with Murata Manufacturing and Sumitomo Electric Industries to investigate component, radio, and network technologies for next-generation mobile infrastructure.
The collaborations are intended to link Japanese component and materials expertise with Ericsson’s RAN and system-integration capabilities, with an emphasis on technologies that could improve radio-network performance, lower energy consumption, and strengthen the resilience and trustworthiness of communications infrastructure for the 6G and AI era. Key takeaways:
- Ericsson, Murata Manufacturing and Sumitomo Electric Industries to explore advanced technologies aimed at enhancing network performance and improving product energy efficiency in the 6G and AI era
- Ericsson’s new R&D Center in Yokohama to provide a platform for closer collaboration with Japan’s technology ecosystem
- Collaborations to combine the advanced technology capabilities of Murata and Sumitomo Electric Industries with Ericsson’s global R&D capabilities and mobile network leadership

Focus on RAN innovation:
The MoUs provide a framework for joint technology assessment, engineering knowledge exchange, and proof-of-concept work. The companies will examine how advances in components, interconnects, radio hardware, and related technologies can be incorporated more effectively into future RAN platforms and programmable network architectures.
The work is expected to address a central 6G engineering challenge: translating innovation at the component level into system-level gains in capacity, coverage, energy efficiency, reliability, and operational flexibility. That includes evaluating technologies that can support increasingly software-defined, AI-assisted, and cloud-integrated mobile networks without compromising the performance and determinism required at the radio edge.
Linking components to systems:
Murata brings capabilities in electronic components and RF-related technologies, while Sumitomo Electric contributes expertise spanning optical communications, connectivity, materials, and related infrastructure technologies. Ericsson contributes global RAN research, network-architecture expertise, and experience in the design and deployment of programmable mobile networks.
Rather than positioning the agreements as product-development commitments, the MoUs establish an exploratory basis for identifying technical areas where Japanese component leadership can be aligned with Ericsson’s end-to-end network and RAN roadmap. The intended outcome is to accelerate the transition of promising technologies from component-level research into scalable network solutions relevant to both Japan and international markets.
Yokohama R&D role:
The collaborations will draw on Ericsson’s global R&D organization and its Yokohama R&D Center, which began operations in April 2026. The center develops advanced radio hardware and software for Japanese and global markets, including programmable network technologies, next-generation mobile systems, and open network architectures.
The Yokohama facility also serves as a collaboration point for customers and technology partners and supports Ericsson’s participation in international standardization. Its role is therefore broader than local product development: it connects Japanese technology innovation with Ericsson’s global research programs, ecosystem activities, and standards engagement.
Strategic significance:
For Ericsson, the agreements reinforce a long-term industrial commitment to Japan at a time when 6G research is increasingly focused on the interaction among advanced semiconductors and components, radio systems, AI-native network functions, cloud platforms, and energy-efficient infrastructure.
For the wider industry, the significance lies in the effort to close the gap between high-value component innovation and deployable network architecture. Future 6G systems will depend not only on new spectrum bands and radio techniques, but also on advances in RF front ends, antenna and packaging technologies, optical and electrical interconnects, power efficiency, and software-controlled RAN platforms. These collaborations position Ericsson, Murata, and Sumitomo Electric to evaluate where such technologies can deliver measurable system-level value in future mobile networks.
In August, NTT DoCoMo selected Ericsson’s RAN Compute platform for its networks in Japan, including for its 5G operations. The deployment is expected to improve network quality, and allow for some AI-native and programmable networks with an eye on long-term software evolution.
Executive Quotes:
Hiroshi Izumitani, Executive Vice President (Board Member), Director, Communication & Sensor Business Unit at Murata Manufacturing Co., Ltd., says:
“Murata has sought to address the challenges faced by its customers and society, contribute to solving them through technology, and support the advancement of culture. Through this collaboration, we aim to deepen our understanding of the needs and system requirements for next-generation communications infrastructure and explore the potential of our technologies to deliver value.”
Hirotake Iwadate, Executive Officer and General Manager, Transmission Devices Division, Sumitomo Electric Industries, Ltd., says:
“Sumitomo Electric recognizes the importance of long-term collaboration in advancing communications technologies. Through this collaboration with Ericsson, we look forward to deepening technical dialogue, exchanging expertise, and exploring opportunities for future innovation in communications and digital infrastructure technologies.”
Chafic Nassif, President of Ericsson Northeast Asia, says:
“Japan is home to many of the world’s most advanced component technologies. Through closer collaboration with Murata and Sumitomo Electric Industries, Ericsson aims to combine system-level knowledge from global network deployments with Japan’s deep component expertise, creating opportunities to accelerate innovation and expand the application of these technologies across communications, AI infrastructure, data centers, automotive systems and other advanced industries.”
………………………………………………………………………………………………………………………………………………………………………………..
References:
https://www.telecoms.com/5g-6g/ericsson-teams-up-with-murata-and-sumitomo-for-next-gen-networks
Yokohama announced as site of new Ericsson Japan R&D Center
4.8 GHz to 4.9 GHz frequency band uses & Verizon Wireless experimental license for testing ISAC with Ericsson
Ericsson and MediaTek Demonstrate 3GPP-Based GNSS RTK Positioning with Sub-30cm Accuracy Over a Commercial 5G Network
AT&T’s 600 MHz Deployment with Ericsson: Turning Low-Band Spectrum Into Coverage and Uplink Capacity
Ericsson leads SK Telecom AI RAN vs. NVIDIA’s GPU centric AI RAN Alliance
AT&T/Ericsson Demonstrate 5G-Based ISAC for Drone Detection at World Cup Stadium
Google’s Project Suncatcher: Satellite Orbit Validation of AI Accelerator Compute and Thermal Management
Executive Summary:
On Thursday, October 1st, Google plans to launch an experimental satellite designed to assess whether AI inference workloads can operate correctly in low Earth orbit. The spacecraft, designated MVP, is a technology demonstrator for Project Suncatcher, Google’s research initiative exploring space-based, solar-powered AI infrastructure.
Last month, technicians in protective suits and hairnets inspected, handled and tested the refrigerator-sized satellite commissioned by Google. They evaluated its deployable solar panels, which will unfold after launch and orient toward the sun. The spacecraft then underwent vibration testing to determine whether launch loads could damage its onboard processors or compromise mechanical assemblies. Technicians also applied witness marks across fasteners to identify any loosening during the test.
The satellite passed the vibration test: its fasteners remained secured, and its chips showed no apparent damage. James Manyika, Google’s senior vice president for research, described the outcome as “great,” while noting that orbital operations remain the more consequential test.
Project Suncatcher seeks to evaluate the technical viability of placing AI-compute infrastructure in space, where photovoltaic power is potentially abundant and uninterrupted by terrestrial weather or nighttime cycles. On Oct. 1, the MVP spacecraft is scheduled to launch aboard a SpaceX Falcon 9 from Vandenberg Space Force Base near Santa Barbara, California. Google provided The New York Times with an early inside look at the project, which would have appeared largely science fictional only a year ago.
Elon Musk, Jeff Bezos, Sam Altman and others have pledged support for orbital data centers, but the concept remains constrained by significant technical and economic barriers. These include launch cost, radiation tolerance, thermal management, intersatellite communications, orbital operations and eventual spacecraft disposal. At the same time, mounting local opposition to terrestrial data-center construction, together with power-grid, land-use and transmission constraints, has increased industry interest in off-planet computing infrastructure.
Google is not launching a data center. MVP is an experimental precursor intended to validate selected subsystem and operational assumptions. The spacecraft carries four tensor processing units (TPUs), specialized AI accelerators whose aggregate compute capability is approximately comparable to that of a single data-center server. Its solar-array system will provide roughly 1 kW of power, broadly comparable to the consumption of a household hair dryer.
That power budget is sufficient to evaluate how Google’s hardware performs under orbital radiation, vacuum and thermal conditions. The spacecraft will process simple AI queries and is intended to operate for approximately one year, although it is expected to remain in orbit for as long as six years before orbital decay causes atmospheric reentry and burnup.

Google tested A.I. chips at Crocker Nuclear Laboratory in Davis, Calif., with a particle accelerator known as a cyclotron. The goal was to test whether the chips could survive radiation in space.
Photo Credit…Jason Henry for The New York Times
………………………………………………………………………………………………………………………………………………………………….
Mr. Manyika emphasized that Google’s expectations are measured. “We don’t expect, to be perfectly frank, that we’ll have anything usefully operational in the next few years,” he said, comparing the mission to the company’s early efforts to build driverless cars. “Remember how Google was researching for like 15 years, before anything showed up? I think this is going to look like that.”
Scaling from one technology-demonstration satellite to a distributed orbital-computing system would require substantial capital and years of development, according to Brandon Lucia, a professor of electrical and computer engineering at Carnegie Mellon University. “If you do this on a large scale, there are additional engineering problems,” he said. “That is uncharted waters.”
From concept to flight test:
Project Suncatcher originated with Blaise Agüera y Arcas, a Google vice president and AI researcher who leads a team focused on intelligence research. Approximately three years ago, he attended a gathering of entrepreneurs and AI researchers centered on the escalating energy requirements of AI systems. He left convinced that space-based computing could eventually provide access to large-scale solar generation.
The idea “has been on my mind since I was kid,” he said. “There are longstanding ideas in science fiction about using stars for computation.”
Mr. Agüera y Arcas subsequently presented the concept to Mr. Manyika, who was initially skeptical but agreed to investigate whether AI processors could survive the radiation environment of space and be cooled effectively in vacuum.
In February 2025, Google began exposing AI chips to radiation at the Crocker Nuclear Laboratory in Davis, California. There, a cyclotron subjected the chips to radiation doses intended to approximate five years of space exposure. Radiation can induce “bit flips”—single-event errors that alter a circuit’s binary state from zero to one or from one to zero. Such faults can degrade or interrupt computation and can be particularly consequential in AI accelerators, memory systems and control electronics.
Google’s tests produced encouraging results. The company found that restarting the chips could generally clear the observed bit flips, suggesting that reset and recovery mechanisms may mitigate at least some radiation-induced errors. The test does not, however, eliminate the broader need for fault tolerance, error detection and recovery across a space-qualified computing system.
In May 2025, Mr. Agüera y Arcas joined a meeting arranged by Mr. Manyika to present the project to Sundar Pichai, Google’s chief executive. Sergey Brin, Google’s co-founder, also attended.
Mr. Brin and Mr. Pichai quickly greenlit the project. “OK, so this is a good idea,” Mr. Brin had said, according to Mr. Agüera y Arcas. “Let’s talk about how we’re doing it.”
Google has not disclosed Project Suncatcher’s budget. The company has said it expects orbital data-center costs to approach terrestrial data-center costs in the mid-2030s, assuming continuing reductions in launch costs. That assumption is central to the commercial premise: spacecraft hardware, launch, insurance, operations, networking and replacement cycles must collectively become competitive with land, power, cooling, grid interconnection and construction costs on Earth.
Satellite platform and thermal design:
Google contracted with Planet Labs, a satellite-imagery provider in which it had previously invested, to develop spacecraft capable of carrying its AI processors. James Mason, Planet Labs’ chief space officer, said discussions with Mr. Brin about performing computing tasks in space had occurred over several years, although the concept had previously appeared more distant.
“Back then, it seemed further off,” Mr. Mason said. “That was really before large language models took off and A.I. demand really started going exponential.”
Planet Labs agreed to launch two Google satellites in 2027. Google subsequently sought an earlier on-orbit demonstration and accepted additional programmatic risk to accelerate the schedule, according to Eric Stevens, a director of systems engineering at Planet Labs. To meet that timeline, Google integrated its AI chips into an existing Planet Labs satellite platform and initiated qualification testing.
Thermal management is among the program’s most consequential engineering challenges. AI accelerators produce substantial heat during computation, while convection-based cooling systems—including conventional fans—cannot operate in vacuum. Heat must instead move through conductive paths and be rejected through radiation.
Google’s design uses a layered thermal architecture. TPU devices are mounted on a green motherboard, above which sits thermal interface material—a compliant, pale-green compound supplied in sheets and intended to improve heat transfer between the chips and the adjacent metallic heat-spreading structure. Aluminum and copper layers conduct heat away from the motherboard to a radiator panel, which rejects thermal energy into space.
The initial system will operate in duty cycles rather than continuously. Travis Beals, Google’s senior director of product management for Project Suncatcher, said the chips can operate for approximately 15 minutes before they must be shut down to cool. Within those intervals, the processors will handle short inference requests for Google’s Gemini AI system.
The scaling challenge:
Google’s roadmap extends beyond the MVP mission. The company plans to launch two additional satellites next year and has developed concepts for constellations of more than 80 spacecraft flying in close formation and communicating with one another while processing AI workloads. Google is also evaluating the prospect of a purpose-built spacecraft approximately the length of a soccer field.
The key question is not whether a few AI accelerators can operate in orbit, but whether an orbital compute system can scale economically and reliably. A commercially useful architecture would need to solve several interdependent issues:
-
Radiation hardening, fault detection, redundancy and recovery for processors, memory, networking and spacecraft-control systems.
-
Continuous thermal rejection at substantially higher compute densities than the MVP demonstration.
-
High-capacity intersatellite links and ground connectivity capable of moving model inputs, outputs and potentially model parameters.
-
Autonomous fleet management, precise formation flying, collision avoidance and debris-risk mitigation.
-
Launch, replacement and disposal economics that compete with terrestrial data-center construction and power procurement.
-
A sustainable operating model for systems whose computing resources, maintenance cycles and network topology are inherently orbital rather than terrestrial.
The MVP mission does not resolve those issues, but it should generate operational data on the foundational constraints: radiation effects, thermal behavior, processor reliability, power availability and the feasibility of serving simple AI inference requests from orbit.
“If, five years from now, everything we’ve done has worked perfectly, it probably means we’ve not taken enough risk and we’ve not learned as much as we could,” Mr. Beals said. “If we’re really successful with this in the long run, this will ultimately be boring and people won’t think anything at the fact that their Gemini query might be getting served in space.”
References:
https://www.nytimes.com/2026/09/24/technology/google-suncatcher-ai-data-center-space.html
China Mobile and Huawei Turn High-Speed Railway 5G-A into a Premium Service
Introduction:
China Mobile may have found a credible way to monetize 5G which has been one of the most persistent commercial problems for mobile network operators. The China state backed carrier aims to turn a 5G Advanced network into a consumer service Chinese people will pay for. On China’s Beijing–Shanghai high-speed railway, where trains operate at up to 350 km/h, China Mobile and Huawei have deployed a 5G-Advanced (5G-A) [1.] architecture that goes beyond coverage and peak-rate claims. The network is designed to identify passengers travelling aboard the train, differentiate them from users located near the rail corridor, recognize application-level performance requirements, and allocate radio and core-network resources accordingly.
Note 1. 3GPP & ITU-R Standardization Status: 5G-Advanced, incorporating enhancements from 3GPP Release 18 (the initial 5G-Advanced baseline), was included in the latest revision of Recommendation ITU-R M.2150-3 [IMT 2020 RIT/SRITs], which was approved in February 2026 as the latest 5G RAN standard.
3GPP Release 19 carries the official 5G-Advanced logo and introduces a wide array of advanced features and functional enhancements that expand upon Release 18, but it has not yet been contributed to ITU-R WP5D. That’s because ATIS and other 3GPP organizational partners are aligning upcoming submission timelines around the broader IMT-2030 (6G) guidelines. Release 19 functions as a transitional bridge. Elements of Release 19, alongside upcoming Release 20 studies, are being packaged as part of the broader baseline evaluation requirements leading up to the major IMT-2030 tech proposal window
……………………………………………………………………………………………………………………………………………………………………
The commercial proposition is straightforward: China Mobile wants to sell a differentiated connectivity experience rather than simply another nominal speed tier.
China Mobile’s 5G-A High-Speed Rail Premium Package effectively creates a premium service class within the public mobile network. According to China Mobile and Huawei, subscribers can receive data rates two to three times higher than those available through standard packages, particularly for latency-sensitive and bandwidth-intensive services such as video conferencing, livestreaming, and cloud gaming.
That makes the Beijing–Shanghai deployment more than an ambitious coverage project. It is an effort to operationalize contextual, application-aware quality differentiation at consumer scale.
Reliable connectivity aboard a train moving at 350 km/h is inherently difficult. Devices traverse cells rapidly, driving frequent handovers, while large numbers of passengers compete for capacity within a highly challenging RF environment. A train carriage also presents substantial propagation constraints: passengers are concentrated in a metal enclosure, and demand tends to be synchronized around high-bandwidth applications.
China Mobile has deployed dedicated capacity along the route using 2.6-GHz 8T8R and 700-MHz spectrum within a three-carrier 5G-Advanced network. Neither band is inherently unique. U.S. operators, for example, use 700-MHz low-band spectrum and hold substantial spectrum near 2.5 GHz. The distinctive element is China Mobile’s integration of those bands into a dedicated high-speed rail mobility architecture, combined with AI-assisted passenger classification and service prioritization.
China Mobile says that multiband load balancing, carrier aggregation, and Huawei’s train-specific power-adaptation technology improved perceived uplink performance by 38.5% and downlink performance by 9.5%. Those figures are vendor- and operator-reported measurements, rather than independently verified results, but they illustrate the priority placed on uplink and experience consistency as well as headline downlink rates. More important than the additional radio capacity, however, is the control layer built above it.

China Mobile and Huawei use AI on the Beijing–Shanghai high-speed rail line to sell premium 5G service, turning network control into revenue. (Source: Google Gemini)
…………………………………………………………………………………………………………………………………………………………………………..
The network identifies the passenger context:
China Mobile says it has integrated AI inference into the 5G core’s Network Data Analytics Function, or NWDAF. The system evaluates approximately three minutes of user mobility data—including speed, base-station transitions, and network topology—to determine whether a subscriber is travelling aboard the high-speed train or simply using the public network in proximity to the railway.
China Mobile claims that the system identifies high-speed rail passengers with more than 95% accuracy. Once a user has been classified as a railway passenger, the network can modify frequency-selection priorities to retain that subscriber on dedicated rail capacity while moving conventional public-network users to alternative resources.
The operator says that, at typical base stations, as many as 60% of non-rail users can be migrated off the rail-focused network layer.
That changes the network’s role. Rather than simply transporting packets across available capacity, the system interprets user context and uses that inference to make policy decisions about radio and core-network resource allocation.
In practical terms, the network is attempting to distinguish between two users who may be physically close to one another but have very different connectivity requirements:
This is a more sophisticated model than conventional consumer traffic management. The policy is not based solely on a static premium plan or a generic QoS marking. It is informed by mobility context, location, network topology, and application behavior.
From capacity to application experience:
China Mobile says its NWDAF can detect deteriorating application performance and dynamically establish dedicated guaranteed-bit-rate bearers for eligible subscribers and services.
In 2025, the company said the system could accelerate 27 applications across five categories. It now says that capability has expanded to 55 applications in six categories, including multistream acceleration for short-form video and livestreaming services.
Intelligent processing within the radio network adds a further control layer. China Mobile and Huawei describe millisecond-level optimization of rate, latency, power, and carrier selection for specific users and services.
The result begins to resemble an intelligent service-delivery platform rather than a conventional mobile broadband network.
That distinction matters because mobile operators have spent years seeking a viable monetization model for 5G capabilities such as network slicing, deterministic performance, differentiated QoS, and application-aware service delivery. Selling another increment of nominal speed to a subscriber who can already stream video without difficulty is not especially compelling. Selling a reliable, business-grade experience for a video meeting during a high-speed journey between Beijing and Shanghai is easier to understand—and potentially easier to monetize.
One proposition is additional bandwidth. The other is confidence that an important application will work when it matters.
China Mobile’s service branding reinforces that distinction. Premium subscribers receive a dynamic China Mobile HSR VIP logo on their devices, making the service tier visible as well as functional.
Why rail is a useful proving ground:
Railway environments are particularly suitable for testing this model because the value of performance differentiation is immediately apparent. A passenger trying to participate in a video conference, upload files, livestream, or access a cloud application does not particularly care whether the underlying network is branded as 5G, 5G-Advanced, or eventually 6G. The relevant question is whether the service works reliably.
That is why the Beijing–Shanghai deployment may have significance beyond China.
In the United Kingdom, Ofcom reported in June that mobile service was poor in between 58% and 83% of train tests, depending on the operator. Its benchmark for a good connection was modest: 5 Mbit/s downlink, 1.5 Mbit/s uplink, and latency of no more than 50 milliseconds—sufficient for an acceptable video call. Ofcom reported in June that those conditions frequently were not met.
China Mobile is using AI to determine which passenger’s video call should receive priority. Britain is still working to ensure that the connection is available at all.
London provides an instructive counterpoint. The Elizabeth line initially opened without mobile coverage. Transport for London now says that all Elizabeth line stations have 4G coverage and tunnel sections have both 4G and 5G coverage. The lesson is not that advanced, differentiated services are unnecessary. It is that the industry must first solve the basic infrastructure problem before it can credibly commercialize higher-value connectivity tiers.
China Mobile has moved beyond that initial engineering threshold. Its question is: what services become commercially viable once connectivity is reliable enough to manage and differentiate?
A broader 5G monetization model:
A search for comparable deployments did not identify another commercial rail service that combines 5G-Advanced, AI-based passenger identification, application-level performance detection, and premium consumer service differentiation in quite the same way.
Other railway initiatives are progressing, but generally toward a different goal. Germany, for example, is testing 5G standalone for railway communications, with an emphasis on the Future Railway Mobile Communication System, or FRMCS. In 2025, Deutsche Bahn began testing what Fierce Network described as the world’s first 5G-based FRMCS deployment on live outdoor tracks. The trial is focused on establishing next-generation railway communications capabilities.
The contrast is useful as per this table:
Both are valid applications of 5G. They address different buyers, operating models, and value chains.
Mobile operators have historically sold relatively blunt consumer products: minutes, messages, data allowances, and broad speed tiers. Fifth-generation networks promised more precise commercial tools, including slicing, service assurance, policy control, and differentiated quality. Translating those tools into consumer propositions has proved difficult, although the model has been more successful in industrial and enterprise deployments.
I saw one version of that industrial model at the East-West Gate intermodal terminal in Hungary, where Huawei private 5G provides the uplink capacity, reliability, and guaranteed latency required to automate railway logistics. The Beijing–Shanghai deployment applies a related technical proposition to a very different customer: the passenger.
That makes 5G’s consumer value proposition more tangible.
Huawei’s responses to FNTV’s questions on the case study are revealing. Additional spectrum and capacity establish the baseline experience; AI-based profiling and intelligent radio processing then provide the fine-grained resource management that improves it. Put simply: capacity creates the network, while control creates the product.
That distinction will become more important as operators seek to prevent connectivity from becoming a commodity.
Hyperscale cloud providers built highly profitable businesses in part by layering proprietary software, orchestration, and operational control above broadly available infrastructure. Telecom operators own valuable assets—licensed spectrum, radio access networks, transport, core networks, and increasingly distributed compute—but have struggled to translate those assets into differentiated, higher-margin services.
An intelligent mobile network provides a potential route forward.
T-Mobile has described a related direction in its own 5G standalone evolution, with AI moving from the cloud into the core and orchestration extending across core, radio, and device layers. T-Mobile executives described how AI is moving into its 5G standalone core. The underlying principle is similar: as operators gain more real-time intelligence and control across network domains, they can potentially tailor network behavior to individual customers, devices, applications, and contexts.
The operator owns the spectrum, operates the RAN, and controls the core. Increasingly, software and AI can determine how those assets behave for a particular subscriber or service. That control may have commercial value.
The commercial test remains ahead:
The deployment still raises important questions. The performance data supplied to FNTV are China Mobile and Huawei measurements and have not been independently verified. More significantly, the ultimate test is commercial: will subscribers consistently perceive enough difference in quality, reliability, and application performance to pay for premium treatment over time?
That said, the underlying proposition is credible. For frequent business travellers, reliable application performance during a high-speed rail journey is materially more valuable than an abstract claim of higher peak throughput.
I have covered railway communications ranging from Huawei’s private 5G deployment at Hungary’s East-West Gate terminal to the decidedly less futuristic reality of a German railway disruption linked to legacy 2G dependence in 2026. China Mobile is pushing the question one stage further: what happens after baseline connectivity becomes reliable?
The network becomes programmable. Then context-aware. Then intelligent. Finally, it becomes commercial. At 350 km/h between Beijing and Shanghai, China Mobile is beginning to demonstrate what that progression could look like. The route to 5G revenue may not be selling passengers a nominally faster network. It may be selling them a materially better journey.
Also see: GSMA Foundry — China Mobile case study: “Connecting High-Speed Rail Passengers”
…………………………………………………………………………………………………………………………………………………………………..
References:
https://www.fierce-network.com/wireless/china-mobile-takes-express-train-5g-revenue
https://www.gsma.com/get-involved/gsma-foundry/gsma_resources/connecting-high-speed-rail-passengers-china-mobile/ – Primary case-study source for the AI algorithm in the packet core, passenger identification, high-speed-rail connectivity optimization, and the broader China Mobile deployment concept
“China Mobile and Huawei Team Up to Launch AI-Powered 5G-A …” – Secondary coverage describing the reported architecture as a combination of a dedicated high-bandwidth 5G-A network for high-speed rail, an AI-native core, and intelligent network-management functions.
China Mobile & ZTE use digital twin technology with 5G-Advanced on high-speed railway in China
Nokia & Deutsche Bahn deploy world’s first 1900 MHz 5G radio network meeting FRMCS requirements
ZTE and China Telecom: 5G network test on a high speed train; Uplink enhancement FAST verification
KDDI, Samsung: 28GHz surveillance video call on train platform using 5G base station
Google’s Internet Access for Emerging Markets – Managed WiFi Network for India Railways
The AI Infrastructure Build-Out: A $10 Trillion Bet on Compute, Power, and Networks
Verizon offers free online AI training tailored to your interests!
Verizon has launched an online portal that curates AI training content from several tech giants, including IBM, Google, Microsoft, Anthropic, OpenAI, and online course provider Coursera. The U.S.’ largest wireless carrier by subscriber count says that the type of courses on offer normally cost in the region of $700 per year, but it is making them available for free.
“Strengthening the American economy starts with making sure every individual has the opportunity to adapt and succeed in a rapidly changing world. AI isn’t just a technological shift – it will change the face of every workforce around the world,” said Verizon CEO Dan Schulman.
“Companies, working closely together and with the public sector, have a responsibility to invest in people with the same urgency they invest in technology. By giving people and small businesses free access to the best AI training, we are helping workers retain their jobs, navigate transitions, support their families, and help small businesses grow – while building confidence in our American economy. When you empower people to embrace change rather than fear it, you create a ripple effect that builds healthier communities and a stronger and more resilient national economy.”

Linked to this initiative is a separate $1 million grant that Verizon has awarded to the Liberty Science Center (LSC) in Jersey City, New Jersey. The funds will be spend on providing practical AI skills to individuals and small businesses.
“As a company with a strong footprint in New Jersey, Verizon is deeply committed to supporting the communities we call home, and our longstanding partnership with Liberty Science Centre is a cornerstone of that commitment,” said Donna Epps, chief responsible business officer of Verizon. “Verizon and LSC have a shared vision of empowering the learners and leaders of tomorrow, and we’re excited to work together to create programming that evokes curiosity for new technologies for educators, families and students from across the state.”
The non-profit “Centre for Humane Technology (CHT)” – co-founded by ex-Googler Tristan Harris – has published a report (PDF) explaining how AI could damage everything from personal relationships to governments, and -most significantly- the workplace.
References:
https://www.verizon.com/ai-skills/home
The AI Infrastructure Build-Out: A $10 Trillion Bet on Compute, Power, and Networks
Dell’Oro: 2H2026 Data Center Capex to Accelerate due to massive AI Deployments
PwC: Global AI data center spending to hit $31.6tn by 2050; Role of full stack orchestration layer explained
Nvidia CEO Huang: AI is the largest infrastructure buildout in human history; AI Data Center CAPEX will generate new revenue streams for operators
AI risks and backlash increase; Recap of the circular loop of fake AI profits and hyperscaler markups of private AI companies
China vs U.S.: Race to Generate Power for AI Data Centers as Electricity Demand Soars
How will fiber and equipment vendors meet the increased demand for fiber optics in 2026 due to AI data center buildouts?
Expose: AI is more than a bubble; it’s a data center debt bomb
Will billions of dollars big tech is spending on Gen AI data centers produce a decent ROI?
Huge Risks for the proposed $500B AI Investments from Giant Wall Street firms
Can the debt fueling the new wave of AI infrastructure buildouts ever be repaid?
Analysis: Cisco, HPE/Juniper, and Nvidia network equipment for AI data centers
Networking chips and modules for AI data centers: Infiniband, Ultra Ethernet, Optical Connections
The AI Infrastructure Build-Out: A $10 Trillion Bet on Compute, Power, and Networks
Introduction:
According to the Wall Street Journal, the AI build-out is rapidly becoming the largest concentrated infrastructure investment cycle in modern American economic history. Unlike earlier national build-outs—railroads, interstate highways, electrification, or the commercial internet—this cycle is being driven largely by a small group of cloud platforms deploying highly specialized compute, networking, power, cooling, and semiconductor infrastructure at unprecedented speed. Economist Stijn van Nieuwerburgh estimates that U.S. spending on data centers and related AI infrastructure could reach $10.3 trillion [1.] between 2025 and 2032, equivalent to an average of 3.6% of annual GDP. The estimate encompasses far more than conventional enterprise data centers: it reflects the industrial-scale infrastructure needed to train and serve frontier AI models, including GPU and accelerator clusters, high-bandwidth memory, advanced packaging, optical interconnects, high-capacity Ethernet and InfiniBand fabrics, grid interconnection, substations, backup generation, liquid cooling, and long-haul fiber connectivity.
Note 1. The $10.3 trillion number is a scenario-based estimate of U.S. AI infrastructure investment during 2025–2032—not a forecast of announced corporate spending. The Brookings analysis behind it assumes that about 183 GW of new data-center capacity will be completed through 2032, versus a 509-GW announced/planned pipeline. A representative 200-MW AI campus is estimated to cost about $8.2 billion: $5.6 billion for IT equipment, $2.2 billion for the facility, and $0.4 billion for power infrastructure. Thus, most of the investment is in compute and networking hardware rather than buildings.
The scale creates a major financing challenge: the five largest hyperscalers are projected to spend about $800 billion on capex in 2026, exceeding their combined operating cash flow. Under the Brookings assumptions, the resulting infrastructure would need roughly $3.7 trillion of annual revenue by 2032 to produce a 10% unlevered return. The key economic issue, therefore, is whether future AI revenue and utilization can justify the enormous capital investment.
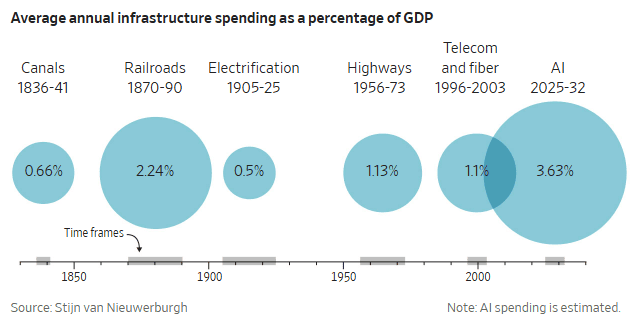
From Cloud Data Centers to AI Factories:
The defining characteristic of this AI buildout investment cycle is its concentration. The five U.S. hyperscalers (Alphabet, Amazon, Meta, Microsoft, and Oracle) are collectively expected to invest roughly $4.2 trillion in capital expenditures during the four years ending in 2029, according to FactSet estimates cited in the source material. Increasingly, this capital is directed toward AI-optimized facilities: campuses designed around megawatt-scale accelerator pods, dense GPU clusters, high-radix network fabrics, and power delivery systems capable of supporting workloads whose energy and cooling profiles differ sharply from those of traditional cloud computing.
Those five major hyperscalers increased combined capital expenditures from approximately $97 billion in 2020 to more than $400 billion in 2025, with the paper projecting approximately $800.5 billion in 2026. That 2026 figure is significant because it exceeds their combined operating cash flow of approximately $707.1 billion. In other words, projected capex is about 113% of operating cash flow. Pacific Software Ventures That creates a MAJOR financing problem: AI infrastructure investment is becoming too large to be financed entirely from hyperscaler internally generated cash.
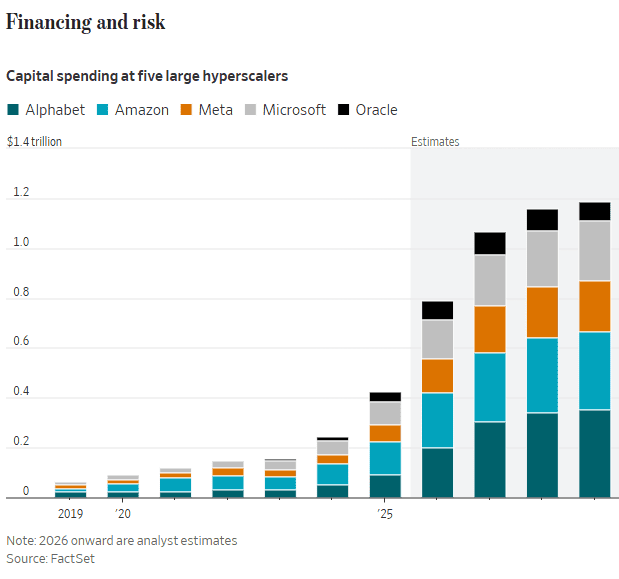
AI infrastructure is not simply an expansion of conventional cloud capacity. Large-model training and inference create a distinct systems-engineering problem. Training AI frontier foundation models requires thousands to hundreds of thousands of tightly coupled accelerators. Those accelerators must exchange model parameters, activation data, and gradients at extremely high rates. Network performance therefore becomes a first-order determinant of usable compute capacity. A GPU cluster can deliver poor economics if its fabric introduces congestion, latency, packet loss, or inadequate bisection bandwidth during distributed training.
That requirement is accelerating deployment of:
-
GPU- and AI-accelerator servers with high-bandwidth memory and advanced semiconductor packaging.
-
High-speed scale-up interconnects within accelerator nodes and scale-out fabrics across clusters.
-
400 GbE, 800 GbE, and emerging 1.6 TbE Ethernet architectures, along with InfiniBand deployments for tightly coupled training environments.
-
Optical transceivers, co-packaged optics research, photonic switching, and expanded fiber density within and between data-center campuses.
-
AI-aware workload scheduling, distributed storage, data pipelines, checkpointing systems, and network telemetry.
-
Direct-to-chip liquid cooling, rear-door heat exchangers, chilled-water systems, and other thermal-management systems required by high-density AI racks.
-
New transmission lines, substations, transformers, gas generation, battery systems, and other power infrastructure needed to support multi-hundred-megawatt and gigawatt-scale campuses.
In effect, hyperscalers are building what are increasingly described as AI factories: integrated physical and digital production systems that convert electricity, capital equipment, data, and semiconductor capacity into trained models, inference tokens, and AI-enabled cloud services.
A Historically Large Capital Concentration:
AI investment is projected to reach 1.9% of U.S. GDP in 2026, according to Goldman Sachs estimates cited in the source material. The late-19th-century railroad boom was the last period in which a single new infrastructure category represented a larger share of the U.S. economy.
The comparison is useful, but incomplete. Railroads connected physical markets over decades. The AI build-out is being deployed on a far more compressed timetable and is dependent on global supply chains for leading-edge accelerators, high-bandwidth memory, advanced substrates, optical components, power equipment, and data-center construction capacity.
This creates a reinforcing investment loop:
-
Foundation-model developers require more compute to train larger or more capable models.
-
Cloud providers build additional accelerator capacity to support training and inference demand.
-
Semiconductor vendors, memory suppliers, networking companies, optical-component manufacturers, and power-equipment suppliers expand production.
-
Data-center developers secure land, power contracts, grid interconnections, fiber routes, water or cooling capacity, and financing.
-
Enterprises adopt AI services, increasing inference demand and reinforcing hyperscaler investment.
The strategic question is whether revenue from AI applications, enterprise subscriptions, API usage, advertising optimization, software agents, automation, and industry-specific deployments will scale fast enough to justify the capital intensity of the underlying infrastructure.
Financial and Infrastructure Risks:
The scale of investment introduces material financial-system risk. A growing portion of AI-related infrastructure is being financed through debt, including special-purpose entities and off-balance-sheet structures that may have limited public disclosure. These structures can allow technology companies and infrastructure developers to finance data-center construction, equipment purchases, and long-term capacity commitments without placing all obligations directly on corporate balance sheets.
That can be economically rational when capacity utilization is high and long-term AI demand is durable. However, it also creates exposure if expected AI revenues, cloud bookings, or accelerator utilization fail to materialize.
The central risk is not merely that an individual model underperforms. It is that a synchronized reduction in AI capital expenditure could affect multiple interconnected sectors at once:
-
Data-center developers and construction firms.
-
Semiconductor, memory, storage, and server suppliers.
-
Optical networking and switching vendors.
-
Utilities, independent power producers, and grid-equipment manufacturers.
-
Banks, private-credit funds, infrastructure lenders, and equipment-finance providers.
-
Commercial real-estate markets in data-center-heavy regions.
A sudden pause in hyperscaler spending would therefore have broader consequences than a typical technology downcycle. It could reduce orders across a deeply interdependent industrial supply chain while exposing leveraged infrastructure vehicles to weaker cash flows.
IT Product Inflation, Power, and Network Capacity:
The AI build-out is also creating supply-side pressure in strategic technology markets. Demand for data-center equipment—especially memory, advanced semiconductors, servers, optics, and power-delivery equipment—has tightened supply and raised costs. The source material notes that prices paid by importers for computers, peripherals, and semiconductors were 20% higher in August than a year earlier.
That inflation can propagate beyond the data center. Higher component prices can increase the cost of consumer electronics, including smartphones, PCs, gaming systems, and storage products. Enterprises may also face higher prices for servers, networking equipment, cloud services, and AI-enabled software.
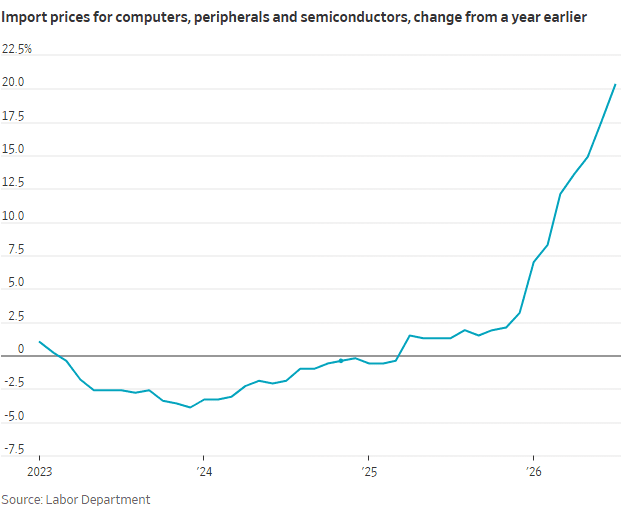
Power is an equally important constraint. AI data centers concentrate demand geographically, often creating large and relatively inflexible new loads on regional grids. A single large campus may require hundreds of megawatts, while the next generation of AI campuses could require gigawatt-scale capacity. This is driving demand for new generation, transmission capacity, substations, transformers, energy storage, and grid-management technologies.
The result is a collision between digital infrastructure planning and energy-system planning. Data-center capacity is no longer determined primarily by real estate, fiber connectivity, or server availability. In many markets, the gating factor is now the ability to obtain firm power, complete interconnection studies, procure transformers and switchgear, and finance new grid infrastructure.
Conclusions:
For IEEE Techblog readers, the central issue is not whether AI demand is real. It is whether the industry can build an economically sustainable, energy-efficient, resilient, and interoperable infrastructure stack at the required scale.
That challenge spans multiple engineering domains:
-
Semiconductor architecture, packaging, memory bandwidth, and energy efficiency.
-
Data-center electrical design, cooling, rack density, and operational resiliency.
-
High-performance networking, congestion control, optical interconnects, and distributed-system design.
-
AI software optimization, including model efficiency, quantization, sparsity, scheduling, and inference optimization.
-
Grid integration, power electronics, demand response, and energy-aware workload placement.
-
Security, supply-chain assurance, and operational management across increasingly autonomous infrastructure.
The AI boom may indeed become the defining infrastructure investment cycle of this era. Its long-term success, however, will depend less on headline capital-expenditure totals than on whether the industry can translate massive spending on accelerators and data centers into durable productivity gains, commercially viable AI services, and infrastructure that does not impose unsustainable costs on power systems, supply chains, consumers, or the financial sector.
………………………………………………………………………………………………………………………………………………
References:
Dell’Oro: Data Center capex grew 92% in 2Q-2026 (caveats galore)
Dell’Oro: 2H2026 Data Center Capex to Accelerate due to massive AI Deployments
PwC: Global AI data center spending to hit $31.6tn by 2050; Role of full stack orchestration layer explained
Nvidia CEO Huang: AI is the largest infrastructure buildout in human history; AI Data Center CAPEX will generate new revenue streams for operators
AI risks and backlash increase; Recap of the circular loop of fake AI profits and hyperscaler markups of private AI companies
China vs U.S.: Race to Generate Power for AI Data Centers as Electricity Demand Soars
How will fiber and equipment vendors meet the increased demand for fiber optics in 2026 due to AI data center buildouts?
Expose: AI is more than a bubble; it’s a data center debt bomb
Will billions of dollars big tech is spending on Gen AI data centers produce a decent ROI?
Huge Risks for the proposed $500B AI Investments from Giant Wall Street firms
Can the debt fueling the new wave of AI infrastructure buildouts ever be repaid?
Sept 2026 3GPP meeting updates for 5G Advanced and 6G planning (with timeline for submisson to ITU-R WP 5D via ATIS)

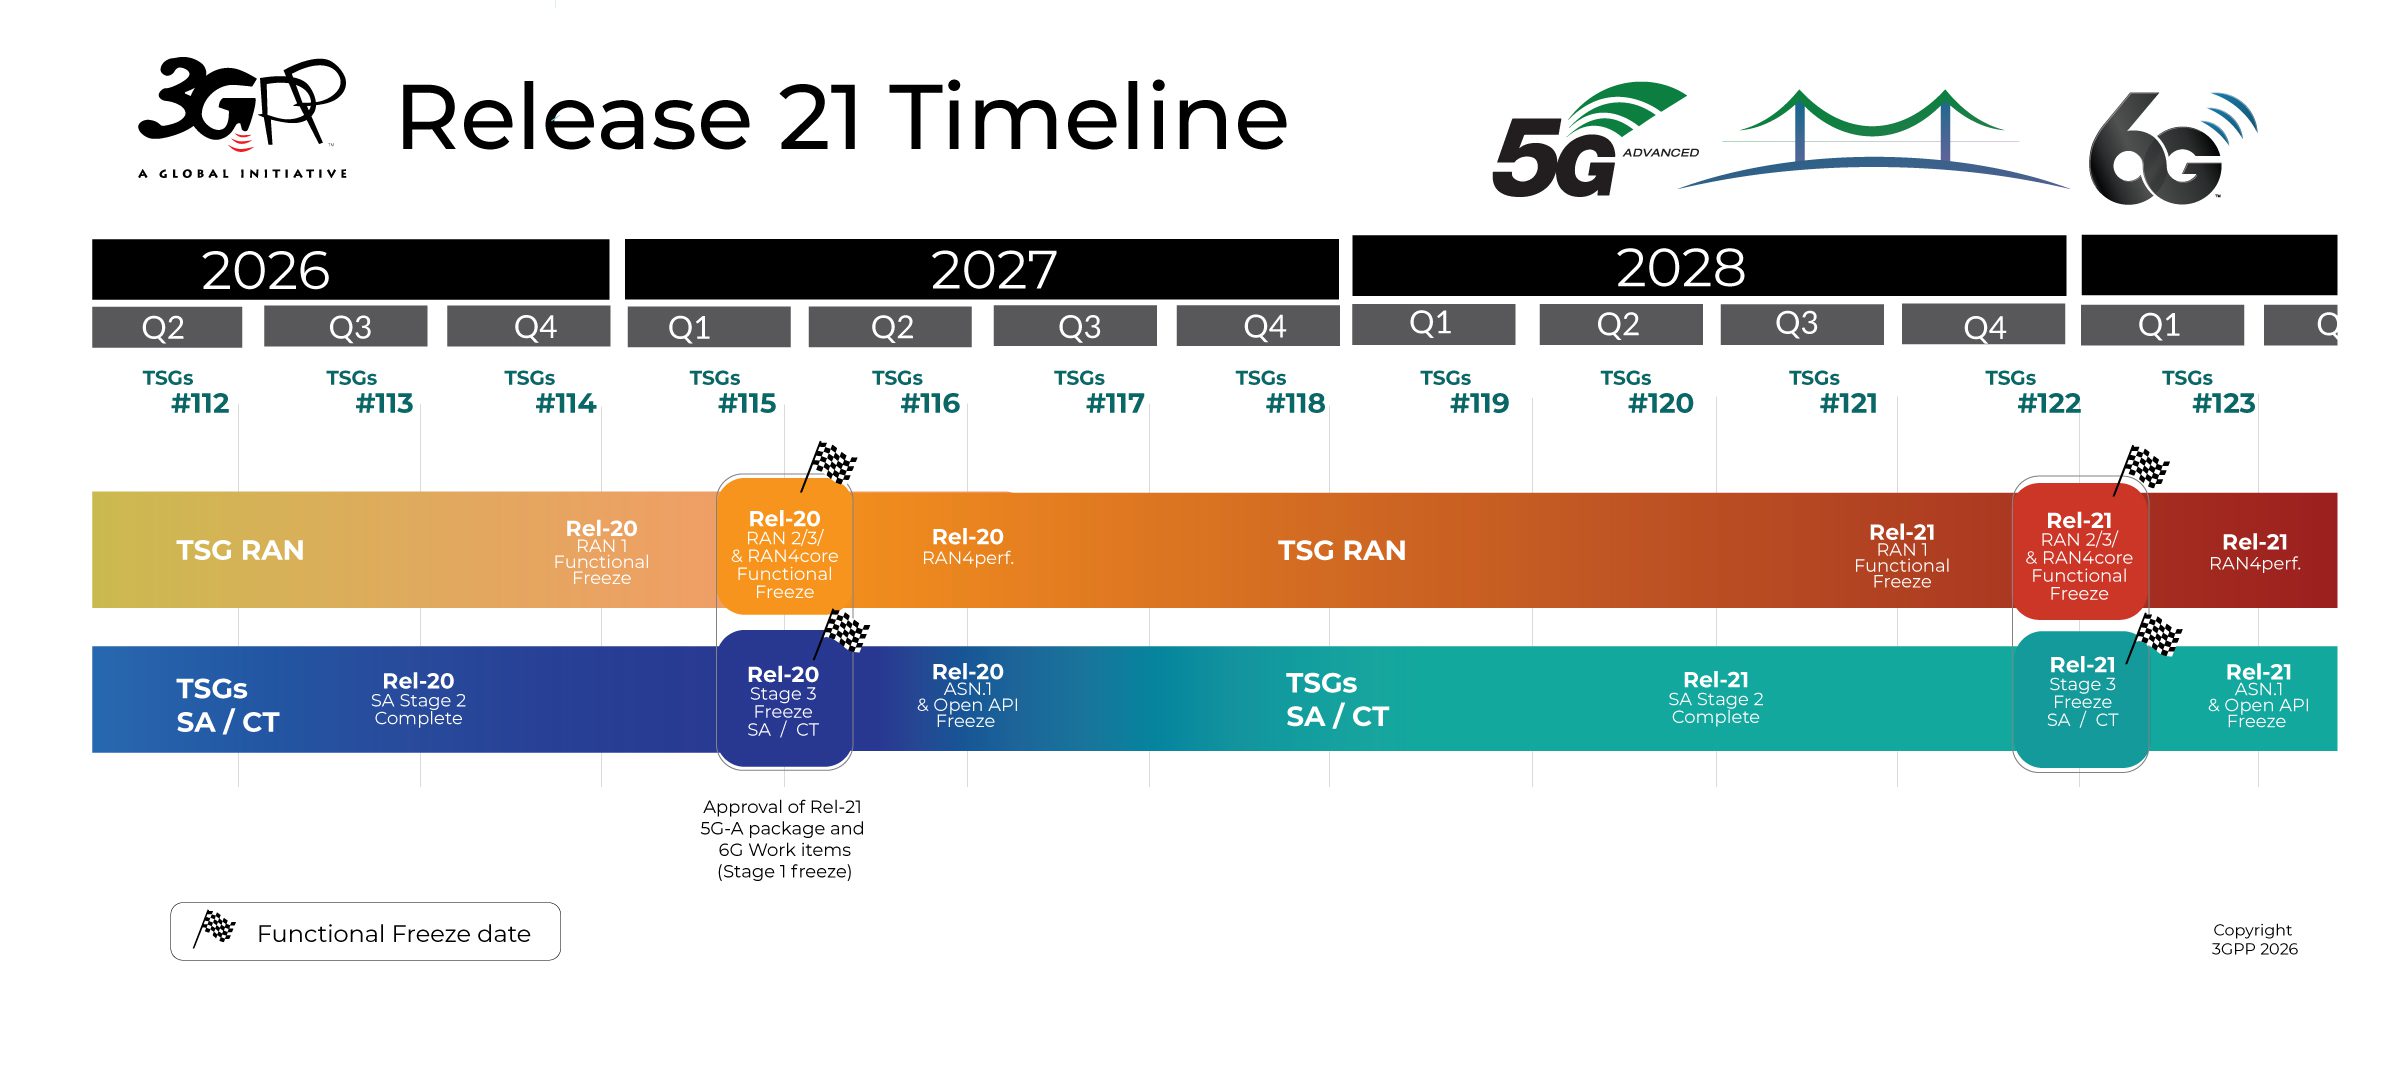
- 100% Stage 2 Freeze: The primary technical output for Release 20 was hitting the 100% completion target for Stage 2 (System Architecture). This officially locks down the architectural aspects for 5G Advanced next wave, transitioning the bulk of execution entirely to Stage 3 protocol and core implementation.
- 6G Dual Connectivity Way Forward: Delegates finalized critical deployment decisions regarding how 6G will integrate with existing infrastructure. Focus solidified around Option 1 (6G-anchored dual connectivity with 5G NR) and Option 3 (Dual stack, no RAN-level aggregation).
- Multi-RAT Spectrum Sharing (MRSS): RAN1 delivered its highly anticipated MRSS preliminary performance evaluation. This evaluates the overhead costs of operators running 5G and 6G simultaneously on the same frequencies, safeguarding migration investments.
- Use Cases and Services: Deepened studies into Integrated Sensing and Communications (ISAC), native AI/ML network applications, and ubiquitous connectivity (“anywhere to everywhere”).
- Radio Advancements: Maturation of the 6G RAN study on Scenarios and Requirements (TR 38.914), steering the industry closer to initial physical layer specifications.
……………………………………………………………………………………………………………………………………………………………….
-
- Dual Connectivity Framework: Delegates officially locked down the deployment pathways for the first phase of 6G. They established a clear consensus favoring Option 1 (6G-anchored dual connectivity with 5G NR) and Option 3 (Dual stack/independent radio lines), settling intense architectural debates on how 6G will overlay on 5G infrastructure.
- MRSS Performance Baseline: RAN1 finalized its preliminary performance evaluations for Multi-RAT Spectrum Sharing (MRSS). This technical milestone establishes the exact overhead margins required to run 5G and 6G simultaneously on legacy bands, preventing spectral efficiency loss during the transition.
- TR 38.914 Technical Alignment: The radio groups finalized the foundational baseline for the Radio Scenarios and Requirements report (TR 38.914), updating propagation channel models to explicitly match the new spectrum ranges targeted for initial Release 21 designs.
- ISAC Requirements Progression: SA2 finalized early system-level flows for Integrated Sensing and Communications (ISAC), formalizing how a 6G network will dynamically allocate base station radio energy to double as radar mapping infrastructure.
-
- Initial Framework Alignment (Mid-2027): ATIS will submit the early Release 21 architectural structures and capability definitions resulting from these choices to the 55th meeting of WP 5D. This acts as an initial informational contribution to show compliance with the IMT-2030 (6G) Framework.
- Formal Candidate Technology Submission (Late 2028 / Early 2029): Once these 2026 foundational agreements are fully written into frozen protocol code during the December 2028 Stage 3 Freeze, ATIS will package them into a formal “Candidate RIT (Radio Interface Technology)” proposal.
- The Absolute Cutoff: This complete compliance package and its accompanying technical self-evaluation will be submitted directly ahead of the 59th meeting of WP 5D in February 2029, which is the final deadline for IMT-2030 candidate evaluations.
References:
https://www.3gpp.org/news-events/3gpp-news/ran113-reports
https://portal.3gpp.org/?tbid=373&SubTB=373#/
Roles of 3GPP and ITU-R WP 5D in the IMT 2030/6G standards process
Comparing AI Native mode in 6G (IMT 2030) vs AI Overlay/Add-On status in 5G (IMT 2020)
ITU-R WP5D IMT 2030 Submission & Evaluation Guidelines vs 6G specs in 3GPP Release 20 & 21
ITU-R M.[IMT-2030.EVAL] & ITU-R M.[IMT-2030.SUBMISSION] reports: Evaluation & Submission Guidelines for 6G RIT/SRITs (6G)
ITU-R WP5D invites IMT-2030 RIT/SRIT contributions
How NTIA “Call to Action for 6G Leadership and Security” might influence 6G/IMT-2030 standards and 3GPP specifications
NGMN issues ITU-R framework for IMT-2030 vs ITU-R WP5D Timeline for RIT/SRIT Standardization
IMT-2030 (“6G”) Minimum Technology Performance Requirements for Radio Interface Technologies
IMT-2030 Technical Performance Requirements (TPR) from ITU-R WP5D