Fixed Wireless Access (FWA)
Dell’Oro: Fixed Wireless Access revenues +10% in 2025 & will continue to grow 10% annually through 2029
Additional highlights from the Fixed Wireless Access Infrastructure and CPE Advanced Research Report:
- Total FWA subscriptions, which include residential, SMB, and large enterprises, are expected to grow steadily, surpassing 191 million by 2029.
- 5G Sub-6GHz and mmWave units will dominate the global residential CPE market.
The Dell’Oro Group Fixed Wireless Access Infrastructure and CPE Report includes 5-year market forecasts for FWA CPE (Residential and Enterprise) and RAN infrastructure, segmented by technology, including 802.11/Other, 4G LTE, CBRS, 5G sub-6GHz, 5G mmWave, and 60GHz technologies. The report also includes regional forecasts for FWA subscriptions, including for both residential and enterprise markets, with the enterprise subscriptions segmented by SMB and Large Enterprise. To purchase this report, please contact us by email at [email protected].
………………………………………………………………………………………………………………………………………………………………………
Independent Analysis via Perplexity.ai:


Fixed Wireless Access Schematic Diagrams
……………………………………………………………………………………………………………………………………………………………
Demand-side drivers:
-
Rising demand for high‑speed home and enterprise broadband, including video streaming, gaming, and cloud/SaaS, in areas poorly served by DSL or legacy cable.
-
Customer appetite for quick‑install, no‑truck‑roll broadband that can be activated using wireless CPE instead of waiting for fiber construction.
-
Growing need for reliable connectivity for remote work, distance learning, and SME digitization, especially in suburban and rural regions.
Supply-side / operator economics:
-
Ability to leverage existing 4G LTE macro grids and sub‑6 GHz spectrum, with incremental capex mainly in CPE and software rather than full new access builds.
-
Refarming of LTE spectrum and overlay of 5G NR on the same bands allows operators to run both mobile broadband and FWA on a common RAN/core.
-
Attractive ROI relative to fiber in low‑density areas, since one macro site at sub‑6 GHz can cover large rural or ex‑urban footprints.
Technology and spectrum factors (4G & sub‑6 GHz 5G):
-
4G LTE coverage ubiquity: years of investment mean LTE already reaches most urban, suburban, and many rural markets, making LTE‑FWA immediately deployable.
-
Sub‑6 GHz 5G propagation: better penetration through buildings and walls than higher bands, enabling more reliable indoor FWA without extensive outdoor CPE alignment.
-
Massive MIMO and beamforming on sub‑6 GHz bands increase sector capacity and improve non‑line‑of‑sight performance, which is critical for FWA quality at cell edge.
Competitive and regulatory drivers:
-
Mobile operators using FWA to attack cable and DSL bases; in several markets FWA contributes a high share of net broadband additions, pressuring incumbents on price and speed.
-
Government rural‑broadband programs and subsidies (e.g., U.S. RDOF‑type initiatives) encourage use of FWA as a cost‑effective tool to close the digital divide.
-
Regulatory allocation of additional mid‑band and sub‑6 GHz spectrum (e.g., 3–4 GHz bands) increases usable capacity and supports scaling FWA to millions of homes.
Market growth indicators:
-
FWA market value is growing at double‑digit CAGRs, with 4G still a large share today but 5G FWA projected to dominate new subscriptions by the late 2020s.
-
Sub‑6 GHz FWA gateways and CPE are a rapidly expanding device segment, driven by operator deployments targeting residential and SME broadband.
…………………………………………………………………………………………………………………………………………………………………….
References:
https://www.delloro.com/news/fwa-infrastructure-and-cpe-spending-will-remain-above-10-billion-annually-through-2029/
Fiber and Fixed Wireless Access are the fastest growing fixed broadband technologies in the OECD
Ookla: FWA Speed Test Results for big 3 U.S. Carriers & Wireless Connectivity Performance at Busy Airports
Point Topic: Global Broadband Subscribers in Q2 2025: 5G FWA, DSL, satellite and FTTP
Aviat Networks and Intracom Telecom partner to deliver 5G mmWave FWA in North America
T-Mobile’s growth trajectory increases: 5G FWA, Metronet acquisition and MVNO deals with Charter & Comcast
Dell’Oro: 4G and 5G FWA revenue grew 7% in 2024; MRFR: FWA worth $182.27B by 2032
Latest Ericsson Mobility Report talks up 5G SA networks and FWA
Highlights of Qualcomm 5G Fixed Wireless Access Platform Gen 3; FWA and Cisco converged mobile core network
Ericsson: Over 300 million Fixed Wireless Access (FWA) connections by 2028
New Street Research study: Cable broadband will continue its decline, but total broadband access subscribers will increase
A recent New Street Research broadband trends study suggests that U.S. cablecos (previously called MSOs) aren’t likely to increase the net number of broadband internet subscribers during this decade, but their broadband losses are expected to decrease. The financial market research firm doesn’t anticipate cable broadband subscriber growth to be positive for at least another four to five years. Under New Street’s “base case,” cable broadband net adds will remain negative each year until 2030. Cable broadband is facing fierce competition on the high end from fiber to the premises (e.g. AT&T, Frontier/Verizon) and on the lower end from 5G FWA (e.g. T-MobileUS, Verizon).
Cable “is the new copper,” New Street Research analysts David Barden and Vikash Harlalka wrote, implying declining subscribers for xDSL based broadband will also happen to cablecos. Obviously, cablecos won’t like that characterization given that their hybrid fiber/coax (HFC) networks are mostly comprised of fiber. However, declining subscriber trends is not a commentary about the cable industry’s underlying broadband access network technology.
“With industry growth remaining below pre-pandemic levels and FWA adds remaining strong, we don’t expect Cable to grow subscribers this decade. Cable needs industry growth to improve and FWA adds to slow down to return to growth,” New Street’s analysts write in their 140-page report (subscribers only).
New Street outlines potential scenarios for how cable’s share of the broadband market will look by 2030:
-
Best case scenario – cable has 42% of the market as 84% of the market is divvied up between cable and fiber, while FWA gets 16%.
-
Plausible scenario – cable retains 32% share of the broadband market, with 80% of it being shared with fiber, and FWA capturing 20%.
-
Optimistic scenario – cable captures 50% of the broadband market, fueled by “superior marketing and cheaper mobile bundles,” compared to fiber (41%) and FWA (10%).
New Street expects cable’s “steady state terminal market share” to be just a bit higher than 40% across its footprint, down from 62% today.
The report also takes a look at how cable will fare in markets that overlap with fiber. New Street estimates that 75% of cable markets will have a fiber competitor in the years to come. When combining non-fiber and fiber markets, cable is expected to capture about 41% of the share in their footprints. That compares to fiber (34%), FWA (20%), DSL (2%) and satellite broadband (3%).
It only gets worse for cablecos, as their customer net promoter scores (NPS) [1.] are lower than their competitors (mostly telcos). Using data from Recon Analytics’ weekly survey of about 10,000 respondents, New Street’s study notes there’s a pronounced customer NPS gap for cable against its primary broadband rivals. Customer NPS scores from Comcast (2) and Charter (1) are just above water compared to Cox Communications (-1) and Optimum Communications (-8). Fiber providers are doing much better: AT&T Fiber (25), Verizon Fios (21), Frontier (17) and Lumen Fiber (1). FWA also holds a sizable customer NPS advantage: T-Mobile (31) and Verizon FWA (29).
Note 1. NPS is a customer loyalty metric that measures the likelihood of customers recommending a company to a friend or colleague, using a scale of \(0\)-\(10\). The score is calculated by subtracting the percentage of “detractors” (those who score \(0\)-\(6\)) from the percentage of “promoters” (those who score \(9\)-\(10\)), with “passives” (those who score \(7\)-\(8\)) not being factored into the final score. NPS is a single, easy-to-understand number that ranges from \(-100\) to \(+100\) and is used to gauge customer satisfaction and predict business growth. Customers are asked, “On a scale of \(0\)-\(10\), how likely are you to recommend [company] to a friend or colleague?”
…………………………………………………………………………………………………………………………………………………………………………………………………………………………………………………………..
Considering all types of broadband access, New Street expects total net U.S. broadband net adds of 1.6 million, up from the 1.2 million from an earlier estimate. Fueled by fiber and FWA, net broadband subscriber adds are expected to continue above that level through 2030.
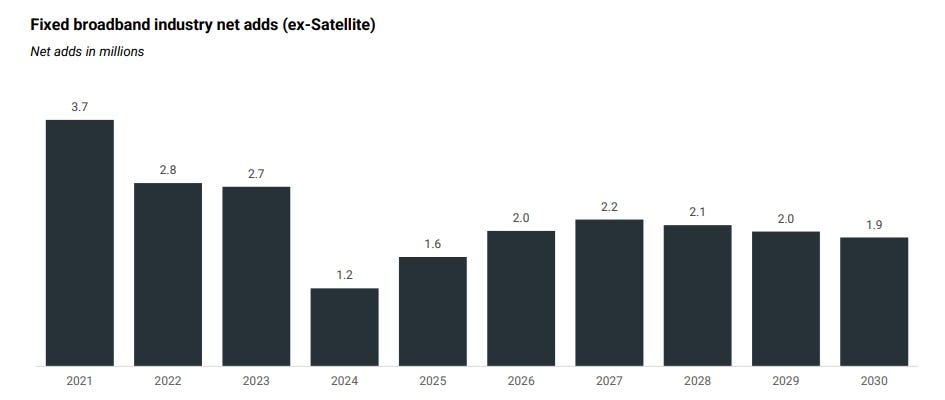
That growth will continue even as the market becomes increasingly saturated. New Street forecasts 139 million Internet households in 2030, up from 133 million at the end of 2025. Broadband penetration is expected to reach 93% by 2030, up from 87.7% at the end of 2025.
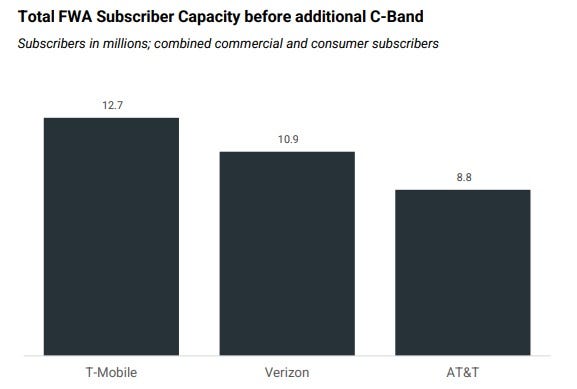
New Street expects U.S. network service providers to have 32 million to 36 million FWA subscribers in the coming years. However, the forecast expects a slight slowdown in FWA sub adds in 2026, coming in just below the range of 3.7 million to 3.8 million seen over the past three years. Next year, New Street expects FWA subscriber adds of 3.6 million (1.7 million for T-Mobile, 1 million for Verizon and 900,000 for AT&T). The analysts estimate that the carriers currently have enough capacity to support about 32 million FWA subs, estimating that carriers have already consumed about 55% of total capacity with new subs. That estimate does not include potential capacity coming from the upcoming auction of upper C-Band spectrum. That auction could provide capacity for another 4 million or so additional FWA subs, New Street said.
- Intense Competition: Cable operators are losing subscribers to FTTH, which offers faster speeds and higher reliability, and FWA services, which often appeal to customers seeking lower-priced or easily installed options.
- Market Saturation and Demographics: The broadband market is becoming increasingly saturated, and a slowdown in new household formation and people moving is curbing a key driver of new broadband connections.
- End of Government Subsidies: The expiration of government programs like the Affordable Connectivity Program (ACP) is impacting subscriber numbers, with major cable operators losing customers who relied on the subsidy.
- Network Upgrades: Cable companies are investing in network upgrades, such as DOCSIS 4.0, to improve speeds and performance, but it is not yet clear if these upgrades will significantly boost subscriber numbers.
Other Analyst Opinions:
- MoffettNathanson sees flattish cable broadband subscriber growth for the next couple of years, with a small gain in 2028. The firm projects subscriber losses in legacy markets will be eventually offset by gains from rural expansions and edge-out builds. “The conclusion for the two [Comcast and Charter] is about the same: even a near worst-case scenario yields roughly flat subscribership over the next five years or so,” Moffett wrote. “That’s a far cry from the doomsday scenarios we typically hear for the bear case.”
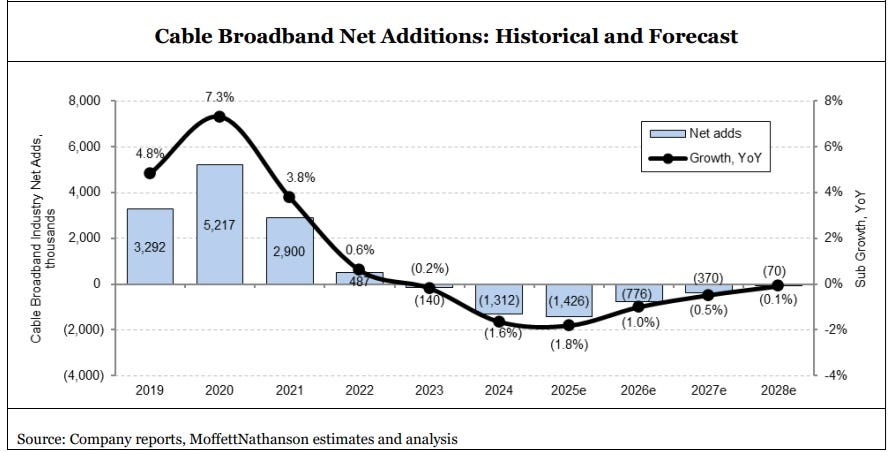
- In February 2025, Wolfe Research estimated that total industry net broadband additions for 2025 would be under 2 million, with cable providers bearing much of the slowdown.
- Grand View Research forecasts the global broadband services market (all connection types) to reach ~ US$ 875 billion by 2030, growing ~ 9.8% per year from 2025. In North America, broadband services revenue is expected to grow at ~ 8.3% CAGR from 2025 to 2030.
- Mordor Intelligence forecasts that the global market for hybrid-fiber coaxial (HFC — the backbone for many cable networks) will grow a 7.6% CAGR from $14.96 billion in 2025 to ~ $21.58 billion in 2030.
- An Ericsson analysis noted a projected decline of around 150 million DSL and cable connections globally between 2024 and 2030, with most growth coming from fiber, FWA, and satellite.
References:
https://www.lightreading.com/cable-technology/ouch-broadband-study-casts-cable-as-the-new-copper-
https://www.lightreading.com/cable-technology/cable-broadband-faces-a-flat-future-not-doomsday
https://telcomagazine.com/top10/top-10-global-fxxt-companies-in-telecoms
Aviat Networks and Intracom Telecom partner to deliver 5G mmWave FWA in North America
Aviat Networks, a wireless transport and access company, today announced a partnership with Intracom Telecom, a global technology systems and solutions provider, to deliver Fixed Wireless Access (FWA) technology using high-capacity 28 and 39 GHz millimeter wave (mmWave) bands, conforming to FCC requirements for mmWave bands intended for 5G use.
Aviat will initially focus on select North American service providers to address the growing need for multi-Gigabit consumer and enterprise 5G use cases as an alternative to the high cost, delays and complexity of using fiber, but with fiber-like performance. In addition, Aviat will offer software solutions along with a comprehensive set of design, planning, deployment and support services thanks to its extensive presence in North America.
Intracom Telecom’s WiBAS G5 platform is the only commercially available point-to-multipoint FWA solution operating in the 28 and 39 GHz mmWave bands that can address the growing demand for high-capacity Fixed Wireless Access, cost effectively delivering over 22Gbps from the same base station site, using Multi-User MIMO and Hybrid Massive Beamforming, over distances of up to 5 miles and more.
“We are very excited at this significant opportunity to extend our wireless expertise to provide advanced mmWave FWA solutions,” Pete Smith, CEO of Aviat Networks said, “Wireless can be deployed rapidly and cost effectively, and is perfectly suited to support high speed connectivity combined with excellent reliability.”
“I am very proud of Intracom Telecom’s R&D team for creating a solution that sets a new benchmark for FWA. Through this strategic partnership with Aviat Networks, we’re excited to help U.S. operators accelerate broadband expansion and deliver a true multi-gigabit experience, and more, over wireless,” said Kartlos Edilashvili, CEO of Intracom Telecom.

Image Source: Aviat Networks
In the U.S., Verizon, AT&T, and T-Mobile (including UScellular‘s retail wireless operations) use 28 GHz and 39 GHz millimeter wave (mmWave) bands for 5G services in densely populated areas and venues. mmWave signal propagation characteristics limit range/coverage and have a high susceptibility to blockage by physical objects and weather. These limitations significantly increase deployment costs and constrain coverage to densely populated areas.
About Aviat Networks:
Aviat, based in Austin, TX, is a leading expert in wireless transport and access solutions and works to provide dependable products, services and support to its customers. With more than one million systems sold into 170 countries worldwide, communications service providers and private network operators including state/local government, utility, federal government and defense organizations trust Aviat with their critical applications. Coupled with a long history of microwave innovations, Aviat provides a comprehensive suite of localized professional and support services enabling customers to drastically simplify both their networks and their lives. For more than 70 years, the experts at Aviat have delivered high performance products, simplified operations, and the best overall customer experience. Aviat is headquartered in Austin, Texas. For more information, visit www.aviatnetworks.com or connect with Aviat Networks on LinkedIn and Facebook.
About Intracom Telecom:
Intracom Telecom is a global technology systems and solutions provider operating for over 45 years in the market. The company is the benchmark in fixed wireless access, and it successfully innovates in the wireless access & transmission field. Furthermore, the company offers a comprehensive software solutions portfolio and a complete range of ICT services. Intracom Telecom serves telecom operators, public authorities and large public and private enterprises. The Group maintains its own R&D and production facilities, operates subsidiaries worldwide and has been active in the North American market since 2001, through its subsidiary, Intracom Telecom USA, based in Atlanta, Georgia. The parent company is located in Athens, Greece. For more information, visit www.intracom-telecom.com
References:
T-Mobile’s growth trajectory increases: 5G FWA, Metronet acquisition and MVNO deals with Charter & Comcast
Dell’Oro: 4G and 5G FWA revenue grew 7% in 2024; MRFR: FWA worth $182.27B by 2032
Latest Ericsson Mobility Report talks up 5G SA networks and FWA
Aviat Sells TIP compliant 5G-Ready Disaggregated Transmission Network to Africell
U.S. Home Internet prices DECLINE amidst fierce competition between wireless carriers and cablecos
Home internet prices in the U.S. are being driven down by fierce competition between mobile carriers offering Fixed Wireless Access (FWA) and cable internet companies offering legacy Hybrid Fiber Coax connections. The increased competition has driven down the cost of home internet service, a welcome break for consumers when prices are rising for many other essential products. The price of home internet service fell 3.1% in May from a year earlier, while the overall consumer-price index rose 2.4%, according to the Labor Department.
The WSJ reports that major home-internet service providers including Verizon VZ, Comcast/Xfinity and T-Mobile launched a flurry of price-lock guarantees, promising steady rates for as long as five years. CableCos Charter, which is acquiring Cox, unveiled a three-year deal last year.
Cable companies have struggled to retain broadband internet subscribers since mobile carriers began offering more affordable 5G fixed-wireless access (FWA) internet service in 2018. FWA, which relies on over the air transmission to cell towers instead of HFC access, brought competition into markets where cable companies had long enjoyed being the only game in town. Now both types of providers are growing more aggressive to attract—and keep—customers.
“The cable companies went from gaining subscribers and raising rates every year to declining subscribers and giving people price locks,” said John Hodulik, a UBS analyst. “They’re seeing churn rise in their broadband subscriber base. And they’re trying to nip that in the bud.” Fixed wireless can sometimes cost half as much as a cable-provided internet plan. Though network congestion and other connectivity issues can be an issue for some users, the lower price point has been luring cable customers away.
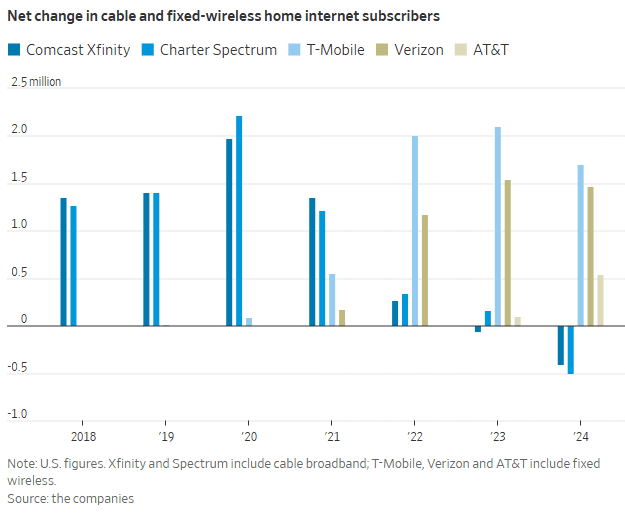
T-Mobile, Verizon and AT&T added a combined 3.7 million FWA customers in 2024. In sharp contrast, Comcast’s Xfinity and Charter’s Spectrum lost more than 900,000 home internet subscribers. That’s depicted in this graph:
“Our pricing wasn’t breaking through in the marketplace,” said Steve Croney, chief operating officer for Comcast’s connectivity and platforms business. He said the company’s five-year price lock, introduced in April, competes well against the telecom companies’ offerings.
Frank Boulben, chief revenue officer at Verizon’s consumer group, said his company has been trying to address the “pain points” customers have with cable companies, such as price hikes. That’s why the telco is emphasizing FWA vs its FiOS fiber to the home based service. Boulben said his company would focus on selling fiber service to customers as it becomes available to them.
Is FWA the ONLY real killer application for 5G? Even though it was NOT one of the envisioned use cases? Ericsson’s recently released Mobility Report says FWA will account for more than 35% of all new fixed broadband connections, with an expected increase to 350 million by the end of 2030. The report states that more than half of all network service providers (wireless telcos) who offer FWA now do so with “speed-based monetization benefits enhanced by 5G.”
About 80% of the global network operators sampled by Ericsson currently offer FWA, with the most rapid area of growth among CSPs (communications service providers) offering 5G-enabled speed-based tariff plans. These opportunities are about the ability to offer a range of subscriber packages with different downlink and uplink data options with 5G FWA. As with fiber deals, “increasing monetization opportunities for CSPs compared to earlier generations of FWA.” 51% of operators with FWA offerings now include these speed-based options, which is up from 40% on the same period in June 2024 and represents a 27.5% increase. The June 2024 number had grown 50% on the June 2023 equivalent.

Source: Ericsson Mobility Report
…………………………………………………………………………………………………………………………………………………………………..
“We are at an inflection point, where 5G and the ecosystem are set to unleash a wave of innovation,” said Erik Ekudden, Ericsson Senior Vice President and Chief Technology Officer. “The recent advancements in 5G standalone (SA) networks, coupled with the progress in 5G-enabled devices, have led to an ecosystem poised to unlock transformative opportunities for connected creativity. Service providers have recognized this potential of 5G and are beginning to monetize it through innovative service offerings that extend beyond merely selling data plans. To fully realize the potential of 5G, it is essential to continue deploying 5G SA and to further build out mid-band sites. 5G SA capabilities serve as a catalyst for driving new business growth opportunities.”
Fixed-wireless doesn’t work everywhere. Besides congestion weak signals can make coverage spotty. If your cell phone doesn’t pick up 5G coverage smoothly, fixed-wireless from the same company probably won’t work either.
Verizon, AT&T and T-Mobile are winning converts to FWA at a faster pace than many anticipated, said Jonathan Chaplin, a managing partner at equity research firm New Street Research. Charter agreed to buy Cox last month for $21.9 billion in equity and assume $12 billion of its outstanding debt, in part to acquire scale to better compete with fixed wireless access. However, fixed-wireless growth can’t last indefinitely. The wireless networks on which they run will eventually hit capacity, limiting how many subscribers they can add. Chaplin estimates the networks can support around 19 million total fixed-wireless subscribers—which he predicts they will reach in about five years, accounting for planned network expansions that the companies have announced. When that limit is reached, cable companies may regain the upper hand and keep growing their fiber customer base, Chaplin said.
The big three wireless carriers (AT&T, Verizon and T-Mobile) have all been investing in fiber-based wired networks via build-outs and acquisitions. AT&T is bringing new customers in via FWA, with the long-term goal to convert them to fiber-based service, said Erin Scarborough, who runs that company’s broadband and connectivity initiatives.
References:
https://www.telecoms.com/5g-6g/ericsson-says-fwa-is-boosting-telco-monetization-opportunities
https://www.ericsson.com/en/reports-and-papers/mobility-report
https://www.consumeraffairs.com/news/cable-vs-wireless-war-is-driving-prices-down-062525.html
Dell’Oro: 4G and 5G FWA revenue grew 7% in 2024; MRFR: FWA worth $182.27B by 2032
Latest Ericsson Mobility Report talks up 5G SA networks and FWA
T-Mobile posts impressive wireless growth stats in 2Q-2024; fiber optic network acquisition binge to complement its FWA business
5G Advanced offers opportunities for new revenue streams; 3GPP specs for 5G FWA?
FWA a bright spot in otherwise gloomy Internet access market
Dell’Oro: 4G and 5G FWA revenue grew 7% in 2024; MRFR: FWA worth $182.27B by 2032
According to Dell’Oro Group, Fixed Wireless Access (FWA) has surged in recent years to support both residential and enterprise connectivity due to its ease of deployment along with the more widespread availability of 4G LTE and 5G Sub-6GHz networks. Preliminary findings suggest total FWA revenues, including RAN equipment, residential CPE, and enterprise router and gateway revenue remain on track to advance 7% in 2024, driven largely by residential subscriber growth in North America and India, as well as growing branch office connectivity more globally.
“Initially viewed as a way to monetize under-utilized spectrum, FWA has grown to become a major tool for connecting homes and businesses with broadband,” said Jeff Heynen, Vice President with the Dell’Oro Group. “What started in the U.S. is now expanding to India, Southeast Asia, Europe, and the Middle East, as mobile operators continue to expand their 5G-based FWA offerings to both residential and enterprise customers,” added Heynen.
Additional highlights from the Fixed Wireless Access Infrastructure and CPE Advanced Research Report:
- Total FWA equipment revenue for the 2023-2027 period have been revised upward by 17 percent, reflecting continued positive subscriber growth in North America and India.
- Long-term subscriber growth is expected to occur in emerging markets in Southeast Asia and MEA, due to upgrades to existing 3G and LTE networks and a need to connect subscribers economically.
- The Satellite Broadband market will also be a key enabler of broadband connectivity in emerging markets as well as rural markets where existing infrastructure either doesn’t exist or is cost-prohibitive to deploy. Subscriber growth will generally come from LEOS-based providers including Starlink, OneWeb, and Project Kuiper.
The Dell’Oro Group Fixed Wireless Access Infrastructure and CPE Report includes 5-year market forecasts for FWA CPE (Residential and Enterprise) and RAN infrastructure, segmented by technology, including 802.11/Other, 4G LTE, CBRS, 5G sub-6GHz, 5G mmWave, and 60GHz technologies. The report also includes regional subscriber forecasts for FWA and satellite broadband technologies, as well as Residential Gateway forecasts for satellite broadband deployments. To purchase this report, please contact us by email at [email protected].
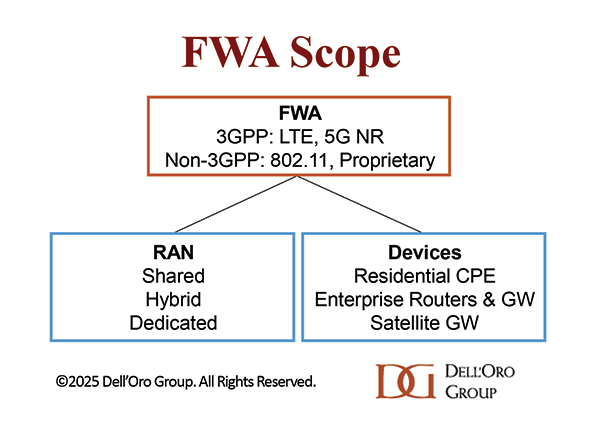
In a related Dell’Oro post, Stefan Pongratz wrote that Dedicated FWA RAN < $1B:
The market opportunity for DSL and fiber replacements or alternative solutions is vast. According to the ITU and Ericsson’s Mobility Report, approximately 35% of the world’s two billion households remain underserved, lacking broadband connectivity. Beyond these unconnected households, FWA technologies can also address the needs of secondary homes and small businesses. With nearly half of 5G operators supporting 5G FWA (GSA), fixed wireless is already a mature technology, boosting both the RAN and the broadband markets.
Despite these advancements, the fundamental economics driving FWA are not expected to shift significantly in 2025. While technological improvements are expanding the TAM, the business case remains constrained by the mobile network’s capacity and the ROI of dedicated FWA RAN deployments. Operators continue refining their targets, but the existing mobile network infrastructure offers the most favorable RAN economics.
Although operators are gradually increasing their investments in dedicated RAN solutions for high-traffic areas, mobile networks are expected to maintain dominance in the near term. According to our latest FWA report, which covers the broader FWA ecosystem—including 3GPP and non-3GPP RAN and devices—dedicated FWA RAN investments are projected to stay below $1 billion in 2025.
…………………………………………………………………………………………………………………
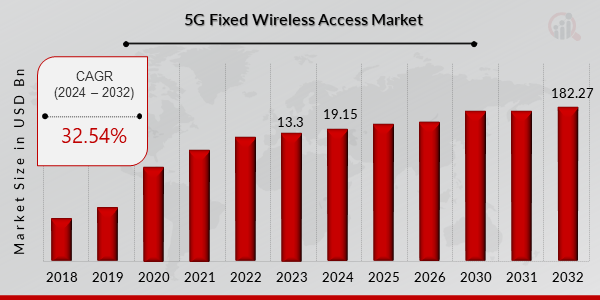
Separately, MRFR says the FWA market will be worth $182.27 Billion by 2032. Here’s a chart of 5G Fixed Wireless Access Market Growth:
FWA Growth Drivers:
Rising Demand for High-Speed Internet: With the increasing reliance on digital infrastructure and applications, there is a surging demand for high-speed and reliable internet connectivity. 5G FWA solutions offer ultra-fast broadband to underserved and remote areas, addressing connectivity gaps effectively.
Growing Adoption of IoT and Advanced Technologies: The proliferation of IoT devices and the need for seamless connectivity are driving the adoption of 5G FWA solutions. Additionally, advancements in mmWave technology enhance bandwidth efficiency, boosting market adoption.
Cost-Effective Alternative to Fiber Networks: 5G FWA provides a cost-efficient and rapid deployment option compared to traditional fiber-based internet, making it an attractive solution for internet service providers and enterprises.
References:
https://www.delloro.com/what-to-expect-from-ran-in-2025/
https://www.marketresearchfuture.com/reports/5g-fixed-wireless-access-market-7561
Latest Ericsson Mobility Report talks up 5G SA networks (?) and FWA (!)
Fiber and Fixed Wireless Access are the fastest growing fixed broadband technologies in the OECD
Ericsson: Over 300 million Fixed Wireless Access (FWA) connections by 2028
Latest Ericsson Mobility Report talks up 5G SA networks and FWA
Ericsson’s November 2024 Mobility Report predicts that global 5G standalone (SA) connections will top 3.6 billion by 2030. That compares to 890 million at the end of 2023. Over that same period of time, 5G SA as a proportion of global mobile subscriptions is expected to increase from 10.5% to 38.4%, while average monthly smartphone data consumption will grow to 40 GB from 17.2 GB. By the end of the decade, 80% of total mobile data traffic will be carried by 5G networks.
That rosy forecast is in sharp contrast to the extremely slow and disappointing pace of 5G SA deployments to date. In January, Dell’Oro counted only 12 new 5G SA deployments in 2023, compared to the 18 in 2022. “The biggest surprise for 2023 was the lack of 5G SA deployments by AT&T, Verizon, British Telecom EE, Deutsche Telekom, and other Mobile Network Operators (MNOs) around the globe. As we’ve stated for years, 5G SA is required to realize 5G features like security, network slicing, and MEC to name a few.”
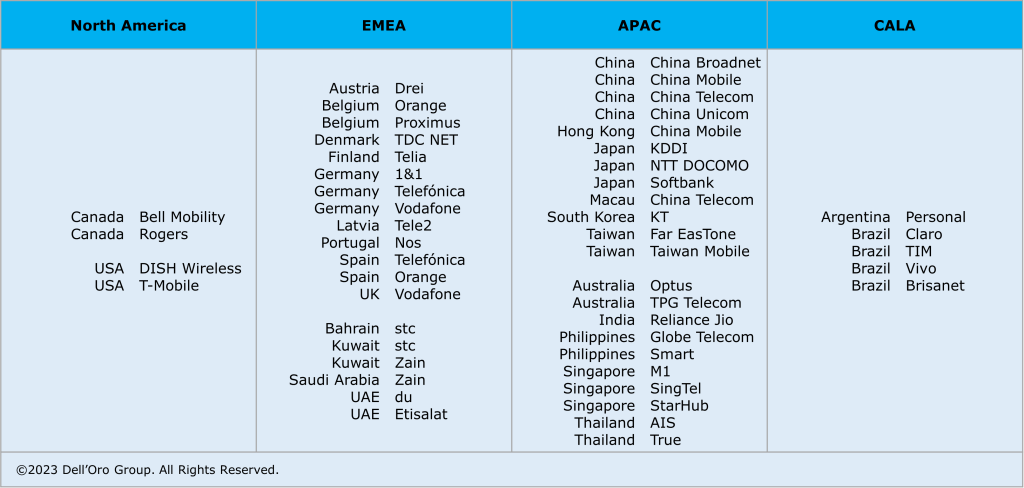
Fifty 5G Standalone enhanced Mobile Broadband (eMBB) networks commercially deployed (2020 – 2023):
The report states, “Although 5G population coverage is growing worldwide, 5G mid-band is only deployed in around 30% of all sites globally outside of mainland China. Further densification is required to harness the full potential of 5G.” Among the report highlights:
- Global 5G subscriptions will reach around 6.3 billion in 2030, equaling 67% of total mobile subscriptions.
- 5G subscriptions will overtake 4G subs in 2027.
- 5G is expected to carry 80% of total mobile data traffic by the end of 2030.
- 5G SA subscriptions are projected to reach around 3.6 billion in 2030.
Source: Ericsson Mobility Report -Nov 2024
“Service differentiation and performance-based opportunities are crucial as our industry evolves,” said Fredrik Jejdling, EVP and head of Ericsson’s networks division. “The shift towards high-performing programmable networks, enabled by openness and cloud, will empower service providers to offer and charge for services based on the value delivered, not merely data volume,” he added.
The Mobility Report provides two case studies in T-Mobile US and Finland’s Elisa – both of which have rolled out network slicing on their 5G SA networks and co-authored that section of the report:
- T-Mobile has been testing a high priority network slice to carry mission-critical data during special events.
- Elisa has configured a slice to support stable, high-capacity throughput for users of its premium fixed-wireless access (FWA) service, called Omakaista.
The Mobility Report doesn’t say if those two telcos are deriving any monetary benefit from network slicing, or more broadly from their 5G SA networks.
……………………………………………………………………………………………………………………………………………………………………………………………………………..
The Fixed Wireless Access (FWA) market has momentum:
- Ericsson predicts FWA connections will reach 159 million this year, up from 131 million in 2023.
- By 2030, connections are expected to hit 350 million, with 80% carried by 5G networks.
- In four out of six regions, 83% or more wireless telcos now offer FWA.
- The number of FWA service providers offering speed-based tariff plans – with downlink and uplink data parameters similar to cable or fiber offerings – has increased from 30% to 43% in the last year alone.
- An updated Ericsson study of retail packages offered by mobile service providers reveals that 79% have a FWA offering.
- There are 131 service providers offering FWA services over 5G, representing 54 percent of all FWA service providers.
- In the past 12 months, Europe has accounted for 73%of all new 5G FWA launches globally.
- Currently, 94% of service providers in the Gulf Cooperation Council region offer 5G FWA services.
- In the U.S. two service providers (T-Mobile US and Verizon) originally set a goal to achieve a combined 11–13 million 5G FWA connections by 2025. After reaching this target ahead of schedule, they have now revised their goal to 20–21 million connections by 2028.
- The market in India is rapidly accelerating, with 5G FWA connections reaching nearly 3 million in just over a year since launch. • An increasing number of service providers are launching FWA based on 5G standalone (SA).
References:
https://www.ericsson.com/en/reports-and-papers/mobility-report/reports/november-2024
https://www.ericsson.com/4ad0df/assets/local/reports-papers/mobility-report/documents/2024/ericsson-mobility-report-november-2024.pdf
5G Advanced offers opportunities for new revenue streams; 3GPP specs for 5G FWA?
FWA a bright spot in otherwise gloomy Internet access market
Where Have You Gone 5G? Midband spectrum, FWA, 2024 decline in CAPEX and RAN revenue
GSA: More 5G SA devices, but commercial 5G SA deployments lag
Vodafone UK report touts benefits of 5G SA for Small Biz; cover for proposed merger with Three UK?
Building and Operating a Cloud Native 5G SA Core Network
Verizon Q2-2024: strong wireless service revenue and broadband subscriber growth, but consumer FWA lags
Verizon Communications wireless and wireline subscriber growth expectations in the second quarter beat estimates with 148K postpaid phone net additions vs. 118K expected. There were 391,000 total broadband wireline net additions. The company ended the quarter with 11.5 million broadband subscribers, up 17.2% year over year. However, the telecom company posted lower operating revenue that was below expectations. Earnings mostly matched expectations, but were below the year ago level.
“Demand for the service is strengthening as small businesses and enterprises continue to trust the reliability of the product and the speed and east of deployment,” Verizon CFO Tony Skiadas said on Monday’s earnings call.
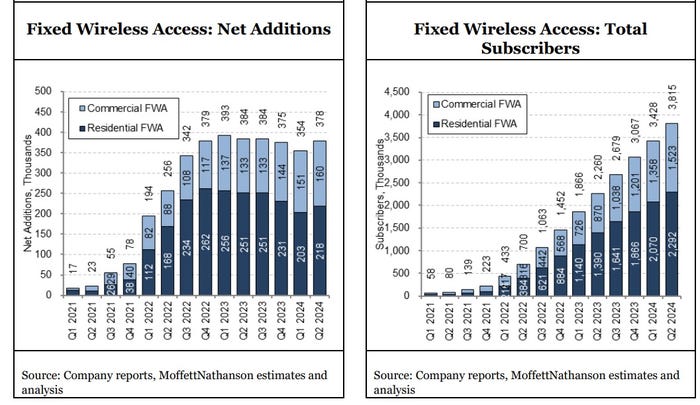
- Verizon added 160,000 business Fixed Wireless Access (FWA) subs in 2Q-2024 – a record quarterly gain in the category that was better than the 138,000 expected by analysts. That quarterly intake was up from a gain of 133,000 in the year-ago quarter and improved from a gain of 151,000 in the prior quarter. Verizon ended Q2 with 1.52 million business FWA subs.
- The company added 218,000 residential FWA subs in Q2 2024, down from a gain of 251,000 in the year-ago quarter, but ahead of the 208,000 residential FWA subs added in the prior quarter. Verizon ended the period with 2.29 million residential FWA subs.
A recent OpenSignal study revealed that Verizon’s 5G customers are rarely connected to the 5G network – in range just 7.7% of the time compared to AT&T (11.8%) and T-Mobile (67.9%). Verizon has not come close to adding as many FWA subs as T-Mobile has each quarter, particularly in the residential market.
New Street Research expects Verizon to cross the 4 million FWA subscriber mark in mid-August. In New Street’s follow-up note, analyst Jonathan Chaplin points to a recent estimate from the firm that data consumption among consumer FWA subs could be four to five time greater than business subscribers. On that basis, an estimate of FWA capacity for 4.1 million Verizon subs would really equate to 6.1 million total customers, he wrote.
2Q 2024 Highlights:
Wireless: Accelerated growth in wireless service revenue
- Total wireless service revenue1 of $19.8 billion, a 3.5 percent increase year over year.
- Retail postpaid phone net additions of 148,000, and retail postpaid net additions of 340,000.
- Retail postpaid phone churn of 0.85 percent, and retail postpaid churn of 1.11 percent.
Broadband: Double-digit broadband subscriber growth
- Total broadband net additions of 391,000. This was the eighth consecutive quarter with more than 375,000 broadband net additions.
- Total fixed wireless net additions of 378,000. At the end of second-quarter 2024, the company had a base of more than 3.8 million fixed wireless subscribers, representing an increase of nearly 69 percent year over year.
- 11.5 million total broadband subscribers as of the end of second-quarter 2024, representing a 17.2 percent increase year over year.
- Fixed wireless revenue for second-quarter 2024 was $514 million, up more than $200 million year over year.
Other results and FY 2024 forecast:
- Verizon reported adjusted earnings of $1.15 a share for the quarter, in line with analyst expectations, but a slowdown from last year’s adjusted earnings of $1.21 a share. This was also the lowest earnings per share for a second quarter since 2017.
- Total operating revenue came in at $32.8 billion, 0.6% higher than a year ago, but below estimates of $33.8 billion.
- Total wireless service revenue was $19.8 billion, up 3.5% year over year, driven primarily by growth in Consumer wireless service revenue.
- FY-2024 Outlook: Verizon reiterated a 2.0% – 3.5% wireless service revenue growth. It maintained an adjusted EPS of $4.50 – $4.70 versus consensus of $4.58.
References:
5G Advanced offers opportunities for new revenue streams; 3GPP specs for 5G FWA?
A Mobile World Live webinar on 5G-advanced upgrades identified new opportunities for network operator revenue streams, mostly due to improved network efficiencies and reduced costs. 5G Advanced, the next step in 5G evolution, will be specified in 3GPP Release 18 and 19. There is no work on it in ITU-R which is now focused on IMT-2030 (6G).

Egil Gronstad, T-Mobile senior director-technology development and strategy, said 5G Advanced will present opportunities for new revenue streams: 5G IoT will have lower cost and lower power consumption of endpoint devices (Redcap). Another 5G Advanced capability will be Ambient IoT (coming in Rel 19) which has a lot of opportunities via lower cost and no battery required in IoT devices. A bit further out is Integrated sensing and communications -using the network as a radar system to detect objects of interest. Improved spectrum efficiency will be improved using AI/ML for beam management.
Egil said 3GPP should develop specs for fixed wireless access (FWA). He’s disappointed with 3GPP not pursuing 5G FWA. “We haven’t really done anything in the 3GPP specs to specifically address fixed wireless,” he said. Neither has ITU-R WP 5D, which is responsible for developing all ITU-R recommendations for IMT (3G, 4G, 5G, 6G). FWA was not identified as an ITU use case for 5G and that hasn’t changed with 5G Advanced.
References:
https://www.nokia.com/about-us/newsroom/articles/5g-advanced-explained/
What is 5G Advanced and is it ready for deployment any time soon?
Huawei pushes 5.5G (aka 5G Advanced) but there are no completed 3GPP specs or ITU-R standards!
China Mobile & ZTE use digital twin technology with 5G-Advanced on high-speed railway in China
ZTE and China Telecom unveil 5G-Advanced solution for B2B and B2C services
ABI Research: 5G-Advanced (not yet defined by ITU-R) will include AI/ML and network energy savings
Point Topic: FTTP broadband subs to reach 1.12bn by 2030 in 29 largest markets
Point Topic forecasts 1.39 billion fixed broadband connections by the end of the decade in the 29 largest broadband markets in the world. Fiber to the Premises (FTTP) is already dominating most of the markets and it will be the preferred option for most consumers, where it is available.
Between 2023 and 2030 Point Topic projects a 15% growth in total fixed broadband subscribers in the top 29 markets. The growth will come mainly from FTTP – although the increase in the total fiber lines will be lower than that in Fixed Wireless Access lines – 25% and 61% respectively, the sheer number of already existing and new FTTP connections will drive the total growth.

Figure 1. Fixed broadband lines by technology (Top 29 markets)
………………………………………………………………………………………………………..
Split by technology we estimate that by 2030 there will be 1.12 billion FTTP, 149 million cable, 79 million FTTX, 16 million FWA[1] and only 28 million DSL lines in these markets.
 Figure 2. Change in fixed broadband lines, 2023-2030 (Top 29 markets)
Cable is a term used as a proxy for those legacy MSOs/cablecos (e.g. Charter, VMO2, Comcast, etc.) that still have significant networks based on coaxial cable, mainly DOCSIS 3.0 and 3.1. We forecast some decline (-6%) in cable broadband lines by the end of the decade as these networks are being replaced with full fibre. The new generation DOCSIS4, which is in development, will match the capabilities of FTTH with XGPON, so markets with established cable networks will see a slight growth or stable take-up figures for ‘cable’ broadband lines.
FTTX (where fibre is present in the local loop with copper, mainly fiber to the cabinet) will decline over the next seven years (-19%). Some modest growth from new subscribers will remain in a few markets where legacy infrastructure is still widespread. Also, it will remain a cheaper option even where other technologies are available as it still offers enough bandwidth for some users.
DSL will see the largest decline at -44%. However, while being a slower and less reliable solution, it can provide enough bandwidth at a low price to some single or older households that are reluctant to upgrade. Besides, some of them will not have a choice of other technologies, especially in certain regions and markets.
………………………………………………………………………………………………………………

Figure 3. Fixed broadband penetration, 2023 and 2030 (top 29 markets)
…………………………………………………………………………………………………………………………
Point Topic only included FWA in its data in significant markets and where it was able to source reliable figures, such at the U.S., Canada, and Italy. Therefore, the total number of FWA subscribers could end up higher if FWA takes off in other markets.
In the U.S., T-Mobile US and Verizon are the FWA leaders with 8.6 million connections between them as of March 2024. T-Mobile recently added a new FWA service offer to its portfolio aimed at customers who might need a back-up for unreliable fiber or cable connections.
……………………………………………………………………………………………………………………..
China will be among the 16 markets with 90%-plus broadband penetration in seven years time. The potential for signing up new customers in those markets will shrink, leaving broadband providers with the task of converting existing customers to higher bandwidths and more advanced technologies for growth.
At the other end of the scale, there is still lots of room for broadband growth. India will have the lowest percentage of premises with a fixed broadband connection by 2030 at 33%, up from just 11% last year.
“There is significant growth to come in the ‘youthful’ markets with low fixed broadband penetration, with plenty of consumers in India, Indonesia and other fast-growing economies hungry for the advantages offered by fixed broadband and full fibre in particular,” Point Topic said.
……………………………………………………………………………………………………………………..
References:
https://www.point-topic.com/post/fttp-broadband-subscriber-forecasts-q4-2023
https://www.telecoms.com/fibre/fibre-to-drive-15-broadband-growth-by-2030
U.S. broadband subscriber growth slowed in 1Q-2024 after net adds in 2023
Dell’Oro: Broadband access equipment sales to increase in 2025 led by XGS-PON deployments
Altice USA transition to fiber access; MoffettNathanson analysis of low population growth on cablecos broadband growth
FWA a bright spot in otherwise gloomy Internet access market
Parks Associates’ newly launched Broadband Market Tracker, states that U.S. Fixed Wireless Access (FWA) adoption from a mobile network operator hit 7.8 million U.S. residential home internet connections in Q1-2024. That’s in comparison to 106.3 million U.S. households that had home internet service at the end of 2023.
Kristen Hanich, director of research at Parks Associates, told Fierce Network FWA and satellite internet are the “fastest growing” segments of the broadband market, “attracting consumers who were previously unserved or underserved by traditional providers.” She noted for the past several years, the FWA base has grown by 700,000 to 900,000 subscribers per quarter while cable connections have declined.
T-Mobile in Q1-2024 passed the 5 million mark for FWA subscribers and Verizon reported a total FWA tally of 3.4 million subscribers. These figures include both residential and business FWA customers.
Key FWA Findings from OpenSignal:
- 5G FWA has reshaped the U.S. broadband market. It has allowed U.S. mobile operators to rapidly expand their broadband footprints for minimal incremental network investment. This has seen 5G FWA absorb all broadband subscriber growth in the market since mid-2022.
- FWA is the secret sauce for 5G monetization. FWA benefits from lower prices compared to wireline competition, access to existing mobile retail channels and subscribers, and the ability to deliver a “good enough” broadband service.
- U.S. mobile networks have proven to be resilient. Despite adding millions of 5G FWA subs since 2021, 5G speeds on T-Mobile and Verizon’s mobile networks have continued to improve. Their success in managing FWA traffic is due to a variety of factors, including plentiful access to mid-band spectrum, localized load management, and differences in peak usage time of day patterns between mobile and FBB usage.
- Elsewhere, there are mixed results. In India, Jio is seeing no discernible impact from FWA on the mobile experience of its users, while in Saudi Arabia Zain is seeing the additional load on its network from FWA having a greater influence on mobile users’ experience, depending on the time of day or the level of FWA penetration.
“Despite adding more than eight million 5G FWA subs using 400+ GB per month of data since Q1 2021, the overall mobile network experience on T-Mobile and Verizon’s mobile networks has not been compromised,” Opensignal analyst Robert Wyrzykowski wrote in the firm’s new assessment of FWA technology.

In its new report, Opensignal found that areas in the U.S. with a larger number of FWA customers actually showed better networking performance than areas with fewer FWA customers. Meaning, Verizon and T-Mobile offered increasingly speedy connections even in geographic locations with higher concentrations of FWA users.
“We would expect low-FWA penetration areas to see better mobile and FWA performance because of less load on the network. However, our data demonstrates the opposite trend,” Wyrzykowski explained.

Other Opensignal findings:
- Around 6% of urban Internet customers subscribe to FWA; in rural areas that figure is 7%.
- Some 74% of FWA customers pay less than $75 per month for their services.
- 35% of FWA customers are between 18-34 years old, whereas that age range is 25% for cable.
Opensignal’s findings provide an important view into the FWA industry in the US as its subscriber growth begins to slow. For example, T-Mobile added 405,000 FWA customers during the first quarter, far less than the 541,000 FWA customers it added during the fourth quarter of 2023.
“5G FWA services have been on a dramatic growth trajectory in the U.S., absorbing all broadband subscriber growth in the market since mid-2022 and amassing more than 600-700 thousand net adds per quarter,” wrote Opensignal’s Wyrzykowski. “This is despite the USA being a mature broadband market with nearly 97% broadband adoption and modest household growth.”
…………………………………………………………………………………………………………….
U.S. cable companies have recorded historic declines in their core Internet businesses amid the growth of FWA in the U.S. Financial analysts at TD Cowen predict the U.S. cable industry will collectively lose more than half a million customers in the second quarter of this year. They attribute that decline to FWA competition as well as other factors including the end of the U.S. government’s Affordable Connectivity Program (ACP).
The situation for cable might get even worse if FWA providers like T-Mobile and Verizon decide to invest further into their fixed wireless businesses.
“The pain for cable may continue for longer than expected as the ability for cable to return to broadband subscriber growth may take longer (if ever),” wrote the TD Cowen analysts in a recent note to investors.
Others agree. For example, the analysts at S&P Global wrote that cable service providers in general have been losing value to wireless network operators despite cable’s efforts to bundle mobile services into cable offerings.
………………………………………………………………………………………………………
Parks’ Hanich said fiber optic access technology is on an upswing and Parks is seeing “excellent growth in the markets where it is available and high customer satisfaction with the customers who have it.”
“But the numbers are not quite as dramatic as what’s been going on with T-Mobile, Verizon and Starlink,” she said, noting the “growing convergence” of satellite and mobile networks is something else to keep an eye on.
Asked whether the demise of the Affordable Connectivity Program has had any impact on Parks’ findings, Hanich said, “we are concerned that the end of the program will result in households and families needing to disconnect from the internet for financial reasons.”
“For a good percentage of Americans, household budgets have been hit by rising inflation and lower-income families especially are having to cut back,” she said. “Thankfully we are seeing ISPs step up, try and transition people onto other plans and initiatives.”
…………………………………………………………………………………………………………….
Separately, Parks found adoption of mobile virtual network operator (MVNO) services reached over 15 million residential customer mobile lines in the quarter. In an MVNO model, broadband operators lease spectrum capacity from a wireless network to stand up their own mobile offering.
NTIA published some findings from its latest Internet Use Survey. Unsurprisingly, internet usage in the U.S. has gone up, with 13 million more people using the internet in 2023 compared to 2021. However, a lot of that usage is coming from lower-income households. Specifically, internet adoption among households making less than $25,000 per year increased from 69% in 2021 to 73% in 2023.
References:
https://www.fierce-network.com/broadband/fixed-wireless-continues-its-climb-among-us-homes-parks
https://www.lightreading.com/fixed-wireless-access/fwa-in-the-usa-getting-ready-for-phase-2
Fiber and Fixed Wireless Access are the fastest growing fixed broadband technologies in the OECD
Summary of Verizon Consumer, FWA & Business Segment 1Q-2024 results
Verizon’s 2023 broadband net additions led by FWA at 375K
AT&T’s fiber business grows along with FWA “Internet Air” in Q4-2023
Ericsson: Over 300 million Fixed Wireless Access (FWA) connections by 2028


