

capex
Big tech spending on AI data centers and infrastructure vs the fiber optic buildout during the dot-com boom (& bust)
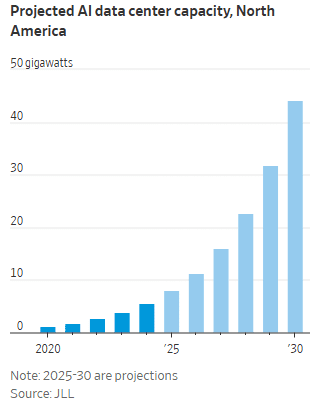
Big Tech plans to spend between $364 billion and $400 billion on AI data centers, purchasing specialized AI hardware like GPUs, and supporting cloud computing/storage capacity. The final 2Q 2025 GDP report, released last week, reveals a surge in data center infrastructure spending from $9.5 billion in early 2020 to $40.4 billion in the second quarter of 2025. It’s largely due to an unprecedented investment boom driven by artificial intelligence (AI) and cloud computing. The increase highlights a monumental shift in capital expenditure by major tech companies.
Yet there are huge uncertainties about how far AI will transform scientific discovery and hypercharge technological advance. Tech financial analysts worry that enthusiasm for AI has turned into a bubble that is reminiscent of the mania around the internet’s infrastructure build-out boom from 1998-2000. During that time period, telecom network providers spent over $100 billion blanketing the country with fiber optic cables based on the belief that the internet’s growth would be so explosive that such massive investments were justified. The “talk of the town” during those years was the “All Optical Network,” with ultra-long haul optical transceiver, photonic switches and optical add/drop multiplexers. 27 years later, it still has not been realized anywhere in the world.
The resulting massive optical network overbuilding made telecom the hardest hit sector of the dot-com bust. Industry giants toppled like dominoes, including Global Crossing, WorldCom, Enron, Qwest, PSI Net and 360Networks.
However, a key difference between then and now is that today’s tech giants (e.g. hyperscalers) produce far more cash than the fiber builders in the 1990s. Also, AI is immediately available for use by anyone that has a high speed internet connection (via desktop, laptop, tablet or smartphone) unlike the late 1990s when internet users (consumers and businesses) had to obtain high-speed wireline access via cable modems, DSL or (in very few areas) fiber to the premises.
……………………………………………………………………………………………………………………………………………………………………………………………………………………………….
Today, the once boring world of chips and data centers has become a raging multi-hundred billion dollar battleground where Silicon Valley giants attempt to one up each other with spending commitments—and sci-fi names. Meta CEO Mark Zuckerberg teased his planned “Hyperion” mega-data center with a social-media post showing it would be the size of a large chunk of Manhattan.
OpenAI’s Sam Altman calls his data-center effort “Stargate,” a reference to the 1994 movie about an interstellar time-travel portal. Company executives this week laid out plans that would require at least $1 trillion in data-center investments, and Altman recently committed the company to pay Oracle an average of approximately $60 billion a year for AI compute servers in data centers in coming years. That’s despite Oracle is not a major cloud service provider and OpenAI will not have the cash on hand to pay Oracle.
In fact, OpenAI is on track to realize just $13 billion in revenue from all its paying customers this year and won’t be profitable till at least 2029 or 2030. The company projects its total cash burn will reach $115 billion by 2029. The majority of its revenue comes from subscriptions to premium versions of ChatGPT, with the remainder from selling access to its models via its API. Although ~ 700 million people—9% of the world’s population—are weekly users of ChatGPT (as of August, up from 500 million in March), its estimated that over 90% use the free version. Also this past week:
- Nvidia plans to invest up to $100 billion to help OpenAI build data center capacity with millions GPUs.
- OpenAI revealed an expanded deal with Oracle and SoftBank , scaling its “Stargate” project to a $400 billion commitment across multiple phases and sites.
- OpenAI deepened its enterprise reach with a formal integration into Databricks — signaling a new phase in its push for commercial adoption.
Nvidia is supplying capital and chips. Oracle is building the sites. OpenAI is anchoring the demand. It’s a circular economy that could come under pressure if any one player falters. And while the headlines came fast this week, the physical buildout will take years to deliver — with much of it dependent on energy and grid upgrades that remain uncertain.
Another AI darling is CoreWeave, a company that provides GPU-accelerated cloud computing platforms and infrastructure. From its founding in 2017 until its pivot to cloud computing in 2019, Corweave was an obscure cryptocurrency miner with fewer than two dozen employees. Flooded with money from Wall Street and private-equity investors, it has morphed into a computing goliath with a market value bigger than General Motors or Target.
…………………………………………………………………………………………………………………………………………………………………………………………………………………………………………………………………………………….
Massive AI infrastructure spending will require tremendous AI revenue for pay-back:
David Cahn, a partner at venture-capital firm Sequoia, estimates that the money invested in AI infrastructure in 2023 and 2024 alone requires consumers and companies to buy roughly $800 billion in AI products over the life of these chips and data centers to produce a good investment return. Analysts believe most AI processors have a useful life of between three and five years.
This week, consultants at Bain & Co. estimated the wave of AI infrastructure spending will require $2 trillion in annual AI revenue by 2030. By comparison, that is more than the combined 2024 revenue of Amazon, Apple, Alphabet, Microsoft, Meta and Nvidia, and more than five times the size of the entire global subscription software market.

Morgan Stanley estimates that last year there was around $45 billion of revenue for AI products. The sector makes money from a combination of subscription fees for chatbots such as ChatGPT and money paid to use these companies’ data centers. How the tech sector will cover the gap is “the trillion dollar question,” said Mark Moerdler, an analyst at Bernstein. Consumers have been quick to use AI, but most are using free versions, Moerdler said. Businesses have been slow to spend much on AI services, except for the roughly $30 a month per user for Microsoft’s Copilot or similar products. “Someone’s got to make money off this,” he said.
…………………………………………………………………………………………………………………………………………………………………………………………………………………………………………………………………………………….
Why this time is different (?):
AI cheerleaders insist that this boom is different from the dot-com era. If AI continues to advance to the point where it can replace a large swath of white collar jobs, the savings will be more than enough to pay back the investment, backers argue. AI executives predict the technology could add 10% to global GDP in coming years.
“Training AI models is a gigantic multitrillion dollar market,” Oracle chairman Larry Ellison told investors this month. The market for companies and consumers using AI daily “will be much, much larger.”
The financing behind the AI build-out is complex. Debt is layered on at nearly every level. his “debt-fueled arms race” involves large technology companies, startups, and private credit firms seeking innovative ways to fund the development of data centers and acquire powerful hardware, such as Nvidia GPUs. Debt is layered across different levels of the AI ecosystem, from the large tech giants to smaller cloud providers and specialized hardware firms.
Alphabet, Microsoft, Amazon, Meta and others create their own AI products, and sometimes sell access to cloud-computing services to companies such as OpenAI that design AI models. The four “hyperscalers” alone are expected to spend nearly $400 billion on capital investments next year, more than the cost of the Apollo space program in today’s dollars. Some build their own data centers, and some rely on third parties to erect the mega-size warehouses tricked out with cooling equipment and power.
…………………………………………………………………………………………………………………………………………………………………………………………………………………………………………………………………………………….
Echoes of bubbles past:
History is replete with technology bubbles that pop. Optimism over an invention—canals, electricity, railroads—prompts an investor stampede premised on explosive growth. Overbuilding follows, and investors eat giant losses, even when a new technology permeates the economy. Predicting when a boom turns into a bubble is notoriously hard. Many inflate for years. Some never pop, and simply stagnate.
The U.K.’s 19th-century railway mania was so large that over 7% of the country’s GDP went toward blanketing the country with rail. Between 1840 and 1852, the railway system nearly quintupled to 7,300 miles of track, but it only produced one-fourth of the revenue builders expected, according to Andrew Odlyzko,PhD, an emeritus University of Minnesota mathematics professor who studies bubbles. He calls the unbridled optimism in manias “collective hallucinations,” where investors, society and the press follow herd mentality and stop seeing risks.
He knows from firsthand experience as a researcher at Bell Labs in the 1990s. Then, telecom giants and upstarts raced to speculatively plunge tens of millions of miles of fiber cables into the ground, spending the equivalent of around 1% of U.S. GDP over half a decade.
Backers compared the effort to the highway system, to the advent of electricity and to discovering oil. The prevailing belief at the time, he said, was that internet use was doubling every 100 days. But in reality, for most of the 1990s boom, traffic doubled every year, Odlyzko found.
The force of the mania led executives across the industry to focus on hype more than unfavorable news and statistics, pouring money into fiber until the bubble burst.
“There was a strong element of self interest,” as companies and executives all stood to benefit financially as long as the boom continued, Odlyzko said. “Cautionary signs are disregarded.”
Kevin O’Hara, a co-founder of upstart fiber builder Level 3, said banks and stock investors were throwing money at the company, and executives believed demand would rocket upward for years. Despite worrying signs, executives focused on the promise of more traffic from uses like video streaming and games.
“It was an absolute gold rush,” he said. “We were spending about $110 million a week” building out the network.
When reality caught up, Level 3’s stock dropped 95%, while giants of the sector went bust. Much of the fiber sat unused for over a decade. Ultimately, the growth of video streaming and other uses in the early 2010s helped soak up much of the oversupply.
Worrying signs:
There are growing, worrying signs that the optimism about AI won’t pan out.
- MIT Media Lab (2025): The “State of AI in Business 2025” report found that 95% of custom enterprise AI tools and pilots fail to produce a measurable financial impact or reach full-scale production. The primary issue identified was a “learning gap” among leaders and organizations, who struggle to properly integrate AI tools and redesign workflows to capture value.
- A University of Chicago economics paper found AI chatbots had “no significant impact on workers’ earnings, recorded hours, or wages” at 7,000 Danish workplaces.
- Gartner (2024–2025): The research and consulting firm has reported that 85% of AI initiatives fail to deliver on their promised value. Gartner also predicts that by the end of 2025, 30% of generative AI projects will be abandoned after the proof-of-concept phase due to issues like poor data quality, lack of clear business value, and escalating costs.
- RAND Corporation (2024): In its analysis, RAND confirmed that the failure rate for AI projects is over 80%, which is double the failure rate of non-AI technology projects. Cited obstacles include cost overruns, data privacy concerns, and security risks.
OpenAI’s release of ChatGPT-5 in August was widely viewed as an incremental improvement, not the game-changing thinking machine many expected. Given the high cost of developing it, the release fanned concerns that generative AI models are improving at a slower pace than expected. Each new AI model—ChatGPT-4, ChatGPT-5—costs significantly more than the last to train and release to the world, often three to five times the cost of the previous, say AI executives. That means the payback has to be even higher to justify the spending.
Another hurdle: The chips in the data centers won’t be useful forever. Unlike the dot-com boom’s fiber cables, the latest AI chips rapidly depreciate in value as technology improves, much like an older model car. And they are extremely expensive.
“This is bigger than all the other tech bubbles put together,” said Roger McNamee, co-founder of tech investor Silver Lake Partners, who has been critical of some tech giants. “This industry can be as successful as the most successful tech products ever introduced and still not justify the current levels of investment.”
Other challenges include the growing strain on global supply chains, especially for chips, power and infrastructure. As for economy-wide gains in productivity, few of the biggest listed U.S. companies are able to describe how AI was changing their businesses for the better. Equally striking is the minimal euphoria some Big Tech companies display in their regulatory filings. Meta’s 10k form last year reads: “[T]here can be no assurance that the usage of AI will enhance our products or services or be beneficial to our business, including our efficiency or profitability.” That is very shaky basis on which to conduct a $300bn capex splurge.
………………………………………………………………………………………………………………………………………………………………………………………………………………………………………………
Conclusions:
Big tech spending on AI infrastructure has been propping up the U.S. economy, with some projections indicating it could fuel nearly half of the 2025 GDP growth. However, this contribution primarily stems from capital expenditures, and the long-term economic impact is still being debated. George Saravelos of Deutsche Bank notes that economic growth is not coming from AI itself but from building the data centers to generate AI capacity.
Once those AI factories have been built, with needed power supplies and cooling, will the productivity gains from AI finally be realized? How globally disseminated will those benefits be? Finally, what will be the return on investment (ROI) for the big spending AI companies like the hyperscalers, OpenAI and other AI players?
………………………………………………………………………………………………………………………………………………………………………………………………………………………………………………
References:
https://www.wsj.com/tech/ai/ai-bubble-building-spree-55ee6128
https://www.ft.com/content/6c181cb1-0cbb-4668-9854-5a29debb05b1
https://www.cnbc.com/2025/09/26/openai-big-week-ai-arms-race.html
Gartner: AI spending >$2 trillion in 2026 driven by hyperscalers data center investments
AI Data Center Boom Carries Huge Default and Demand Risks
AI spending is surging; companies accelerate AI adoption, but job cuts loom large
Will billions of dollars big tech is spending on Gen AI data centers produce a decent ROI?
Canalys & Gartner: AI investments drive growth in cloud infrastructure spending
AI wave stimulates big tech spending and strong profits, but for how long?
AI Echo Chamber: “Upstream AI” companies huge spending fuels profit growth for “Downstream AI” firms
OpenAI partners with G42 to build giant data center for Stargate UAE project
Big Tech and VCs invest hundreds of billions in AI while salaries of AI experts reach the stratosphere
Superclusters of Nvidia GPU/AI chips combined with end-to-end network platforms to create next generation data centers
Analysis: Cisco, HPE/Juniper, and Nvidia network equipment for AI data centers
Networking chips and modules for AI data centers: Infiniband, Ultra Ethernet, Optical Connections
OpenAI and Broadcom in $10B deal to make custom AI chips
Lumen Technologies to connect Prometheus Hyperscale’s energy efficient AI data centers
Proposed solutions to high energy consumption of Generative AI LLMs: optimized hardware, new algorithms, green data centers
Liquid Dreams: The Rise of Immersion Cooling and Underwater Data Centers
Lumen: “We’re Building the Backbone for the AI Economy” – NaaS platform to be available to more customers
Initiatives and Analysis: Nokia focuses on data centers as its top growth market
Telco spending on RAN infrastructure continues to decline as does mobile traffic growth
Telco spending on radio access network (RAN) infrastructure, which is the largest share of capex, has dropped sharply in the last couple of years. It fell 11% in 2023, to about $40 billion, according to Informa owned market research firm Omdia (see References below for Dell’Oro’s numbers).
For 2024, Omdia predicts another decline of between 7% and 9%. Instead of buying new equipment, telcos have used existing supplies in their where houses.
Traffic growth rates also appear to have slowed. The graphic used in Ericsson’s latest mobility report pictures this very clearly, showing a church steeple of a traffic spike in 2019 and 2020 before a shallower downward-sloping gradient to the first half of 2024. That’s shown in this chart:
.jpg?width=700&auto=webp&quality=80&disable=upscale)
Source: Ericsson
Ericsson’s latest numbers, available through its mobility visualizer tool, shows the monthly volume of global mobile data rose by just 4.34% in the second quarter of 2024, compared with the first quarter. This is much lower than the rate of 10.76% Ericsson observed in the corresponding quarter four years earlier. The actual increase in 2024 was 6.27 exabytes. In 2020, it was 4.86 exabytes.
RAN product revenues have been falling at their sharpest rate in many years despite the 6.27-exabyte increase in monthly data volumes that happened in the second quarter. There are no signs that current 4G and 5G networks are about to keel over beneath an avalanche of data. It remains to be seen whether mobile networks are sufficiently robust to cope with many more exabytes of mobile data traffic or if telcos care about any service problems caused by congestion due to increased traffic.
There is also no obvious correlation between traffic growth and expenditure, according to Coleago Consulting. Spain’s Telefónica supported 17,054 petabytes of data on its global networks in 2015, its annual reports show. By 2023, the amount had rocketed to 146,074. Yet its capital intensity has fallen from more than 17% to just 14% over this period. Energy use, a proxy for operating costs, is also down, dropping from about 6,578 gigawatt hours in 2015 to 6,012 last year. Despite all that data consumption by its customers, Elisa’s capital intensity last year was less than 15%.
In Germany, the average monthly data usage per mobile customer (rather than per capita) amounted to 7.4 Gbytes and this may have risen to around 8 Gbytes in 1H 2024. In 2024, mobile data consumption in Finland was around 10 times higher compared to Germany. In Finland mobile operators have implemented 5G-SA and sell a user experience in terms of speed (Mbits/s) as opposed to data volume (Gbytes). As of October 2024, Elisa Finland offered a speed of 300 Mbits/s with unlimited data volume for €34.99. By contrast, in Germany, Telekom’s offer for 20 Gbytes is priced at €39.95 per month. For unlimited data usage Telekom charges €84.95, which is 2.5 times more costly than Elisa’s unlimited offer. It is unreasonable to assume that there is no price elasticity of demand. Surely, if prices in Germany were like those in Finland, monthly mobile data usage per customer would be much higher.
Monthly average revenue per user (ARPU) for a postpaid customer of Deutsche Telekom, Germany’s biggest telco, has fallen from €22 (US$23.7) before the launch of 5G to about €20 ($21.6) for the most recent quarter. Clearly, cost realities are especially awkward for Europe’s telcos, which have refused to give up their “fair share” argument that big content companies should pay for network usage because of all the traffic they supposedly generate. Critics disagree, saying that the telco’s own customers are the traffic generators, and they have already paid for it, even if pricing schemes do not help telcos to grow their sales.
………………………………………………………………………………………………………………………………………………………………………………………………………………………………..
References:
https://www.lightreading.com/5g/data-traffic-growth-or-decline-there-s-no-upside-for-telecom
https://www.coleago.com/insights/the-end-of-telecoms-history-not-really/
Analysys Mason & Light Reading: cellular data traffic growth rates are decreasing
Dell’Oro: Global RAN Market to Drop 21% between 2021 and 2029
Dell’Oro: RAN market still declining with Huawei, Ericsson, Nokia, ZTE and Samsung top vendors
Dell’Oro & Omdia: Global RAN market declined in 2023 and again in 2024
Dell’Oro: RAN market declines at very fast pace while Mobile Core Network returns to growth in Q2-2023
China’s mobile data consumption slumps; Apple’s market share shrinks-no longer among top 5 vendors
Analysts: Telco CAPEX crash looks to continue: mobile core network, RAN, and optical all expected to decline
Ookla: T-Mobile and Verizon lead in U.S. 5G FWA
Dell’Oro: Global telecom CAPEX declined 10% YoY in 1st half of 2024
According to a recent report by Dell’Oro Group, telecom operators are now scaling back their investments in 5G and fixed broadband technologies. Of course, that’s nothing new as telco CAPEX has been declining for quite some time (see References below). Preliminary Dell’Oro findings show that the more challenging conditions that shaped the second half of 2023 extended into the first half of 2024.
Worldwide telecom capex, the sum of wireless and wireline/other telecom carrier investments, declined 10% year-over-year (YoY) in the first half of 2024, partly due to built-up inventory, weaker demand in China, India, and US, challenging 5G comparisons, excess capacity, and elevated uncertainty.
“The high-level message is clear. The flattish revenue trajectory and the difficulties with monetizing new technologies and opportunities are impacting the risk appetite and willingness to raise the capital intensity levels for extended periods,” said Stefan Pongratz, Vice President for RAN and Telecom Capex research at Dell’Oro Group. “In addition, the reduced gap between advanced and less advanced regions, when it comes to adopting new technologies, is impacting the investment intensity on the way up and down,” continued Pongratz.
Additional highlights from the September 2024 Telecom Capex report:
- Global carrier revenues are expected to increase at a 1 percent CAGR over the next 3 years.
- Worldwide telecom capex is projected to decline at a mid-single-digit rate in 2024 and at a negative 2 percent CAGR by 2026.
- The mix between wireless and wireline remains largely unchanged, reflecting challenging times still ahead for wireless. Wireless-related capex will decline at a 3 percent CAGR by 2026.
- Capital intensity ratios are modeled to approach 15 percent by 2026, down from 17 percent in 2023.
 In a previous Dell’Oro report last month, telecom equipment revenues fell by 17% worldwide during the first half of the year. Dell’Oro described that as ‘abysmal results’ and again blamed excess inventory, weaker demand in China, ‘challenging 5G comparisons’, and elevated uncertainty.
The Dell’Oro Group Telecom Capex Report provides in-depth coverage of around 50 telecom operators, highlighting carrier revenue, capital expenditure, and capital intensity trends. The report provides actual and 3-year forecast details by carrier, by region by country (United States, Canada, China, India, Japan, and South Korea), and by technology (wireless/wireline). To purchase this report, please contact by email at [email protected].
References:
Telecom Capex Down 10 Percent in 1H24, According to Dell’Oro Group
Dell’Oro: Abysmal revenue results continue: Ethernet Campus Switch and Worldwide Telecom Equipment + Telco Convergence Moves to Counter Cable Broadband
Analysts: Telco CAPEX crash looks to continue: mobile core network, RAN, and optical all expected to decline
Analysys Mason’s gloomy CAPEX forecast: “there will not be a cyclical recovery”
China Mobile & China Unicom increase revenues and profits in 2023, but will slash CAPEX in 2024
Dell’Oro: RAN market still declining with Huawei, Ericsson, Nokia, ZTE and Samsung top vendors
Highlights of Dell’Oro’s 5-year RAN forecast
Dell’Oro: 2023 global telecom equipment revenues declined 5% YoY; Huawei increases its #1 position
Dell’Oro & Omdia: Global RAN market declined in 2023 and again in 2024
Global 5G Market Snapshot; Dell’Oro and GSA Updates on 5G SA networks and devices
Analysys Mason’s gloomy CAPEX forecast: “there will not be a cyclical recovery”
Telco capex declined worldwide in 2023, and predictions in end-of-financial year results indicate further declines this year. Analysys Mason warns that a “long decline” in capital expenditure has now started. “There will not be a cyclical recovery,” says one subhead (see below). Analysys Mason crunched a lot of numbers to arrive at this conclusion, processing historical data for about 50 of the largest operators in the world. Importantly, it also looked at the long-term guidance issued by those companies. Capex has peaked partly because telcos in many regions have completed or are near completing a once-in-a-lifetime upgrade to full-fiber networks. Clearly, that’s bad news for companies selling the actual fiber. Operators will continue to invest in the active electronics for these lines, but that represents a “tiny fraction” of the initial cost.
This new Analysys Mason gloomy CAPEX forecast comes after Dell’Oro and Omdia (owned by Informa) previously forecast another sharp fall in telco spending on mobile network products this year after the big dip of 2023.
Figure 1. below aggregates change in capex, excluding spectrum, in 2023 (or FY2023/2024) for 50 of the largest operators in the world, all with annual capex of over USD1 billion in 2023. These operators account for about 78% of telecoms capex worldwide. Of the 42 operators that provided guidance on capex in 2024, 28 forecast a fall. A notable class of exceptions consisted of cable operators and latecomers to FTTP upgrade, but most of the emerging-market-focused operators indicated a decline.
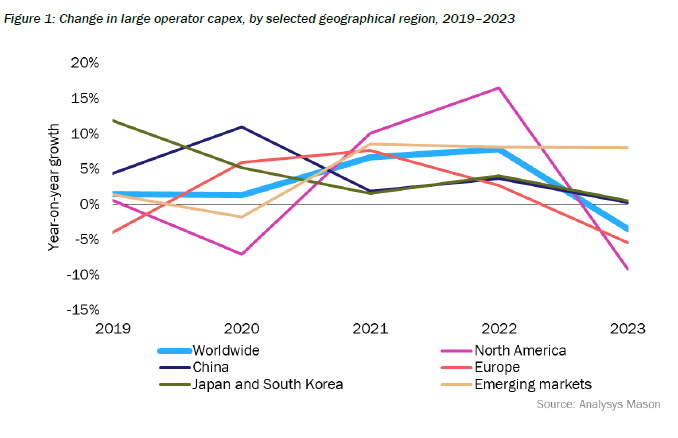
The steepest decline was in North America. The decline was steeper for the three largest mobile network operator (MNO) groups (–18.1%). This was offset by rises in capex by the two large US cablecos, for which upgrades of HFC plant are now an imperative. The obvious reason for the sharp decline is the near-completion of 5G roll-out, although FTTP capex remains flat.
In China, capex was flat overall. This disguises a decline in 5G and fixed broadband capex, which, taken together with transmission, fell 7% in 2023. The delta of capex has gone on what operators call ‘computility’ (compute power in data centers and edge) and capabilities (developing the ability to serve mainly the industrial enterprise). Together these two items now account for about 35% of operator capex.
In Japan and South Korea, capex was also more or less flat (+0.5%). As in China, a high proportion of capex in Japan now goes on adjacent lines of business.
Capex declined by 5.5% in Europe. The European figure disguises the impact of the large number of smaller players in the continent. 5G spending has peaked, but so too has FTTP spending. FTTP spend represents a very high share of capex in Europe (about one half), although this is distributed differently across individual countries. Countries like France and Spain have passed that peak, but even in the UK, a relatively late starter, spend has plateaued. Among operators in emerging markets, the smallest group in absolute capex terms, there was a rise of 8%, steady now for three years running, driven almost entirely by India, and offset by declines elsewhere.
There will not be cyclical recovery of capex:
Operators’ longer-term projections of capex suggest, if anything, steepening declines in capex. Our forecasts indicate that capital intensity (capex/revenue) will fall from around 20% now to 12–14% by the end of the decade. Capex will fall basically because customers do not need more than the 1Gbit/s fibre and unlimited 5G that the current networks are easily capable of delivering, and growth in measurable demand slows every year. This will have the following effects:
•Fall in fixed access spend. Capex on FTTP is essentially a one-off investment in passive assets with very long useful lives. Future capex on upgrades (in effect replacements) of FTTP actives will come at a tiny fraction of this cost. The pipeline of plans for commercial build is running dry, although this is offset by some hefty subsidies for rural build, particularly in the USA. Those cablecos that have not already started will have to brace themselves for programs of replacement of HFC/DOCSIS by FTTP/xPON.
•We expect only limited uplift for 5G SA/5G Advanced. This is in part because some operators will not be able to justify a further upgrade after 5G NSA, in part because of slack demand, and in part because the sums involved will be lower than for the roll-out of 5G NSA.
•6G will not be capex-intensive. There is little appetite in free-market economies without centralised planning (and perhaps not so much even there) for a capex-intensive generational upgrade to 6G. There will be no cyclical uplift.
•There will be more outsourcing, i.e. replacement of capex by an opex line. This occurs mainly in infrastructure, but also in migrations of operations (IT capex) to the cloud. Yet this does not mean that capex is simply shifting from one class of business to another; infra companies exist in a world with similar constraints.
•In these circumstances there is a clear case for capex investment in anything that maximizes the efficient (and sustainable) use of the physical assets as they stand, and unlocks any opportunities that exist in new business-models. This is prominent in many operator outlooks.
…………………………………………………………………………………………………………………………………………………………………………………………………………………………………………………………
William Webb, an independent consultant and former executive at UK telecom regulator Ofcom, forecasts an S-curve flattening by 2027. In a forthcoming book called “The end of telecoms history,” Webb returns to predictions he first made in 2016 to gauge their accuracy. Using recent historical data from Barclays, he was able to show a close alignment with the S-curve he drew about eight years ago. If this behavior continues, growth rates “will fall to near zero by around 2027, with significant variations by country,” says Webb in his book, giving a sneak preview to Light Reading.
Webb’s broad rationale is that there is an upper limit on daily gigabyte consumption, just as there is only so much the average person can eat or drink. All Webb had to do was assume there will be some future gorging by customers on high-quality video, the most calorific meal for any smartphone. “Once they are watching video for all their free moments while downloading updates and attachments there is little more that they could usefully download,” he writes.
What of future services people do not currently enjoy? Outside virtual reality – which, for safety reasons, will probably always happen in a fixed-line environment – no app seems likely to chew through gigabytes as hungrily as moving images do in high definition. Webb clearly doubts the sort of artificial intelligence (AI) services being advertised by Apple will have much impact whatsoever.
“There may be substantially more traffic between data centers as models are trained but this will flow across high-capacity fiber connections which can be expanded easily if needed,” he told Light Reading by email. “At present AI interactions are generally in the form of text, which amounts to miniscule amounts of traffic.”
“Indeed, if time is diverted from consuming video to AI interactions, then AI may reduce the amount of network traffic,” he continued. Even if AI is used in future to create images and videos, rather than words, it will probably make no difference given the amount of video already consumed, merely substituting for more traditional forms of content, said Webb.
For those confident that data traffic growth stimulates investment, the other problem is the lack of any correlation between volumes and costs. Advanced networks are designed to cope with usage up to a certain high threshold before an upgrade is needed. Headline expenses have not risen in lockstep with gigabytes.
References:
https://www.lightreading.com/5g/ericsson-and-nokia-may-be-stuck-with-skinflint-customers-for-years
Dell’Oro & Omdia: Global RAN market declined in 2023 and again in 2024
U.S. Network Operators and Equipment Companies Agree: 5G CAPEX slowing more than expected
Dell’Oro: Optical Transport, Mobile Core Network & Cable CPE shipments all declined in 1Q-2024
Dell’Oro: 2023 global telecom equipment revenues declined 5% YoY; Huawei increases its #1 position
Where Have You Gone 5G? Midband spectrum, FWA, 2024 decline in CAPEX and RAN revenue
“The “5G Train Wreck” we predicted five years ago has come to pass. With the possible exception of China and South Korea, 5G has been an unmitigated failure- for carriers, network equipment companies, and subscribers/customers. And there haven’t been any significant performance advantages over 4G.”
MTN Consulting: Generative AI hype grips telecom industry; telco CAPEX decreases while vendor revenue plummets
Ever since Generative (Gen) AI burst into the mainstream through public-facing platforms (e.g. ChatGPT) late last year, its promising capabilities have caught the attention of many. Not surprisingly, telecom industry execs are among the curious observers wanting to try Gen AI even as it continues to evolve at a rapid pace.
MTN Consulting says the telecom industry’s bond with AI is not new though. Many telcos have deployed conventional AI tools and applications in the past several years, but Gen AI presents opportunities for telcos to deliver significant incremental value over existing AI. A few large telcos have kickstarted their quest for Gen AI by focusing on “localization.” Through localization of processes using Gen AI, telcos vow to eliminate language barriers and improve customer engagement in their respective operating markets, especially where English as a spoken language is not dominant.
Telcos can harness the power of Gen AI across a wide range of different functions, but the two vital telco domains likely to witness transformative potential of Gen AI are networks and customer service. Both these domains are crucial: network demands are rising at an unprecedented pace with increased complexity, and delivering differentiated customer experiences remains an unrealized ambition for telcos.
Several Gen AI use cases are emerging within these two telco domains to address these challenges. In the network domain, these include topology optimization, network capacity planning, and predictive maintenance, for example. In the customer support domain, they include localized virtual assistants, personalized support, and contact center documentation.
Most of the use cases leveraging Gen AI applications involve dealing with sensitive data, be it network-related or customer-related. This will have major implications from the regulatory point of view, and regulatory concerns will constrain telcos’ Gen AI adoption and deployment strategies. The big challenge is the mosaic of complex and strict regulations prevalent in different markets that telcos will have to understand and adhere to when implementing Gen AI use cases in such markets. This is an area where third-party vendors will try to cash in by offering Gen AI solutions that are compliant with regulations in the respective markets.
Vendors will also play a key role for small- and medium-sized telcos in Gen AI implementation, by eliminating constraints due to the lack of technical expertise and HW/SW resources, skilled manpower, along with opex costs burden. Key vendors to watch out for in the Gen AI space are webscale providers who possess the ideal combination of providing cloud computing resources required to train large language models (LLM) coupled with their Gen AI expertise offered through pre-trained models.
Other key points from MTN Consulting on Gen AI in the telecom industry:
- Network operations and customer support will be key transformative areas.
- Telco workforce will become leaner but smarter in the Gen AI era.
- Strict regulations will be a major barrier for telcos.
- Vendors key to Gen AI integration; webscale providers set for more telco gains.
- Lock-in risks and rising software costs are key considerations in choosing vendors.
………………………………………………………………………………………………………………………………
Separately, MTN Consulting’s latest forecast called for $320B of telco capex in 2023, down only slightly from the $328B recorded in 2022. Early 3Q23 revenue reports from vendors selling into the telco market call this forecast into question. The dip in the Americas is worse than expected, and Asia’s expected 2023 growth has not materialized.
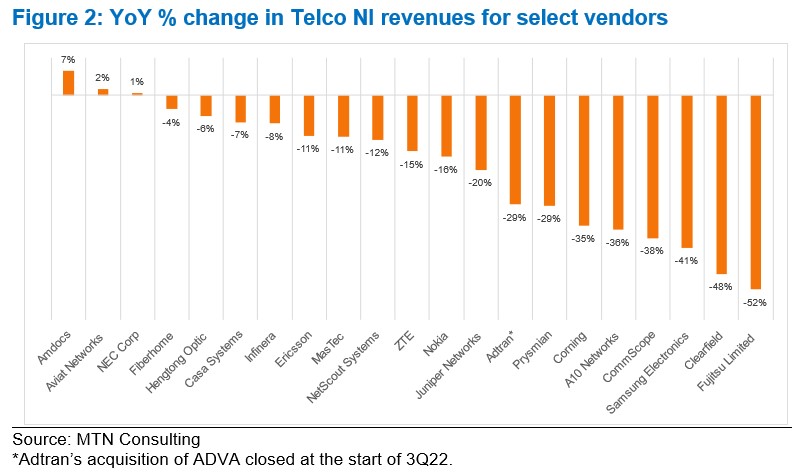
Key vendors are reporting significant YoY drops in revenue, pointing to inventory corrections, macroeconomic uncertainty (interest rates, in particular), and weaker telco spending. Network infrastructure sales to telcos (Telco NI) for key vendors Ericsson and Nokia dropped 11% and 16% YoY in 3Q23, respectively, measured in US dollars. By the same metric, NEC, Fujitsu and Samsung saw +1%, -52%, and -41% YoY growth; Adtran, Casa, and Juniper declined 29%, 7%, and 20%; fiber-centric vendors Clearfield, Corning, CommScope, and Prysmian all saw double digit declines.
MTN Consulting will update its operator forecast formally next month. In advance, this comment flags a weaker spending outlook than expected. Telco capex for 2023 is likely to come in around $300-$310B.
MTN Consulting’s Network Operator Forecast Through 2027: “Telecom is essentially a zero-growth industry”
MTN Consulting: Top Telco Network Infrastructure (equipment) vendors + revenue growth changes favor cloud service providers
Proposed solutions to high energy consumption of Generative AI LLMs: optimized hardware, new algorithms, green data centers
Cloud Service Providers struggle with Generative AI; Users face vendor lock-in; “The hype is here, the revenue is not”
Global Telco AI Alliance to progress generative AI for telcos
Amdocs and NVIDIA to Accelerate Adoption of Generative AI for $1.7 Trillion Telecom Industry
Bain & Co, McKinsey & Co, AWS suggest how telcos can use and adapt Generative AI
Generative AI Unicorns Rule the Startup Roost; OpenAI in the Spotlight
Generative AI in telecom; ChatGPT as a manager? ChatGPT vs Google Search
Generative AI could put telecom jobs in jeopardy; compelling AI in telecom use cases
MTN Consulting: Satellite network operators to focus on Direct-to-device (D2D), Internet of Things (IoT), and cloud-based services
MTN Consulting on Telco Network Infrastructure: Cisco, Samsung, and ZTE benefit (but only slightly)
MTN Consulting: : 4Q2021 review of Telco & Webscale Network Operators Capex
Synergy Research: Growth in Hyperscale and Enterprise IT Infrastructure Spending; Telcos Remain in the Doldrums
Hyperscale cloud companies are spending more and more money on Capex IT infrastructure compared with the largest telecommunication companies as overall IT infrastructure spending in 2022 reached $700 billion. In 2022, hyperscale operators spent roughly $200 billion on Capex IT infrastructure such as network switches and data center hardware and software, representing a 9 percent increase annually and led by Amazon, Google and Microsoft, according to new data from IT market research firm Synergy Research Group.
Comparatively, telecom spending on IT infrastructure by companies like Verizon, AT&T and China Mobile dropped 4 percent in 2022 to approximately $290 billion, Synergy Research Group reported.
Hyperscale operator share of total spending has continued to rise steadily over the last few years, as continued growth in cloud and other digital services drive ever-higher spending levels. Telco spending remains heavily crimped by lack of meaningful growth in their revenue streams. Enterprise spending has also bounced back in the last two years after a soft spell in 2019 and 2020. The main drivers in the enterprise have been the continued long-term growth of hosted and cloud collaboration solutions, increased spending on network security, and a post-pandemic bounce back for both enterprise data centers and switches. In some segments, higher ASPs have also contributed, as cost increases due to supply chain issues are passed on to the customers of tech vendors.
Telcos remain locked in a low-to-no-growth world and their Capex reflects that. For hyperscale operators, the boom in cloud services and continued growth in other digital services is driving ongoing growth in spending. Telecom companies’ share of Capex IT infrastructure spending was 42 percent in 2022, down from 58 percent share in 2016. The largest telco spenders on technology infrastructure last year were China Mobile, Deutsche Telekom, Verizon, AT&T, NTT and China Telecom.
In 2022, hyperscale operators accounted for 29 percent share of the total Capex infrastructure spending market, up significantly from 13 percent share in 2016. Some of the biggest spenders in 2022 were Amazon, Apple, Google, Microsoft and Alibaba.

Overall spending by both fixed and mobile telco operators has been relatively flat over the past eight years, with annual spending levels for infrastructure hovering around $290 billion each year. Synergy market data covers total capital expenditure for telco and hyperscale operators mostly around networking and data center hardware and software.
The final market segment covered in Synergy’s new data is enterprise spending on IT infrastructure, which grew 9 percent year over year in 2022 to roughly $210 billion. The enterprise spend accounted for 29 percent of the total Capex infrastructure market in 2022.
“Enterprise spending has also bounced back a bit in the last two years after a soft spell in 2019 and 2020,” said Dinsdale. ince 2016, enterprise IT spending has grown by an average of over 6 percent annually. Synergy said to make the market data numbers more comparable, enterprise spending covers data center hardware and software, networking and collaboration tools. It excludes enterprise spending on communication and IT services, devices and business software.
“There has also been something of a post-pandemic bounce back for both enterprise data centers and switches, the former being helped by higher costs due to supply chain issues that are being passed on in the form of higher ASPs [average selling price],” said Dinsdale. “For equipment and software vendors, the good news is that overall IT infrastructure spending will continue to grow steadily over the next five years,” he added.
…………………………………………………………………………………………………………………………………………………………………………………………………..
About Synergy Research Group:
Synergy provides quarterly market tracking and segmentation data on IT and Cloud related markets, including vendor revenues by segment and by region. Market shares and forecasts are provided via Synergy’s uniquely designed online database SIA ™, which enables easy access to complex data sets. Synergy’s Competitive Matrix ™ and CustomView ™ take this research capability one step further, enabling our clients to receive on-going quantitative market research that matches their internal, executive view of the market segments they compete in.
Synergy Research Group helps marketing and strategic decision makers around the world via its syndicated market research programs and custom consulting projects. For nearly two decades, Synergy has been a trusted source for quantitative research and market intelligence.
To speak to an analyst or to find out how to receive a copy of a Synergy report, please contact [email protected] or 775-852-3330 extension 101.
…………………………………………………………………………………………………………………………………………………………………………………………………..
References:
https://www.crn.com/news/cloud/cloud-provider-spend-on-it-capex-climbs-as-telecom-falls
Synergy Research: public cloud service and infrastructure market hit $126B in 1Q-2022
Synergy Research: Microsoft and Amazon (AWS) Dominate IT Vendor Revenue & Growth; Popularity of Multi-cloud in 2021
Synergy Research: Hyperscale Operator Capex at New Record in Q3-2020
Synergy Research: Strong demand for Colocation with Equinix, Digital Realty and NTT top providers
Dell’Oro: Telecom Capex Growth to Slow in calendar years 2022-2024
Dell’Oro Group forecasts that telco capex growth will taper off in 2023 and 2024 after increasing 9% year-over-year in nominal USD terms and on track to advance 3% in 2022.
The market research firm states that the top fifty carriers in the world collectively generated combined annual revenue and investments of well over $1.4 T this past year. They estimate that these carriers account for roughly 80% of worldwide capex and revenue.
Dell’Oro’s Telecom Capex bi-annual reports (previously called Carrier Economics bi-annual reports) track the revenue and capital expenditure (capex) trends for these fifty-plus carriers.
“Telco investments, in general, have shown remarkable resilience to external factors including Covid-19 containment measures, supply chain disruptions, and economic uncertainties,” said Stefan Pongratz, Vice President and analyst with the Dell’Oro Group. “Surging wireless investments in the US taken together with non-mobile capex expansions in China will keep the momentum going in 2022,” continued Pongratz.
Stefan believes carrier revenue and capex trends can to some degree explain telecom equipment manufacturer revenue trends. The highly granular information provided in this report will enable carriers, system and component vendors, equity researchers, and regulatory bodies to assess growth opportunities and to observe performance practices in the telecom sector.
Additional highlights from the March 2022 3-year Telecom Capex forecast report:
- Global capex growth is expected to moderate from 9 percent in 2021 to 3 percent in 2022, before tapering off in 2023 and 2024.
- The coupling between carrier investments and manufacturing infrastructure revenues is expected to prevail over the short-term—capex and telecom equipment are on track to advance 3 percent and 4 percent in 2022, respectively.
- Short-term output acceleration is expected to be relatively broad-based, with investments growing in China and the US. At the same time, challenging comparisons in the US are expected to drag down the overall capex in the outer part of the forecast.
- Following a strong showing in 2021, capex growth prospects across Europe will be more muted in 2022.
Editor’s Note:
MTN Consulting estimates a nearly $325B annualized global capex in 2021, or nearly double the webscale total of $175B. The ratio of capex to revenues, or capital intensity, reached 17.2% in 2021, the highest level since 2015.
Excluding China/HK-based companies (which haven’t finished reporting), the top 10 biggest telco capex spenders in 2021 were AT&T, DT, Verizon, NTT, Comcast, Vodafone, Orange, Charter, America Movil, and Telefonica. The biggest capex gains in 2021 were seen at America Movil (+$2.54B versus 2020 total), Telecom Italia (+$2.49B), Verizon (+$2.09B), AT&T (+$1.93B), Deutsche Telekom (+$1.74B), BT (+$1.63B), and Rakuten ($1.47B). The DT jump is inflated slightly by its Sprint acquisition, which closed in April 2020.
MTN’s latest official global capex forecast is for $328B in 2022, a bit higher than 2021. “We are maintaining this target for now, but there is a high level of uncertainty and considerable downside risk.” No forecast beyond 2022 was provided.
The Dell’Oro Group Telecom Capex Report provides in-depth coverage of more than 50 telecom operators highlighting carrier revenue, capital expenditure, and capital intensity trends. The report provides actual and 3-year forecast details by carrier, by region by country (United States, Canada, China, India, Japan, and South Korea), and by technology (wireless/wireline). To purchase this report, please contact by email at [email protected].
Dell’Oro Group is a market research firm that specializes in strategic competitive analysis in the telecommunications and enterprise networks infrastructure, network security and data center IT markets. Our firm provides in-depth quantitative data and qualitative analysis to facilitate critical, fact-based business decisions. For more information, please contact Dell’Oro Group at +1.650.622.9400 or visit www.delloro.com.
China is already showing signs of slowing its 5G investment – China Telecom plans to reduce 5G investment by nearly 11% to 34 billion yuan (US$5.34 billion) this year, reported Light Reading’s Robert Clark in March. China Mobile has budgeted 110 billion yuan (US$17.3 billion) for spending on 5G networks in 2022, a 3.5% decline.
In the US, Dish Network is among service providers upping their 5G investments this year. Dish spent $1 billion on 5G-related capex in 2021 and plans to spend $2.5 billion in 2022 , reported Light Reading’s Jeff Baumgartner in February.
On the other hand, IDC doesn’t expect telecom capex to drop until 2024:
“COVID-19 has shown no long-term negative effects on telecommunications capex. IDC expects 2021 capex will grow versus 2020 and show no decline until at least 2024. If anything, COVID-19 has led to communications service providers increasing their network investments to sustain increase demand for connectivity and the speeds associated with it.” said Daryl Schoolar, IDC research director, Worldwide Telecommunications Insights.
References:
Worldwide Telecom Capex Growth to Taper Off in 2023, According to Dell’Oro Group
https://www.lightreading.com/5g/telco-capex-could-level-out-in-2023-delloro-reports/d/d-id/776610?
MTN Consulting: : 4Q2021 review of Telco & Webscale Network Operators Capex
https://www.idc.com/getdoc.jsp?containerId=US48465621
MTN Consulting: : 4Q2021 review of Telco & Webscale Network Operators Capex
by Matt Walker
Webscale revenues surge 25% to $2.1 trillion in 2021; capex of $175B drives global data center demand.
Introduction:
Revenues for the webscale sector of network operators ended 2021 at $2.14 trillion. That’s up 25% from 2020, and nearly 3x the total recorded in 2011. One reason for this is a dramatic uptick in cloud services revenues: cloud revenues for the top 3 (AWS, GCP and Azure) climbed 42% YoY, to $120.3B (per MTN Consulting). Still, this accounts for less than 6% of total webscale sector revenues. Larger factors behind 2021’s growth include: digital ad revenues for Alphabet and Facebook (Meta); ecommerce sales at Amazon, JD.Com, and Alibaba; and, 5G device revenue sales at Apple. The webscale sector is now comfortably larger than telecom, which recorded just under $1.9 trillion in 2021 revenues.
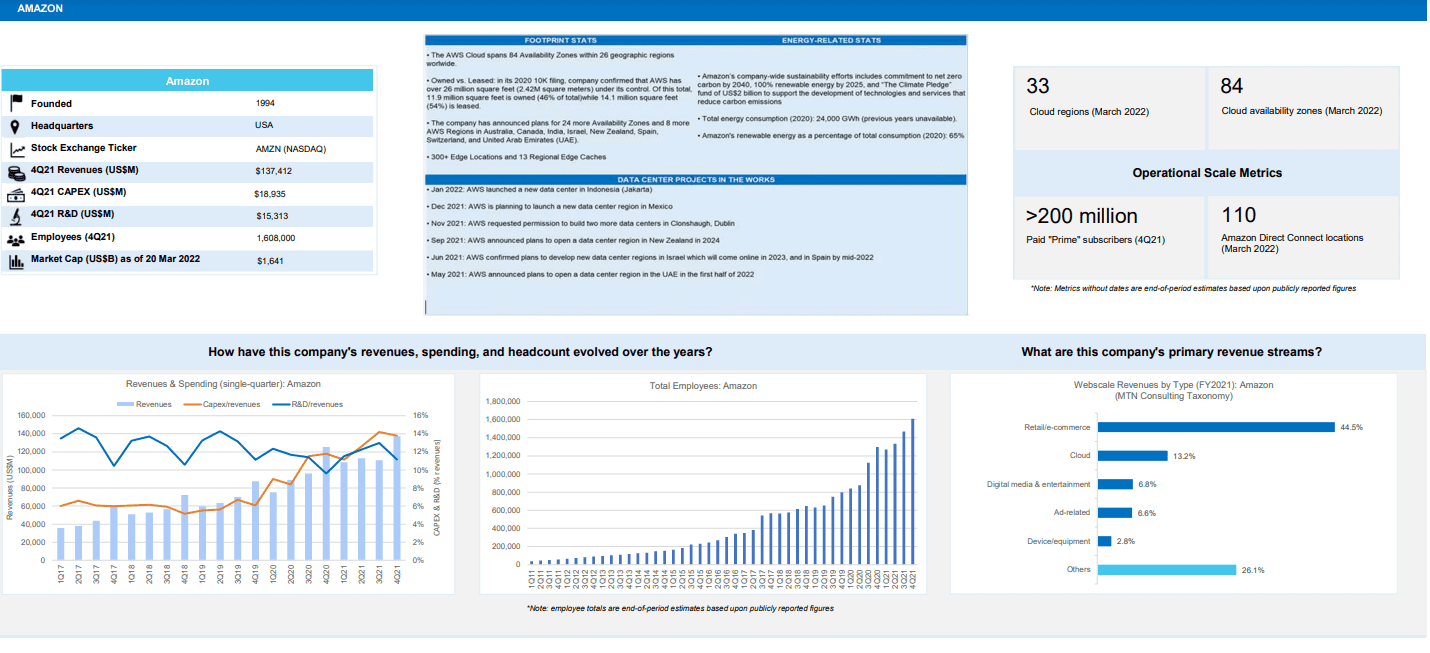
Here’s the profile for Amazon:
Capex- Telcos vs Webscalers:
On a capex basis, telecom remains far ahead, with nearly $325B in 2021 annualized capex, or nearly double the webscale total of $175B. Excluding China/HK-based companies (which haven’t finished reporting), the top 10 biggest telco capex spenders in 2021 were AT&T, DT, Verizon, NTT, Comcast, Vodafone, Orange, Charter, America Movil, and Telefonica. The biggest capex gains in 2021 were seen at America Movil (+$2.54B versus 2020 total), Telecom Italia (+$2.49B), Verizon (+$2.09B), AT&T (+$1.93B), Deutsche Telekom (+$1.74B), BT (+$1.63B), and Rakuten ($1.47B). The DT jump is inflated slightly by its Sprint acquisition, which closed in April 2020.
However, webscale is gradually bridging the capex gap with telcos: webscale capex spiked 30% YoY in 2021, versus an approximate 10% rise for telco capex. Capex in 4Q21 for webscalers was $50B, up 23% YoY. Webscalers also invest heavily in R&D, and have bleeding-edge requirements for the technology they deploy in their network. That has led them to drive the creation of many new innovations in network infrastructure over the last few years. These span semiconductors, optical transmission and components, intent-based routing, network automation, and other areas.
Facebook (Meta) is perhaps the most influential of all webscalers due in part to its openness and support for the OCP and TIP organizations.
Asia Pacific records best recent revenue growth in 2021
Regionally, the strongest growth in 2021 was in Asia Pacific, where revenues grew 29% YoY. The more mature Americas region lagged, with growth of just over 21% YoY. That pushed Americas down to about 44% of global webscale revenues, from 45% in 2020. Asia Pacific follows, with a 36% global revenue share, then Europe (17%) and MEA (3%). The Americas still account for the majority of webscale capex, with the US at the center. For instance, both Alphabet and Facebook (Meta) say well over 70% of their “long-lived assets” are in the US. Going forward, the non-US portion should rise as the cloud providers within the webscale market build out their global data center footprints. In January 2022, for example, AWS launched its first data center in Jakarta, Indonesia, and is planning a new region in Mexico.
Profitability still relatively high, but weaker than 2020:
Using a standardized definition of free cash flow (cash from operations less capex), the webscale sector’s FCF was $347.4B in 2021, or 16.2% of revenues. That is down significantly from a 19.7% margin in 2020. This ratio is still high relative to many sectors, however. The decline is due largely to a webscaler choice to accelerate capex during the COVID dislocation; that should pay off over the long run. Oracle, for instance, saw its FCF drop from 30.8% in 2020 to 17.2% in 2021, due mainly to its rapid cloud expansion. Nonetheless, Oracle says it will continue capex at a roughly $1B per quarter run rate, as it aspires to be the fourth major cloud provider with global scope. Amazon is actually the worst hit company in terms of FCF margin drop, due directly to its enormous 2021 capex outlays: Amazon’s FCF in 2021 was -3.1%, from 6.7% in 2020. Amazon, however, says its 2022 infrastructure (AWS) capex will likely rise.
Cash on hand, including short-term liquid investments, amounted to $747B for the webscale sector at the end of 4Q21, down 2% from the end of 2020. Total debt increased by 7%, to $518B. As a result, net debt (debt minus cash) in Dec. 2021 was -$228B for the webscale sector, from -$280B in December 2020. The companies with the biggest stockpiles of cash (and equivalents) are Alphabet ($139.6B), Microsoft ($125.4B), Amazon ($96.0B), and Apple ($63.9B). Facebook has just $48B, but no debt at all. Apple, IBM, and Oracle all have significantly more debt than cash.
Top 8 webscalers remain the biggest spenders, but Oracle and Twitter also important
This webscale tracker considers a “Top 8” group of companies as being, traditionally, the most influential in the market’s overall technology development and investments. These include three Chinese Internet companies (Alibaba, Baidu and Tencent), the world’s leading smartphone provider (Apple), the world’s biggest social media company (Facebook), and the leading three cloud providers: Alphabet, Amazon, and Microsoft. Ranking webscalers based on their share of tech capex, Amazon tops the list easily, accounting for 27.0% of network/IT capex in 2021. Amazon is followed by Alphabet (16.2%), Microsoft (14.0%), Facebook (10.0%), Tencent (6.3%), Apple (5.0%), Alibaba (4.1%), Oracle (2.9%), Baidu (2.1%), IBM (1.7%), HPE (1.5%), and Twitter (1.3%). Amazon’s recent capex surge is well known, and has supported expansion of the company’s AWS footprint and service offerings. Oracle has been quieter but its capex growth is equally impressive, from a smaller base: 2021 capex was $3.1B, up 70% from 2020. Twitter, a new addition to our webscale coverage, spends more on network/IT capex as a percentage of revenues (over 19%) than all other webscalers, due to ongoing software development and construction of its first owned data center.
The facilities these webscale players are building can be immense. For instance, Microsoft started construction recently on two new data centers in Des Moines Iowa, each of which costs over $1B and measures over 167K square meters (1.8 million square feet). These two are part of a cluster in the area, as is often the case; Microsoft already has three facilities around Des Moines. Facebook is working on a project in DeKalb, Illinois, roughly half the size at 84.2K square meters, costing US$800M and spreading across 500 acres of land. This construction project was announced in 2020 but won’t complete until 2023. These are just two examples of the many big facilities in the works in the webscale sector.
Who benefits from webscale capex?
The network spending of big webscalers is centered around immense, “hyperscale” data centers and undersea cable systems that support network traffic from the tech companies’ online retail, video, and social media platforms, along with cloud services. Webscale network operators (WNOs) may also own access networks, typically using fiber, microwave or mmWave, and even fixed satellite. WNOs exploring outer space for providing connectivity include Amazon, Apple, Alphabet, Facebook, and Microsoft.
A broad set of vendors are benefiting from WNO capex spending – from semiconductor players selling into the data center market (Intel, AMD, Nvidia, Broadcom, etc), to optical components & transport vendors selling into data center interconnect markets (e.g. Infinera, II-VI, Lumentum/Neophotonics), to contract manufacturers of white box/OCP servers (e.g. Wistron and Quanta). Cisco, for instance, recorded approximately $4.0B in 2021 sales to the webscale sector, up from about $2.1B in 2020. The construction industry also sees webscale as important, as much of their capex is for development of data center properties.
Network investment outlook:
Our current forecast calls for $187B of webscale capex in 2022, and further growth in the out-years until capex hits about $252B in 2026. For now, we are maintaining these targets. Despite a modest slippage in profitability, cash/debt and top-line growth in 4Q21, the sector retains many strengths which won’t go away overnight. Cloud services revenue growth remains strong, as does profitability for most players. Moreover, 2022 capex guidance from the major webscalers suggests modest growth; a summary follows:
- Amazon: 4Q21 earnings call confirmed that network/IT (“infrastructure” for AWS) is about 40% of total, consistent with MTN Consulting assumptions. Other components are fulfillment/logistics and transportation. For future capex, it says “we’re still working through some of our plans for 2022, but it’s coming into focus a bit. We see the CapEx for infrastructure going up…we’re adding regions and capacity to handle usage that still exceeds revenue growth in that business. So we feel good about making those investments.”
- Facebook (Meta): still calling for 2022 capex, including principal payments on finance leases, in the range of $29-34 billion (2021 actual: $19.2 billion). Says capex is driven by investments in data centers, servers, network infrastructure, and office facilities, and next year’s figure “reflects a significant increase in our AI and Machine Learning investments, which will support a number of areas across our Family of Apps.”
- Alphabet: projects a “meaningful increase in CapEx” for 2022, due to both technical infrastructure (mainly servers) and office facilities, where the company says it is “reaccelerating investment in fit-outs and ground-up construction.”
- Microsoft: expects 1Q22 capex to decline sequentially versus 4Q21, a change from the prior year period when 1Q21’s total capex was up 22% versus 4Q20. Does not provide any longer-term guidance. Its pending acquisition of Activision Blizzard is likely a factor in future plans, for two reasons. First, the deal consumes a lot of cash, and second, absorbing Activision would likely come with some changes in data center strategy. Currently Activision does not have any of its own data centers, rather, it rents colocation space in third-party facilities. The combined company will clearly want to see benefits from Microsoft’s data center footprint.
- Oracle: expects capex to continue in the roughly $1B per quarter range through the end of its current fiscal year (May 2022).
- Tencent: no concrete guidance but has hinted at Facebook-like investments in the “metaverse,” says it has a lot of the building blocks needed, for example, “a lot of gaming experiences…very strong social networking experience…engine capability, we have AI capability, we have the capability to build a large server architecture that can serve a huge number of concurrent users. We are very experienced in managing digital content economies as well as real-life digital assets.”
- Apple: nothing concrete on capex specifically, but in April 2021 it announced “$430 billion in contributions to the US economy include direct spend with American suppliers, data center investments, capital expenditures in the US, and other domestic spend…”
- Alibaba: no concrete guidance but 4Q21 call said it will continue to “invest in expanding its international infrastructure,” saying it now provides cloud services in 25 regions globally and that it is “committed to serving the real economy for the long term and the digitalization of all industries”. At its Apsara conference in October 2021, the company unveiled several new proprietary products, including Yitian 710 server chip, the X-Dragon architecture, Panjiu cloud-native server series, Alibaba AI and big data platform and a new generation of PolarDB database. It has global aspirations for its IaaS and PaaS services.
- Baidu: hasn’t addressed capex recently but on 4Q21 earnings call cited strong cloud demand growth, and said it is “trying to retain rapid revenue growth for 2022 and beyond,” which will require infrastructure investments.
- Twitter: its capex appears to be moderating now that it has (largely) completed construction of its new data center.
While we are maintaining the forecast outlook as published in Dec 2021, Amazon is a wildcard. It provides no specific guidance, and is clearly the market leader. Its quarterly outlays will be watched carefully. Even if its total capex does moderate, it is possible that the network/IT % of total will rise.
Implications for carrier-neutral market segment:
Webscalers with cloud operations are building out their data center footprints, and most webscalers are deploying more complex functionality into their networks (video, gaming, AI, metaverse). However, webscalers do have some financial pressures, and more important have an increasingly rich range of options for how they expand. The carrier-neutral segment (CNNO) of data center players is investing heavily in larger, more hyperscale-friendly and energy efficient facilities. Further, the sector is consolidating with help from private equity. MTN Consulting expects webscalers to continue to lean heavily on these third-parties for expansion in 2022 and beyond. As a result, data center CNNOs like Digital Realty, Equinix and its JV partners, QTS/Blackstone, CyrusOne/KKR/GIP, American Tower/CoreSite, and GDS will become more attractive to vendors as they invest more in network technology of their own.
References:
MTN Consulting: Network Infrastructure market grew 5.1% YoY; Telco revenues surge 12.2% YoY
MTN Consulting: Network operator capex forecast at $520B in 2025
Will AT&T’s huge fiber build-out win broadband market share from cablecos/MSOs?
AT&T added 235,000 fiber connections in the first quarter, ending the period with nearly 5.2 million total fiber customers. AT&T says they have a total of around 15 million fiber and non-fiber customers, so fiber access is approximately 1/3 of total customers now.
The company recently announced it plans to build fiber to 3 million new customer locations this year and 4 million next year. AT&T plans to double the number of locations where it offers fiber Internet, from approximately 15 million to about 30 million, by 2025. To do that, AT&T is planning to increase its annual capital expenses from $21 billion to around $24 billion.
AT&T’s new focus on connectivity over content is a direct result of its spinning off Warner Media to Discovery, as we chronicled in this IEEE Techblog post. Thaddeus Arroyo, head of AT&T’s consumer business, made that crystal clear at a recent BoA investor event:
“We expect capital expenditures of about $24 billion a year after the Warner Media discovery transaction closes. That’s an incremental investment that’s going to go to fiber to 5G capacity and 5G C-band deployment.
We have another great opportunity, the one we continue to talk around fiber. So as part of this capital, we’re going to be investing in fiber expansion to meet the growing needs for bandwidth that require a much more robust fiber network regardless of the last mile serving technology. Fiber is the foundation that fuels our network. Expanding our fiber reach serves multiple services hanging off at each strand of fiber. It includes macro cell sites, small cell sites, wholesale services, enterprise, small business, and fiber that’s extended directly into our customers’ homes and into businesses.
We plan to reach 30 million customer locations passed with fiber by the end of 2025. That’s going to double our existing fiber footprint. And investing in fiber drives solid returns because it’s a superior product. Where we have fiber we win, we’re improving share in our fiber footprint, and the penetration rates are accelerating and growing, given our increased financial flexibility. We’re comfortable in our ability to invest and achieve our leverage targets that we outlined of getting to 2.6% at close and below 2.5% by the end of 2023.”
Mo Katibeh, the AT&T executive responsible for fiber and 5G build-outs, added on via a recent post on LinkedIn: “We are building MORE Fiber to MORE homes and businesses. And we’re talking A LOT of fiber – MILLIONS of new locations every year, planning to cover 30 MILLION customer locations by the end of 2025! And you know what comes with all that investment in America? JOBS. Our AT&T Network Build team is GROWING..”
Previously, Katibeh wrote on LinkedIn : “Contributing to a large portion of the $105B Capital spend between 2016 and 2020 – our team is building out AT&T #Fiber to MILLIONS of new customer locations in 2021, as well as augmenting America’s best mobility network with more capacity, more speed – and more #5G (you know I love 5G!).”

…………………………………………………………………………………………………………………………………………………………..
So with all that said, will AT&T’s fiber build-out keep pace with cable companies/MSOs DOCSIS networks?
Tom Rutledge, Charter’s CEO, made a brief comment about plant upgrades on the earnings call (note – Dave Watson made similar comments on the Comcast earnings call):
“We’re continuously increasing the capacity in our core and hubs and augmenting our network to improve speed and performance at a pace dictated by customers in the marketplace. We have a cost-effective approach to using DOCSIS 3.1, which we’ve already deployed, to expand our network capacity 1.2 gigahertz, which gives us the ability to offer multi-gigabit speeds in the downstream and at least 1 gigabit per second in the upstream.”
According to Leichtman Research Group, the top cable companies had 68 million broadband subscribers, and top wireline telecom companies had 33.2 million subscribers at the end of 2019.
“Based on the currently available information, cable stole wired broadband market share in Verizon and AT&T markets as well. Oy vey!” said Jim Patterson of Patterson Advisory Group in his May 2, 2021 newsletter. “Think about Comcast and AT&T as having roughly the same number of homes passed (AT&T probably closer to 57 million homes versus the nearly 60 million shown for Comcast),” he added. Patterson noted that top cable companies Comcast, Charter and Altice managed to capture 86% of broadband customer growth in the U.S. in the first quarter of this year.
“(AT&T) fiber connections simply aren’t growing fast enough to keep up,” wrote colleague Craig Moffett of MoffettNathanson in a recent note to clients. Here’s more:
To be sure, there are questions about the extent to which these deployments will overlap cable (or will instead be focused on unserved rural communities), and the extent to which labor and supply chain contraints might limit acheivability of announced targets. Still, taken together, these deployments suggest that, after a precipitous decline in new fiber construction in 2020, planned fiber deployments do, indeed, rise over the next two years; we expect that both 2021 and 2022 will represent new all-time peaks in total number of fiber homes passed. Typically, the competitive impact from overbuilds is felt with some lag, suggesting the impact on cable operators will peak in 2024/2025.
At the same time, we expect that federal stimulus to accelerate broadband market growth in 2021 and 2022, perhaps significantly, with new household formation, in particular, driving upside to 2021 and 2022 forecasts.
Longer term, however, Cable operators will have to contend with more fiber overbuilds, as TelCos increasingly see both more favorable economics for fiber deployment and increasingly acknowledge that their copper plant faces imminent obsolescence without it. The forecasts for fiber deployment in this note suggest that 2021 will be a record for fiber construction – assuming labor and materials capacity can accommodate the TelCos’ own forecasts – and 2022 will step up higher still. After that, deployments are expected to abate, at least to a degree.
“Cable can upgrade its plant quickly and at low cost to offer at least 4.6Gbit/s down and 1.5Gbit/s up, well beyond current fiber offerings. They can do this before the move to DOCSIS 4.0, which is still years off,” wrote the financial analysts at New Street Research in a recent note to investors. The result, according to the New Street analysts, is that fiber providers like AT&T won’t necessarily be able to dominate the fiber market with a 1 Gbit/s FTTH/FTTP connection and take market share from cable incumbents.
“Cable will face new fiber competition in more of its markets over the next few years; however, there is little to no prospect of fiber delivering a service in those markets that cable can’t easily match or beat,” New Street concluded.
…………………………………………………………………………………………………………………………………………………………….
“Looking back and being a little critical, we probably allowed the cable companies to execute and to take share in that market in a significant way,” AT&T CFO Pascal Desroches said at a recent Credit Suisse investor event.
AT&T executives have said that the company’s fiber investment ultimately will generate internal returns of around 15%. Desroches said that return on investment will be due to a variety of factors. Fiber “supports not only consumer needs, it supports needs for our enterprise businesses as well as needs for potentially our reseller business. So being able to look across and integrate the planning for fiber deployment such that it not only serves consumer needs, but it serves these other market adjacencies as well is something that we haven’t been very good at historically, That’s why we’re really bullish and we believe we’re going to be able to execute really well here,” AT&T’s CFO concluded.
References:
https://www.lightreading.com/opticalip/is-atandts-fiber-investment-good-idea/d/d-id/770468?
https://www.linkedin.com/feed/update/urn:li:activity:6813211481950318592/
MTN Consulting: Network operator capex forecast at $520B in 2025
Executive Summary:
Telco, webscale and carrier-neutral capex will total $520 billion by 2025 according to a report from MTN Consulting.. That’s compared with $420 billion in 2019.
- Telecom operators (telco) will account for 53% of industry Capex by 2025 vs 9% in 2019;
- Webscale operators will grow from 25% to 39%;
- Carrier-neutral [1.] providers will add 8% of total Capex in 2025 from 6% in 2019.
Note 1. A Carrier-neutral data center is a data center (or carrier hotel) which allows interconnection between multiple telecommunication carriers and/or colocation providers. It is not owned and operated by a single ISP, but instead offers a wide variety of connection options to its colocation customers.
Adequate power density, efficient use of server space, physical and digital security, and cooling system are some of the key attributes organizations look for in a colocation center. Some facilities distinguish themselves from others by offering additional benefits like smart monitoring, scalability, and additional on-site security.
……………………………………………………………………………………………………………………………………………………….
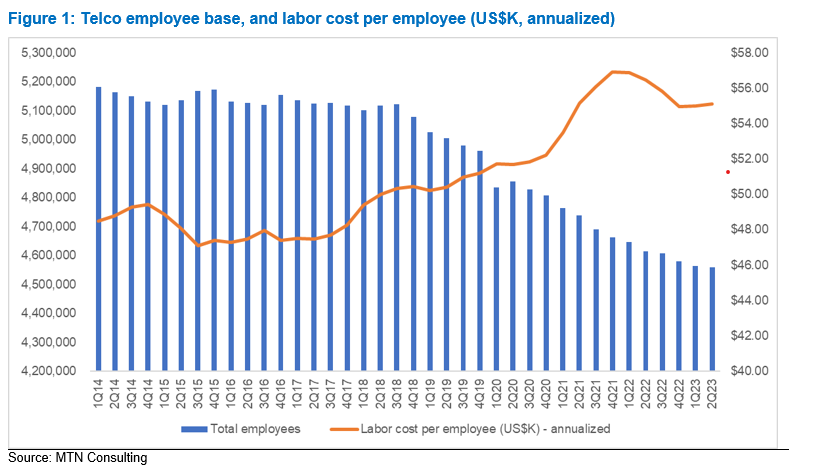
The number of telco employees will decrease from 5.1 million in 2019 to 4.5 million in 2025 as telcos deploy automation more widely and spin off parts of their network to the carrier-neutral sector.
By 2025, the webscale sector will dominate with revenues of approximately $2.51 trillion, followed by $1.88 trillion for the telco sector and $108 billion for carrier-neutral operators (CNNOs).
KEY FINDINGS from the report:
Revenue growth for telco, webscale and carrier-neutral sector will average 1, 10, and 7% through 2025
Telecom network operator (TNO, or telco) revenues are on track for a significant decline in 2020, with the industry hit by COVID-19 even as webscale operators (WNOs) experienced yet another growth surge as much of the world was forced to work and study from home. For 2020, telco, webscale, and carrier-neutral revenues are likely to reach $1.75 trillion (T), $1.63T, and $71 billion (B), amounting to YoY growth of -3.7%, +12.2%, and 5.0%, respectively. Telcos will recover and webscale will slow down, but this range of growth rates will persist for several years. By 2025, the webscale sector will dominate with revenues of approximately $2.51 trillion, followed by $1.88 trillion for the telco sector and $108 billion for carrier-neutral operators (CNNOs).
Network operator capex will grow to $520B by 2025
In 2019, telco, webscale and carrier-neutral capex totaled $420 billion, a total which is set to grow to $520 billion by 2025. The composition will change starkly though: telcos will account for 53% of industry capex by 2025, from 9% in 2019; webscale operators will grow from 25% to 39% in the same timeframe; and, carrier-neutral providers will add 8% of total capex in 2025 from their 2019 level of 6%.
By 2025, the webscale sector will employ more than the telecom industry
As telcos deploy automation more widely and cast off parts of their network to the carrier-neutral sector, their employee base should decline from 5.1 million in 2019 to 4.5 million in 2025. The cost of the average telco employee will rise significantly in the same timeframe, as they will require many of the same software and IT skills currently prevalent in the webscale workforce. For their part, webscale operators have already grown from 1.3 million staff in 2011 to 2.8 million in 2019, but continued rapid growth in the sector (especially its ecommerce arms) will spur further growth in employment to reach roughly 4.8 million by 2025. The carrier-neutral sector’s headcount will grow far more modestly, rising from 90 million in 2019 to about 119 million in 2025. Managing physical assets like towers tends to involve a far lighter human touch than managing network equipment and software.

Example of a Carrier Neutral Colo Data Center
RECOMMENDATIONS:
Telcos: embrace collaboration with the webscale sector
Telcos remain constrained at the top line and will remain in the “running to stand still” mode that has characterized their last decade. They will continue to shift towards more software-centric operations and automation of networks and customer touch points. What will become far more important is for telcos to actively collaborate with webscale operators and the carrier-neutral sector in order to operate profitable businesses. The webscale sector is now targeting the telecom sector actively as a vertical market. Successful telcos will embrace the new webscale offerings to lower their network costs, digitally transform their internal operations, and develop new services more rapidly. Using the carrier-neutral sector to minimize the money and time spent on building and operating physical assets not viewed as strategic will be another key to success through 2025.
Vendors: to survive you must improve your partnership and integration capabilities
Collaboration across the telco/webscale/carrier-neutral segments has implications for how vendors serve their customers. Some of the biggest telcos will source much of their physical infrastructure from carrier-neutral providers and lean heavily on webscale partners to manage their clouds and support new enterprise and 5G services. Yet telcos spend next to nothing on R&D, especially when compared to the 10% or more of revenues spent on R&D by their vendors and the webscale sector. Vendors who develop customized offerings for telcos in partnership with either their internal cloud divisions (e.g. Oracle, HPE, IBM) or AWS/GCP/Azure/Alibaba will have a leg up. This is not just good for growing telco business, but also for helping webscale operators pursue 5G-based opportunities. One of the earliest examples of a traditional telco vendor aligning with a cloud player for the telco market is NEC’s 2019 development of a mobile core solution for the cloud that can be operated on the AWS network; there will be many more such partnerships going forward.
All sectors: M&A is often not the answer, despite what the bankers urge
M&A will be an important part of the network infrastructure sector’s evolution over the next 5 years. However, the difficulty of successfully executing and integrating a large transaction is almost always underappreciated. There is incredible pressure from bankers to choose M&A, and the best ones are persuasive in arguing that M&A is the best way to improve your competitiveness, enter a new market, or lower your cost base. Many chief executives love to make the big announcements and take credit for bringing the parties together. But making the deal actually work in practice falls to staff way down the chain of command, and to customers’ willingness to cope with the inevitable hiccups and delays brought about by the transaction. And the bankers are long gone by then, busy spending their bonuses and working on their next deal pitch. Be extremely skeptical about M&A. Few big tech companies have a history of doing it well.
Webscale: stop abusing privacy rights and trampling on rules and norms of fair competition
The big tech companies that make up the webscale sector tracked by MTN Consulting have been rightly abused in the press recently for their disregard for consumer privacy rights, and overly aggressive, anti-competitive practices. After years of avoiding increased regulatory oversight through aggressive lobbying and careful brand management, the chickens are coming home to roost in 2021. Public concerns about abuses of privacy, facilitation of fake news, and monopolistic or (at the least) oligopolistic behavior will make it nearly impossible for these companies to stem the increased oversight likely to come soon from policymakers.
Australia’s pending law, the “News Media and Digital Platforms Bargaining Code,” could foreshadow things to come for the webscale sector, as do recent antitrust lawsuits against Facebook and Alphabet. Given that webscale companies are supposed to be fast moving and innovative, they should get out ahead of these problems. They need to implement wholesale, transparent changes to how they treat consumer privacy and commit to (and actually follow) a code of conduct that is conducive to innovation and competition. The billionaires leading the companies may even consider encouraging fairer tax codes so that some of their excessive wealth can be spread across the countries that actually fostered their growth.
ABOUT THIS REPORT:
This report presents MTN Consulting’s first annual forecast of network operator capex. The scope includes telecommunications, webscale and carrier-neutral network operators. The forecast presents revenue, capex and employee figures for each market, both historical and projected, and discusses the likely evolution of the three sectors through 2025. In the discussion of the individual sectors, some additional data series are projected and analyzed; for example, network operations opex in the telco sector. The forecast report presents a baseline, most likely case of industry growth, taking into account the significant upheaval in communication markets experienced during 2020. Based on our analysis, we project that total network operator capex will grow from $420 billion in 2020 to $520 billion in 2025, driven by substantial gains in the webscale and (much less so) carrier-neutral segments. The primary audience for the report is technology vendors, with telcos and webscale/cloud operators a secondary audience.
References:
………………………………………………………………………………………………………………………………………………….
January 8, 2021 Update:
Analysys Mason: Cloud technology will pervade the 5G mobile network, from the core to the RAN and edge
“Communications Service Providers (CSPs) spending on multi-cloud network infrastructure software, hardware and professional services will grow from USD4.3 billion in 2019 to USD32 billion by 2025, at a CAGR of 40%.”
5G and edge computing are spurring CSPs to build multi-cloud, cloud-native mobile network infrastructure
Many CSPs acknowledge the need to use cloud-native technology to transform their networks into multi-cloud platforms in order to maximise the benefits of rolling out 5G. Traditional network function virtualisation (NFV) has only partly enabled the software-isation and disaggregation of the network, and as such, limited progress has been made on cloudifying the network to date. Indeed, Analysys Mason estimates that network virtualisation reached only 6% of its total addressable market for mobile networks in 2019.
The telecoms industry is now entering a new phase of network cloudification because 5G calls for ‘true’ clouds that are defined by cloud-native technologies. This will require radical changes to the way in which networks are designed, deployed and operated, and we expect that investments will shift to support this new paradigm. The digital infrastructure used for 5G will be increasingly built as horizontal, open network platforms comprising multiple cloud domains such as mobile core cloud, vRAN cloud and network and enterprise edge clouds. As a result, we have split the spending on network cloud into spending on multiple cloud domains (Figure 1) for the first time in our new network cloud infrastructure report. We forecast that CSP spending on multi-cloud network infrastructure software, hardware and professional services will grow from USD4.3 billion in 2019 to USD32 billion by 2025, at a CAGR of 40%.
https://www.analysysmason.com/research/content/comments/network-cloud-forecast-comment-rma16/
