

capex
Big tech spending on AI data centers and infrastructure vs the fiber optic buildout during the dot-com boom (& bust)
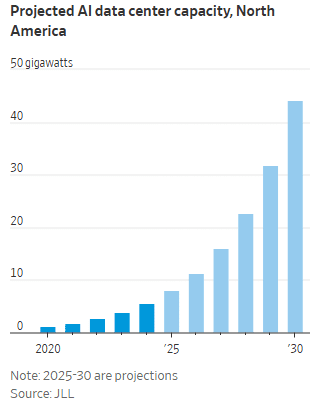
Big Tech plans to spend between $364 billion and $400 billion on AI data centers, purchasing specialized AI hardware like GPUs, and supporting cloud computing/storage capacity. The final 2Q 2025 GDP report, released last week, reveals a surge in data center infrastructure spending from $9.5 billion in early 2020 to $40.4 billion in the second quarter of 2025. It’s largely due to an unprecedented investment boom driven by artificial intelligence (AI) and cloud computing. The increase highlights a monumental shift in capital expenditure by major tech companies.
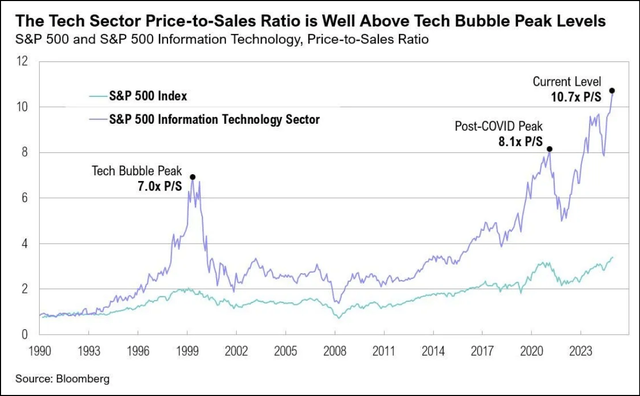
Yet there are huge uncertainties about how far AI will transform scientific discovery and hypercharge technological advance. Tech financial analysts worry that enthusiasm for AI has turned into a bubble that is reminiscent of the mania around the internet’s infrastructure build-out boom from 1998-2000. During that time period, telecom network providers spent over $100 billion blanketing the country with fiber optic cables based on the belief that the internet’s growth would be so explosive that such massive investments were justified. The “talk of the town” during those years was the “All Optical Network,” with ultra-long haul optical transceiver, photonic switches and optical add/drop multiplexers. 27 years later, it still has not been realized anywhere in the world.
The resulting massive optical network overbuilding made telecom the hardest hit sector of the dot-com bust. Industry giants toppled like dominoes, including Global Crossing, WorldCom, Enron, Qwest, PSI Net and 360Networks.
However, a key difference between then and now is that today’s tech giants (e.g. hyperscalers) produce far more cash than the fiber builders in the 1990s. Also, AI is immediately available for use by anyone that has a high speed internet connection (via desktop, laptop, tablet or smartphone) unlike the late 1990s when internet users (consumers and businesses) had to obtain high-speed wireline access via cable modems, DSL or (in very few areas) fiber to the premises.
……………………………………………………………………………………………………………………………………………………………………………………………………………………………….
Today, the once boring world of chips and data centers has become a raging multi-hundred billion dollar battleground where Silicon Valley giants attempt to one up each other with spending commitments—and sci-fi names. Meta CEO Mark Zuckerberg teased his planned “Hyperion” mega-data center with a social-media post showing it would be the size of a large chunk of Manhattan.
OpenAI’s Sam Altman calls his data-center effort “Stargate,” a reference to the 1994 movie about an interstellar time-travel portal. Company executives this week laid out plans that would require at least $1 trillion in data-center investments, and Altman recently committed the company to pay Oracle an average of approximately $60 billion a year for AI compute servers in data centers in coming years. That’s despite Oracle is not a major cloud service provider and OpenAI will not have the cash on hand to pay Oracle.
In fact, OpenAI is on track to realize just $13 billion in revenue from all its paying customers this year and won’t be profitable till at least 2029 or 2030. The company projects its total cash burn will reach $115 billion by 2029. The majority of its revenue comes from subscriptions to premium versions of ChatGPT, with the remainder from selling access to its models via its API. Although ~ 700 million people—9% of the world’s population—are weekly users of ChatGPT (as of August, up from 500 million in March), its estimated that over 90% use the free version. Also this past week:
- Nvidia plans to invest up to $100 billion to help OpenAI build data center capacity with millions GPUs.
- OpenAI revealed an expanded deal with Oracle and SoftBank , scaling its “Stargate” project to a $400 billion commitment across multiple phases and sites.
- OpenAI deepened its enterprise reach with a formal integration into Databricks — signaling a new phase in its push for commercial adoption.
Nvidia is supplying capital and chips. Oracle is building the sites. OpenAI is anchoring the demand. It’s a circular economy that could come under pressure if any one player falters. And while the headlines came fast this week, the physical buildout will take years to deliver — with much of it dependent on energy and grid upgrades that remain uncertain.
Another AI darling is CoreWeave, a company that provides GPU-accelerated cloud computing platforms and infrastructure. From its founding in 2017 until its pivot to cloud computing in 2019, Corweave was an obscure cryptocurrency miner with fewer than two dozen employees. Flooded with money from Wall Street and private-equity investors, it has morphed into a computing goliath with a market value bigger than General Motors or Target.
…………………………………………………………………………………………………………………………………………………………………………………………………………………………………………………………………………………….
Massive AI infrastructure spending will require tremendous AI revenue for pay-back:
David Cahn, a partner at venture-capital firm Sequoia, estimates that the money invested in AI infrastructure in 2023 and 2024 alone requires consumers and companies to buy roughly $800 billion in AI products over the life of these chips and data centers to produce a good investment return. Analysts believe most AI processors have a useful life of between three and five years.
This week, consultants at Bain & Co. estimated the wave of AI infrastructure spending will require $2 trillion in annual AI revenue by 2030. By comparison, that is more than the combined 2024 revenue of Amazon, Apple, Alphabet, Microsoft, Meta and Nvidia, and more than five times the size of the entire global subscription software market.

Morgan Stanley estimates that last year there was around $45 billion of revenue for AI products. The sector makes money from a combination of subscription fees for chatbots such as ChatGPT and money paid to use these companies’ data centers. How the tech sector will cover the gap is “the trillion dollar question,” said Mark Moerdler, an analyst at Bernstein. Consumers have been quick to use AI, but most are using free versions, Moerdler said. Businesses have been slow to spend much on AI services, except for the roughly $30 a month per user for Microsoft’s Copilot or similar products. “Someone’s got to make money off this,” he said.
…………………………………………………………………………………………………………………………………………………………………………………………………………………………………………………………………………………….
Why this time is different (?):
AI cheerleaders insist that this boom is different from the dot-com era. If AI continues to advance to the point where it can replace a large swath of white collar jobs, the savings will be more than enough to pay back the investment, backers argue. AI executives predict the technology could add 10% to global GDP in coming years.
“Training AI models is a gigantic multitrillion dollar market,” Oracle chairman Larry Ellison told investors this month. The market for companies and consumers using AI daily “will be much, much larger.”
The financing behind the AI build-out is complex. Debt is layered on at nearly every level. his “debt-fueled arms race” involves large technology companies, startups, and private credit firms seeking innovative ways to fund the development of data centers and acquire powerful hardware, such as Nvidia GPUs. Debt is layered across different levels of the AI ecosystem, from the large tech giants to smaller cloud providers and specialized hardware firms.
Alphabet, Microsoft, Amazon, Meta and others create their own AI products, and sometimes sell access to cloud-computing services to companies such as OpenAI that design AI models. The four “hyperscalers” alone are expected to spend nearly $400 billion on capital investments next year, more than the cost of the Apollo space program in today’s dollars. Some build their own data centers, and some rely on third parties to erect the mega-size warehouses tricked out with cooling equipment and power.
…………………………………………………………………………………………………………………………………………………………………………………………………………………………………………………………………………………….
Echoes of bubbles past:
History is replete with technology bubbles that pop. Optimism over an invention—canals, electricity, railroads—prompts an investor stampede premised on explosive growth. Overbuilding follows, and investors eat giant losses, even when a new technology permeates the economy. Predicting when a boom turns into a bubble is notoriously hard. Many inflate for years. Some never pop, and simply stagnate.
The U.K.’s 19th-century railway mania was so large that over 7% of the country’s GDP went toward blanketing the country with rail. Between 1840 and 1852, the railway system nearly quintupled to 7,300 miles of track, but it only produced one-fourth of the revenue builders expected, according to Andrew Odlyzko,PhD, an emeritus University of Minnesota mathematics professor who studies bubbles. He calls the unbridled optimism in manias “collective hallucinations,” where investors, society and the press follow herd mentality and stop seeing risks.
He knows from firsthand experience as a researcher at Bell Labs in the 1990s. Then, telecom giants and upstarts raced to speculatively plunge tens of millions of miles of fiber cables into the ground, spending the equivalent of around 1% of U.S. GDP over half a decade.
Backers compared the effort to the highway system, to the advent of electricity and to discovering oil. The prevailing belief at the time, he said, was that internet use was doubling every 100 days. But in reality, for most of the 1990s boom, traffic doubled every year, Odlyzko found.
The force of the mania led executives across the industry to focus on hype more than unfavorable news and statistics, pouring money into fiber until the bubble burst.
“There was a strong element of self interest,” as companies and executives all stood to benefit financially as long as the boom continued, Odlyzko said. “Cautionary signs are disregarded.”
Kevin O’Hara, a co-founder of upstart fiber builder Level 3, said banks and stock investors were throwing money at the company, and executives believed demand would rocket upward for years. Despite worrying signs, executives focused on the promise of more traffic from uses like video streaming and games.
“It was an absolute gold rush,” he said. “We were spending about $110 million a week” building out the network.
When reality caught up, Level 3’s stock dropped 95%, while giants of the sector went bust. Much of the fiber sat unused for over a decade. Ultimately, the growth of video streaming and other uses in the early 2010s helped soak up much of the oversupply.
Worrying signs:
There are growing, worrying signs that the optimism about AI won’t pan out.
- MIT Media Lab (2025): The “State of AI in Business 2025” report found that 95% of custom enterprise AI tools and pilots fail to produce a measurable financial impact or reach full-scale production. The primary issue identified was a “learning gap” among leaders and organizations, who struggle to properly integrate AI tools and redesign workflows to capture value.
- A University of Chicago economics paper found AI chatbots had “no significant impact on workers’ earnings, recorded hours, or wages” at 7,000 Danish workplaces.
- Gartner (2024–2025): The research and consulting firm has reported that 85% of AI initiatives fail to deliver on their promised value. Gartner also predicts that by the end of 2025, 30% of generative AI projects will be abandoned after the proof-of-concept phase due to issues like poor data quality, lack of clear business value, and escalating costs.
- RAND Corporation (2024): In its analysis, RAND confirmed that the failure rate for AI projects is over 80%, which is double the failure rate of non-AI technology projects. Cited obstacles include cost overruns, data privacy concerns, and security risks.
OpenAI’s release of ChatGPT-5 in August was widely viewed as an incremental improvement, not the game-changing thinking machine many expected. Given the high cost of developing it, the release fanned concerns that generative AI models are improving at a slower pace than expected. Each new AI model—ChatGPT-4, ChatGPT-5—costs significantly more than the last to train and release to the world, often three to five times the cost of the previous, say AI executives. That means the payback has to be even higher to justify the spending.
Another hurdle: The chips in the data centers won’t be useful forever. Unlike the dot-com boom’s fiber cables, the latest AI chips rapidly depreciate in value as technology improves, much like an older model car. And they are extremely expensive.
“This is bigger than all the other tech bubbles put together,” said Roger McNamee, co-founder of tech investor Silver Lake Partners, who has been critical of some tech giants. “This industry can be as successful as the most successful tech products ever introduced and still not justify the current levels of investment.”
Other challenges include the growing strain on global supply chains, especially for chips, power and infrastructure. As for economy-wide gains in productivity, few of the biggest listed U.S. companies are able to describe how AI was changing their businesses for the better. Equally striking is the minimal euphoria some Big Tech companies display in their regulatory filings. Meta’s 10k form last year reads: “[T]here can be no assurance that the usage of AI will enhance our products or services or be beneficial to our business, including our efficiency or profitability.” That is very shaky basis on which to conduct a $300bn capex splurge.
………………………………………………………………………………………………………………………………………………………………………………………………………………………………………………
Conclusions:
Big tech spending on AI infrastructure has been propping up the U.S. economy, with some projections indicating it could fuel nearly half of the 2025 GDP growth. However, this contribution primarily stems from capital expenditures, and the long-term economic impact is still being debated. George Saravelos of Deutsche Bank notes that economic growth is not coming from AI itself but from building the data centers to generate AI capacity.
Once those AI factories have been built, with needed power supplies and cooling, will the productivity gains from AI finally be realized? How globally disseminated will those benefits be? Finally, what will be the return on investment (ROI) for the big spending AI companies like the hyperscalers, OpenAI and other AI players?
………………………………………………………………………………………………………………………………………………………………………………………………………………………………………………
References:
https://www.wsj.com/tech/ai/ai-bubble-building-spree-55ee6128
https://www.ft.com/content/6c181cb1-0cbb-4668-9854-5a29debb05b1
https://www.cnbc.com/2025/09/26/openai-big-week-ai-arms-race.html
Gartner: AI spending >$2 trillion in 2026 driven by hyperscalers data center investments
AI Data Center Boom Carries Huge Default and Demand Risks
AI spending is surging; companies accelerate AI adoption, but job cuts loom large
Will billions of dollars big tech is spending on Gen AI data centers produce a decent ROI?
Canalys & Gartner: AI investments drive growth in cloud infrastructure spending
AI wave stimulates big tech spending and strong profits, but for how long?
AI Echo Chamber: “Upstream AI” companies huge spending fuels profit growth for “Downstream AI” firms
OpenAI partners with G42 to build giant data center for Stargate UAE project
Big Tech and VCs invest hundreds of billions in AI while salaries of AI experts reach the stratosphere
Superclusters of Nvidia GPU/AI chips combined with end-to-end network platforms to create next generation data centers
Analysis: Cisco, HPE/Juniper, and Nvidia network equipment for AI data centers
Networking chips and modules for AI data centers: Infiniband, Ultra Ethernet, Optical Connections
OpenAI and Broadcom in $10B deal to make custom AI chips
Lumen Technologies to connect Prometheus Hyperscale’s energy efficient AI data centers
Proposed solutions to high energy consumption of Generative AI LLMs: optimized hardware, new algorithms, green data centers
Liquid Dreams: The Rise of Immersion Cooling and Underwater Data Centers
Lumen: “We’re Building the Backbone for the AI Economy” – NaaS platform to be available to more customers
Initiatives and Analysis: Nokia focuses on data centers as its top growth market
Telco spending on RAN infrastructure continues to decline as does mobile traffic growth
Telco spending on radio access network (RAN) infrastructure, which is the largest share of capex, has dropped sharply in the last couple of years. It fell 11% in 2023, to about $40 billion, according to Informa owned market research firm Omdia (see References below for Dell’Oro’s numbers).
For 2024, Omdia predicts another decline of between 7% and 9%. Instead of buying new equipment, telcos have used existing supplies in their where houses.
Traffic growth rates also appear to have slowed. The graphic used in Ericsson’s latest mobility report pictures this very clearly, showing a church steeple of a traffic spike in 2019 and 2020 before a shallower downward-sloping gradient to the first half of 2024. That’s shown in this chart:
.jpg?width=700&auto=webp&quality=80&disable=upscale)
Source: Ericsson
Ericsson’s latest numbers, available through its mobility visualizer tool, shows the monthly volume of global mobile data rose by just 4.34% in the second quarter of 2024, compared with the first quarter. This is much lower than the rate of 10.76% Ericsson observed in the corresponding quarter four years earlier. The actual increase in 2024 was 6.27 exabytes. In 2020, it was 4.86 exabytes.
RAN product revenues have been falling at their sharpest rate in many years despite the 6.27-exabyte increase in monthly data volumes that happened in the second quarter. There are no signs that current 4G and 5G networks are about to keel over beneath an avalanche of data. It remains to be seen whether mobile networks are sufficiently robust to cope with many more exabytes of mobile data traffic or if telcos care about any service problems caused by congestion due to increased traffic.
There is also no obvious correlation between traffic growth and expenditure, according to Coleago Consulting. Spain’s Telefónica supported 17,054 petabytes of data on its global networks in 2015, its annual reports show. By 2023, the amount had rocketed to 146,074. Yet its capital intensity has fallen from more than 17% to just 14% over this period. Energy use, a proxy for operating costs, is also down, dropping from about 6,578 gigawatt hours in 2015 to 6,012 last year. Despite all that data consumption by its customers, Elisa’s capital intensity last year was less than 15%.
In Germany, the average monthly data usage per mobile customer (rather than per capita) amounted to 7.4 Gbytes and this may have risen to around 8 Gbytes in 1H 2024. In 2024, mobile data consumption in Finland was around 10 times higher compared to Germany. In Finland mobile operators have implemented 5G-SA and sell a user experience in terms of speed (Mbits/s) as opposed to data volume (Gbytes). As of October 2024, Elisa Finland offered a speed of 300 Mbits/s with unlimited data volume for €34.99. By contrast, in Germany, Telekom’s offer for 20 Gbytes is priced at €39.95 per month. For unlimited data usage Telekom charges €84.95, which is 2.5 times more costly than Elisa’s unlimited offer. It is unreasonable to assume that there is no price elasticity of demand. Surely, if prices in Germany were like those in Finland, monthly mobile data usage per customer would be much higher.
Monthly average revenue per user (ARPU) for a postpaid customer of Deutsche Telekom, Germany’s biggest telco, has fallen from €22 (US$23.7) before the launch of 5G to about €20 ($21.6) for the most recent quarter. Clearly, cost realities are especially awkward for Europe’s telcos, which have refused to give up their “fair share” argument that big content companies should pay for network usage because of all the traffic they supposedly generate. Critics disagree, saying that the telco’s own customers are the traffic generators, and they have already paid for it, even if pricing schemes do not help telcos to grow their sales.
………………………………………………………………………………………………………………………………………………………………………………………………………………………………..
References:
https://www.lightreading.com/5g/data-traffic-growth-or-decline-there-s-no-upside-for-telecom
https://www.coleago.com/insights/the-end-of-telecoms-history-not-really/
Analysys Mason & Light Reading: cellular data traffic growth rates are decreasing
Dell’Oro: Global RAN Market to Drop 21% between 2021 and 2029
Dell’Oro: RAN market still declining with Huawei, Ericsson, Nokia, ZTE and Samsung top vendors
Dell’Oro & Omdia: Global RAN market declined in 2023 and again in 2024
Dell’Oro: RAN market declines at very fast pace while Mobile Core Network returns to growth in Q2-2023
China’s mobile data consumption slumps; Apple’s market share shrinks-no longer among top 5 vendors
Analysts: Telco CAPEX crash looks to continue: mobile core network, RAN, and optical all expected to decline
Ookla: T-Mobile and Verizon lead in U.S. 5G FWA
China Mobile & China Unicom increase revenues and profits in 2023, but will slash CAPEX in 2024
China Mobile increased revenue 7.7% to 1.009 trillion Chinese yuan (US$140 billion) in 2023, with earnings up 3.7%. China Mobile’s biggest growth drivers were cloud computing and storage, which grew 66% to RMB83 billion ($11.5 billion), and 5G enterprise, which hiked sales by 30% to RMB47.5 billion ($6.6 billion). It also revealed it had earned RMB5.4 billion ($750 million) in 5G private networking revenue, up 113%. Its “new business” segment, which covers international, investments and applications, expanded 28% to RMB49.3 billion ($6.9 billion).
China Mobile’s capital spending was RMB180.3 billion ($25 billion), a 2.6% decrease from 2022. It gave no guidance for 2024, but CAPEX will surely decrease in 2024 and coming years due to a recent change to retain existing 5G network equipment longer than previously planned.
China Mobile’s Board on Thursday voted to extend the depreciable life of its 5G assets from seven years to ten years, based on the belief that much of its 5G network equipment will continue to be deployed after the arrival of 6G (IMT 2030) at the end of this decade (or later). The state owned telco said it expects “that 5G network investments shall be reused in 6G network infrastructure to the maximum extent, and therefore it is expected that 5G/6G networks will coexist after commercialization of 6G and 5G equipment will have a relatively long life cycle.”
The immediate effect of this decision will be to cut a massive 18 billion yuan ($2.5 billion) out of China Mobile’s depreciation bill this year. It’s the first time any major telco has formally declared that not only is it reluctant to spend on new 6G equipment, but that it also intends to keep its 5G assets as long as possible. That sends a clear warning that in the aftermath of the 5G capex binge, telcos have little appetite for big technology bets without a clear ROI.
…………………………………………………………………………………………………………………..
Meanwhile, China Unicom boosted net profit by 11.8% and topline revenue by 5.0%. Unicom said it had grown its cloud business by 42% to RMB51 billion ($7.1 billion), while its new computing and digital services business recorded RMB75 billion ($10.4 billion) in sales, up 13%.
“With 5G network coverage nearing completion, the Company’s investment focus is shifting from stable Connectivity and Communications (CC) business to high-growth Computing and Digital Smart Applications (CDSA) business. CAPEX was RMB73.9 billion in 2023. Network investment saw an inflection point.”
In 2023, Connectivity and Communications (CC) business, which encompasses mobile connectivity, broadband connectivity, TV connectivity, leased line connectivity, communications services as well as information services, achieved revenue of RMB244.6 billion. It contributed to three quarters of the service revenue of CC and CDSA combined. The Company’s connectivity scale further expanded, with the total number of CC subscribers exceeding one billion, representing an increase of about 140 million from the end of 2022.
China Unicom capital spending was flat at RMB73.9 billion ($10.3 billion), and it revealed it will slash CAPEX this year by RMB8.9 billion ($1.2 billion) or 12%.

References:
https://www.lightreading.com/5g/china-mobile-unicom-raise-red-flags-on-network-spend
https://www1.hkexnews.hk/listedco/listconews/sehk/2024/0321/2024032100246.pdf
https://www1.hkexnews.hk/listedco/listconews/sehk/2024/0319/2024031900241.pdf
MIIT: China’s Big 3 telcos add 24.82M 5G “package subscribers” in December 2023
China Mobile verifies optimized 5G algorithm based on universal quantum computer
Omdia: China Mobile tops 2023 digital strategy benchmark as telcos develop new services
China Unicom & Huawei deploy 2.1 GHz 8T8R 5G network for high-speed railway in China
IHS Markit: Telecom Revenue +1.1%; CAPEX -1.8% in 2017
Despite unabated exponential growth in network usage, global telecom revenue is on track to grow just 1.1 percent in 2017 over the prior year, according to a new report [1] by business information provider IHS Markit.
Global economic growth prospects, meanwhile, are looking up. IHS Markit macroeconomic indicators point to moderate global economic growth of 3.2 percent for 2017, up from 2.5 percent in 2016, and world real gross domestic product (GDP) is projected to increase 3.2 percent in 2018 and 3.1 percent in 2019.
“Although the telecom sector has been resilient, revenue growth in developed and developing economies has slowed dramatically due to saturation and fierce competition,” said Stéphane Téral, executive director of research and analysis and advisor at IHS Markit. “At this point, every region is showing revenue growth in the low single digits when not declining, and there is no direct positive correlation between slow economic expansion and anemic telecom revenue growth or decline as seen year after year in Europe, for instance.”
China alone is tamping down global telecom capex in 2017:
IHS Markit forecasts a 1.8 percent year-over-year decline in global telecom capital expenditures (capex) in 2017, mainly a result of a 13 percent year-over-year falloff in Chinese telecom capex. Asia Pacific outspends every other region in the world on telecom equipment.
“Call it precision investment, strategically focused investment or tactical investment, but all three of China’s service providers — China Mobile, China Unicom and China Telecom — scaled back their 2017 spending plans, and the end result is another double-digit drop in China’s telecom capex bucket, with mobile infrastructure hit the hardest,” Téral said. “Bringing down capital intensity to reasonable levels of 15 to 20 percent is the chief goal of these operators.”
The virtualization trend:
A transformation is underway in service provider networks, epitomized by software-defined networking (SDN) and network functions virtualization (NFV), which involve the automation of processes such as customer interaction, as well as the addition of more telemetry and analytics with feedback loops into network operations, operations and business support systems, and service assurance.
“Many service providers have deployed new architectural options — including content delivery networks, distributed broadband network gateways, distributed mini data centers in smart central offices, and video optimization,” said Michael Howard, executive director of research and analysis for carrier networks at IHS Markit. “Nearly all operators are madly learning how to use SDN and NFV, and the growing deployments today bring us to declare 2017 as The Year of SDN and NFV.”
Data is the new oil, and AI is the engine:
Big data is becoming more manageable, and operators are leveraging subscriber and network intelligence to support the automation and optimization of their networks using SDN, NFV and initial forays into using analytics, including artificial intelligence (AI) and machine learning (ML).
“Forward-thinking operators are experimenting with how to use anonymized subscriber data and analytics to create targeted services and broker this information to third parties such as retailers and internet content providers like Google,” Téral said. “No matter their size, market or current level of digitization, service providers need to rethink their roles in the new age of information and reset the strategies needed to capitalize on this opportunity.”
……………………………………………………………………………………………….
Note 1. The Telecom Trends & Drivers Market Report is published twice annually by IHS-Markit to provide analysis of global and regional market trends and conditions affecting service providers, subscribers, and the global economy. These roughly 40- page reports assess the state of the telecom industry, telling the story of what’s going on now and what we expect in the near and long term, illustrated with charts, graphs, tables, and written analysis. These critical analysis reports are a foundation piece for all market forecasts.
The reports include top takeaways on the economic health of the global telecom/datacom space; regional and global trends, drivers, and analysis for the service provider network sector in the context of the overall economy; financial analysis of the world’s top 10 service providers (revenue growth, capital intensities, free cash flow, debt level); regional enterprise and carrier spending trends; top-level service provider and subscriber forecasts; macroeconomic drivers; and key economic statistics (e.g., unemployment, OECD indicators, GDP growth). The reports are informed by all of IHS Technology research, from market share and forecasts to surveys with telecom service providers and small, medium, and large businesses.
……………………………………………………………………………………………………………….
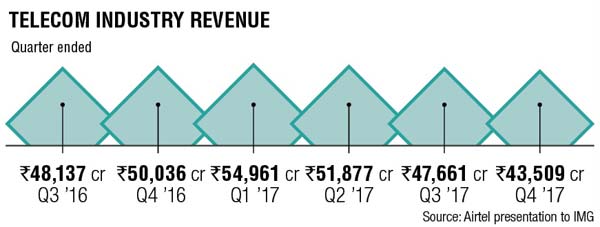
The chart below from Bharti Airtel (India’s largest telecom company) shows that telecom industry revenue has declined in 2017 Q2, Q3, and Q4 with only Q1 showing positive growth.
…………………………………………………………………………………………………………………..
Optical Network Equipment Vendors:
In a service provider survey report on Optical Networking and equipment vendors, IHS-Markit found Ciena, Huawei and Nokia as the three most popular optical networking equipment vendors. The report also highlighted Data Center Interconnection (DCI) is a huge growth opportunity.
IHS-Markit predicts DCI will be a significant driver for the optical equipment market, surging from 19 percent of overall equipment sales at mid-2017 to nearly 30 percent by 2021.
Ciena was deemed the top DCI vendor by 39 percent of those surveyed by IHS-Markit. Cisco, Coriant, and Infinera each garnered 36 percent of the votes.Last year Ciena reportedly won a DCI deal from rival ADVA Optical, which had a negative impact on ADVA’s operational results.
Ciena also topped the list of top (optical) transport software-defined networking (SDN) vendors, with 46 percent of those surveyed citing the company as a leader in the segment. Adams noted that while this market was still in its early days, Ciena’s continued integration of its Blue Planet software platform with its optical equipment products was driving differentiation in the market.
Cisco attracted the second most votes in terms of transport SDN leadership, followed by Nokia and Infinera.
LightCounting’s 3Q 2017 Optical Market Update + China’s Optical Network Comeback?
I. Light Counting’s 3Q2017 Market Update:
In its newly released “December 2017 Quarterly Market Update” LightCounting LLC states that demand for optical communications technology in 3Q 2017 followed what has been a year-long trend: Telecom/network service provider spending declined year-on-year while data center operators increased their investments in fiber optic infrastructure.
The decline in telecom optical network spending hit the optical components segment hardest, but was negative for vendors selling to telcos which can be seen from the chart below:

In 3Q 2017, data center use of optical communications technology was considerably more than that of telecom/network service providers.
Source: LightCounting LLC
…………………………………………………………………………………………………………..
Chinese carriers (see companion piece below) followed through on their announced plans to trim spending. LightCounting reports that China Telecom will continue to cut capex in 2018. Elsewhere in the world, only Orange looks like it will spend more this year than last among LightCounting’s list of top 15 telecom service providers.
Upticks in 100G DWDM transponders and WSS module sales paled in comparison to the declines experienced in the FTTx and wireless front haul markets, both sequentially and annually (see “Demand for FTTx, wireless optics declines from 2016: LightCounting”).
LightCounting says that check-ins with semiconductor vendors such as Analog Devices, Qualcomm, and Xilinx revealed increased activity in wireless/cellular communications, including 4.5G and 5G projects. This information leads the market research firm to expect initial commercial deployments of next generation wireless technologies in 2018, which in turn should boost the demand for optical front haul technology.
Optical vendors with exposure to the data center and internet content provider markets fared better than long haul/DWDM vendors. For example, Alibaba, Facebook, and Google increased their infrastructure spends by 142%, 62% and 39%, respectively, leading to overall spending records in the space during the quarter. Facebook plans to double capex in 2018, leading to hopes that data center optical spending growth is sustainable.
Optical transceiver vendors benefited during the quarter, which Applied Optoelectronics seeing a 27% increase in revenues and Innolight a 94% boom versus 3Q16. Shipments of PSM4 and CWDM4 100GbE modules set records during the quarter. However, 100GBASE-LR4 QSFP28 optical transceiver demand in the third quarter of 2017 proved softer than LightCounting expected.
…………………………………………………………………………………………………………….
LightCounting LLC says:
Our analysis is based on confidential sales data provided by leading suppliers and offers a unique port-based view of the industry.
References:
https://www.lightcounting.com/News_121317.cfm
https://www.futuremarketinsights.com/reports/optical-networking-market
…………………………………………………………………………………..
II. China’s Optical Market Comeback (via Barron’s on-line), by Tiernan Ray
China’s optical fiber market is coming back, but slowly, according to a note this morning from Rosenblatt Securities analyst Jun Zhang, who follows shares of laser vendor Oclaro, Acacia Communications, Applied Optoelectronics, and other vendors.
“Demand in China is stabilizing and slightly improving,” writes Zhang, “but we do not see a broad acceleration in China’s recovery yet.
“Chinese vendors recently concluded 2018 component and module procure- ments. Therefore, optical module and component suppliers should have base- line procurement contracts from Chinese vendors for 2018.”
The tricky part, indicates Zhang, is that Chinese buyers of components are increasingly coming up with their own internal components, which is going to dent some of the demand:
Instead of over promising volume to suppliers, we believe Chinese vendors offered baseline procurement volume estimates for 2018. Additionally, we believe these current procurement forecasts do not include any upside from initial 5G deployments in 2H18. However, line and client side module procurements from Chinese vendors are all down YoY due to internal sourcing. Therefore, due to conservative forecasts and increasing competition in the module market, most optical suppliers will likely continue to speak conservatively on China demand.
Zhang goes through what to expect, and it’s quite a mixed bag for various different vendors:
As we expected, ZTE is attempting to increase its internal sourcing for line side CFP2 DCO modules in 2018. Therefore, Acacia’s business could be negatively impacted in 2018 by ZTE. On the other hand, we believe there’s a chance Acacia can qualify at Huawei for DSP in 2018, but we see no signs yet. Intel’s CWDM4 has been qualified at Facebook and could have a sizeable market share, similar to the share size we expect InnoLight to also have at Facebook in 2018. However, Applied Optoelectronics shares are down significantly at Facebook in 2018 likely putting its CQ4 guidance at risk […]
NeoPhotonics could be up YoY, Lumentum flat YoY, Oclaro down slightly YoY, and Acacia down YoY. We also estimate Huawei and ZTE’s 100G ports to grow to 150K and 35K from 130K and 45K, respectively, in 2018. FiberHome recently saw a large share gain at China Unicom and we expect it to double its 100G port shipments in 2018 from a small basis.
