

Dell’Oro Group
Telecom Equipment Market Extends Recovery as AI Infrastructure Spending Accelerates
Executive Summary:
Global telecom equipment revenues have been in a state of steady decline until last year. While there was an increase in spending for 5G FWA & 5G SA core networks, the main revenue driver was strong growth in fiber-optic-based network gear needed for connectivity inside and between AI data centers.
Market research firm Dell’Oro Group has just published findings that analyze how that trend has extended into the first half of this year. To no one’s surprise, AI data center connectivity now accounts for nearly all telco equipment revenue growth.
Preliminary Dell’Oro Group estimates indicate that aggregate global revenues across six tracked equipment domains—Broadband Access, Microwave Transport, Optical Transport, Mobile Core Network (MCN), Radio Access Network (RAN), and High-End Routing and Aggregation—increased 5% year over year (YoY) in 1H2026. The result represents a sixth consecutive quarter of year-over-year expansion.
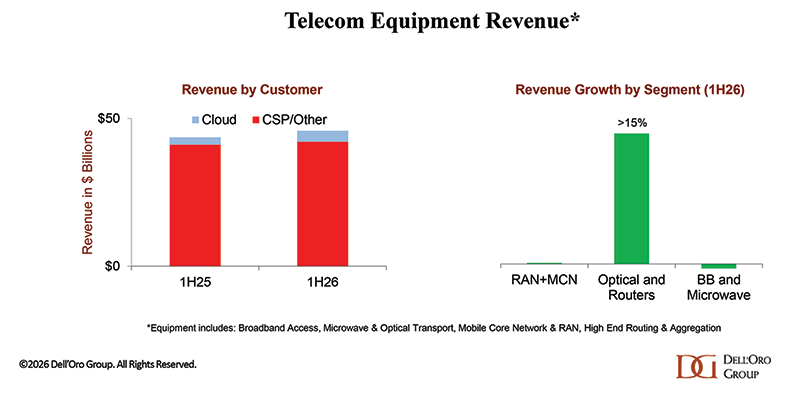
The 1H2026 performance follows a 4% telecom equipment spending increase in 2025, when the industry returned to growth after aggregate revenues declined 14% between 2022 and 2024. The 2025 rebound was supported by inventory normalization, easier year-over-year comparisons, improving wireless and wireline demand, and rising cloud capital expenditure. In 1H2026, however, the growth mix shifted more decisively toward equipment categories linked to AI infrastructure and hyperscale data-center connectivity.
Cloud investment reshapes demand:
Traditional communications service providers (CSPs) still generate more than 90% of worldwide telecom equipment revenue. However, cloud providers are now an increasingly consequential source of incremental demand. Dell’Oro Group estimates that cloud providers accounted for approximately 55% of total equipment-market revenue growth in 1H26, driven by sustained investment in AI compute infrastructure, data-center expansion, and the high-capacity transport and routing layers required to interconnect those facilities.
This does not signal a wholesale replacement of telecom operator demand by hyperscaler spending. Rather, it illustrates how the equipment market’s near-term growth profile is being reshaped by the convergence of telecom networking, cloud architecture, and AI infrastructure. The technologies benefiting most are those closest to data-center interconnect, backbone capacity expansion, and high-performance IP networking.
Optical and routing lead growth:
Growth was concentrated in Optical Transport and High-End Routing and Aggregation—the two segments with the most direct exposure to cloud and data-center investment cycles.
Optical Transport revenue increased at a double-digit rate in 1H26, supported by demand for data-center interconnect capacity and the expansion of high-bandwidth optical infrastructure. High-End Routing and Aggregation also recorded strong gains, reflecting robust spending from both cloud providers and CSPs.
By comparison, more traditional telecom infrastructure categories remained comparatively stable:
-
Aggregate RAN and MCN revenue was broadly flat.
-
Broadband Access revenue was relatively unchanged.
-
Microwave Transport revenue also showed limited growth.
The divergence underscores an important market distinction: AI-related infrastructure spending is currently lifting transport, optical, and routing investment more directly than it is stimulating broad-based growth in mobile access or core-network equipment.
Regional and supplier trends:
Regional conditions were favorable outside China. North America, EMEA, the Caribbean and Latin America (CALA), and Asia-Pacific excluding China all contributed to the 1H26 market expansion. North America continued to benefit disproportionately from AI- and cloud-driven infrastructure investment, including demand for optical transport, routing, and fiber-access platforms.
China remained the principal weak point. Telecom infrastructure investment is increasingly being displaced by compute-oriented capital expenditure. China’s three largest CSPs are collectively targeting 40% growth in computing capex during 2026, while conventional connectivity capex is expected to decline by 24%. That reallocation reinforces the broader shift from traditional network buildouts toward AI infrastructure, although the equipment beneficiaries differ substantially by technology segment.
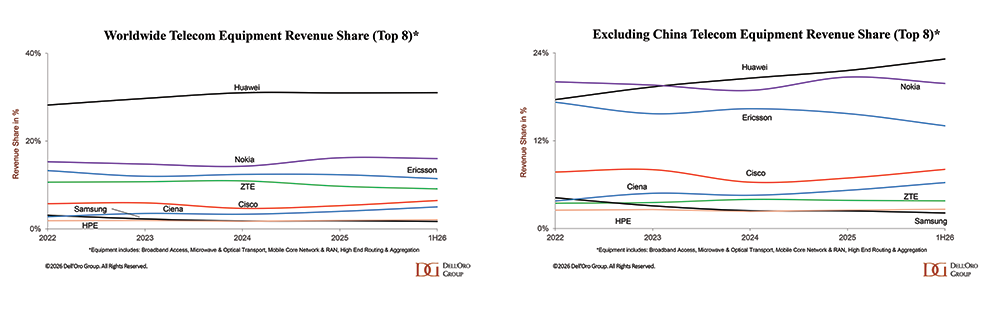
Global supplier rankings remained broadly stable during the first half of the year. Huawei retained its position as the largest worldwide telecom equipment supplier, followed by Nokia and Ericsson. Outside China, however, market-share shifts were more pronounced:
-
Huawei and Cisco gained share in 1H26 relative to 2025.
-
Ericsson and Nokia together lost roughly three percentage points of revenue share.
-
The changes partly reflect differing exposure to the faster-growing optical and routing segments, as well as regional demand patterns.
Revised Outlook:
Dell’Oro Group’s analyst team has raised its 2026 outlook for the six tracked equipment markets. Worldwide revenue is now projected to grow 3% to 5% for the full year, compared with a previous forecast of 2% to 4%.
The risk profile has also changed. China is tracking below earlier full-year expectations, while rising memory and component costs have become more significant second-half concerns. Those headwinds are being offset, at least in part, by continued strength in cloud and AI infrastructure investment.
Telecom equipment demand has stabilized and entered a renewed growth phase, supported by sustained hyperscale investment in AI compute, optical interconnect, and high-end routing. The key question for 2026 is whether this momentum broadens into a more balanced, network-wide recovery—particularly across RAN, core, and access segments, which have not yet participated materially in the expansion.
The central market question is whether sustained hyperscale investment in AI compute, optical interconnect, and high-end routing can broaden into a more durable, network-wide equipment recovery.
……………………………………………………………………………………………………………………………………………………………….
References:
Cloud Providers Drive Telecom Equipment Growth in 1H26 – Dell’Oro Group
Dell’Oro: Data Center capex grew 92% in 2Q-2026 (caveats galore)
Dell’Oro: AI RAN revenue forecast: $35B from 2026-to-2030; 3 types of AI RAN explained
Dell’Oro: Telecom carriers are on a 5G SA spending spree with more to come
Dell’Oro: Global RAN market stable (again) in 1Q 2026; top 5 RAN vendors are unchanged
Dell’Oro: RAN Market Stabilized in 2025 with 1% CAG forecast over next 5 years; Opinion on AI RAN, 5G Advanced, 6G RAN/Core risks
Dell’Oro: RAN market stable, Mobile Core Network market +14% Y/Y with 72 5G SA core networks deployed
Dell’Oro Group: RAN Market Grows Outside of China in 2Q 2025
Dell’Oro: Fixed Wireless Access revenues +10% in 2025 & will continue to grow 10% annually through 2029
Dell’Oro: AI RAN to account for 1/3 of RAN market by 2029; AI RAN Alliance membership increases but few telcos have joined
Dell’Oro: Data Center capex grew 92% in 2Q-2026 (caveats galore)
According to a new report by Dell’Oro Group, the global data center capital expenditures strongly accelerated in 2Q 2026. Continued AI infrastructure investment supported growth across compute, storage, networking, and physical infrastructure, while rising memory and storage prices significantly increased server average selling prices.
“Data center capex growth broadened in the second quarter as investment accelerated across both established Cloud Service Providers and emerging AI infrastructure customers,” said Baron Fung, Vice President of Research at Dell’Oro Group.
“Spending remained concentrated in NVIDIA Blackwell Ultra and hyperscaler custom accelerators, while agentic AI created incremental demand for general-purpose compute, storage, and complementary networking. Neocloud providers and AI model builders are also becoming increasingly important contributors to infrastructure investment. These companies are rapidly expanding their own capacity while deepening partnerships with cloud service providers.”
“Looking ahead, ongoing accelerator deployments and emerging agentic AI and AI-related storage workloads should sustain strong capex growth through the remainder of 2026 and beyond, although supply constraints could limit the pace at which planned infrastructure is deployed,” explained Fung.
Additional highlights from the 2Q 2026 Data Center IT Capex Quarterly Report:
- Neocloud and AI Model Builder capex grew the fastest among the customer segments, reflecting the early stages of their infrastructure buildouts.
- Higher memory and storage prices provided an additional lift to capex by driving server average selling prices higher.
- Dell led server OEM revenue, followed by SuperMicro and Lenovo, while white-box server revenue reached a record high.
………………………………………………………………………………………………………………………………………………………….
On August 18th Dell’Oro Group forecasted that worldwide data center capital capex is to maintain growth momentum and surpass $3 trillion by 2030. High-end accelerators powering accelerated servers optimized for AI are expected to represent the largest share of data center capex and remain the primary driver of capex growth over the forecast period.
“Our 2030 data center capex outlook has nearly doubled since the January 2026 forecast, reflecting higher hyperscale capex guidance, increased projections for global data center power capacity, and higher commodity costs,” said Baron Fung, Vice President of Research at Dell’Oro Group. “High-end accelerators powering AI-optimized servers are expected to account for the largest share of data center capex and remain the primary driver of growth over the forecast period.
“However, the pace of growth will depend on the sustainability of investment, power availability, and supply chain conditions. Accelerated and heterogeneous computing, along with innovations in server efficiency, could help mitigate the rising cost and infrastructure demands of AI. The Top 4 US hyperscalers alone could represent about half of global capex, while enterprise investment remains constrained by uncertain AI returns,” according to Fung.
Additional highlights from the Data Center IT Capex 5-Year July 2026 Forecast Report:
- High-end accelerators are expected to account for the largest share of data center capex and remain the primary driver of spending growth through 2030.
- General-purpose server demand is expected to benefit from growing inference, agentic AI, and storage workloads, broadening infrastructure growth beyond accelerated computing.
- The newly added AI-specialized cloud segment, comprising AI model builders and neocloud service providers, is projected to grow at nearly a 60 percent CAGR, outpacing the growth of other customer segments.
Additional highlights from the Data Center IT Capex 5-Year July 2026 Forecast Report:
- High-end accelerators are expected to account for the largest share of data center capex and remain the primary driver of spending growth through 2030.
- General-purpose server demand is expected to benefit from growing inference, agentic AI, and storage workloads, broadening infrastructure growth beyond accelerated computing.
- The newly added AI-specialized cloud segment, comprising AI model builders and neocloud service providers, is projected to grow at nearly a 60 percent CAGR, outpacing the growth of other customer segments.
IEEE Techblog Analysis:
- Dell’Oro had already raised its 2026 global data-center capex outlook to more than $1 trillion in its June 2026 report. It also said 2H26 growth was expected to accelerate because of NVIDIA Rubin deployments and hyperscaler custom-accelerator refreshes. That makes the new 92% 2Q figure much more significant: this isn’t simply a strong quarter; it is occurring within a $1-trillion-plus annual investment cycle.
- Epoch AI’s tracking shows combined hyperscaler quarterly capex has been increasing at an average 72% annual rate since 2Q23 and projects approximately $770 billion for 2026 if the trend continues.
- Another estimate from Moody’s put 2026 hyperscaler capex at $785 billion, including Microsoft, Amazon, Meta, Alphabet, Oracle and CoreWeave.
- Dell’Oro’s separate 2Q semiconductor/component report says data-center component revenue increased 182% YoY, while DRAM and storage-drive average selling prices per bit more than doubled. Therefore, some of the 92% increase in data-center capex is clearly inflation in the cost of the equipment, not necessarily an equivalent increase in physical infrastructure.
- Therefore, the 92% increase in capex should not be interpreted as a 92% increase in deployed computing capacity, because sharply higher DRAM, NAND/storage and other component prices are inflating server system costs.
What’s Missing from this Report:
The press release for this report notes that worldwide data center capital expenditures grew 92% in 2Q02026, driven by surging AI demand and memory costs. However, it omits precise spending figures for individual hyperscalers (Alphabet, Amazon, Meta, Microsoft and Oracle) as well as OEM market share details. Moreover, YoY growth can conceal the current trajectory. Sequential growth would show whether the AI infrastructure spending acceleration actually intensified during 2Q of 2026.
Conclusions:
The 92% year-over-year increase in 2Q26 data-center capex needs to be viewed against a much larger AI infrastructure investment cycle. Dell’Oro had already raised its 2026 global data-center capex forecast to more than $1 trillion, with 2H26 spending expected to accelerate further as NVIDIA’s Rubin systems and hyperscaler custom accelerators ramp. At the same time, Dell’Oro reported that data-center semiconductor and component revenue surged 182% in 2Q26, with DRAM and storage-drive prices per bit more than doubling year over year. Consequently, a significant portion of the reported capex growth reflects higher equipment prices rather than a comparable increase in physical computing capacity. Meanwhile, hyperscaler capex is increasingly being supplemented by debt-financed Neocloud and AI-model-builder infrastructure, broadening the investment cycle beyond the traditional cloud giants.
Dell’Oro Group’s Data Center IT Capex Quarterly Report details the data center infrastructure capital expenditures of the largest hyperscale cloud service providers, AI Model Builders, Neocloud, Rest of Cloud, Telco, and Enterprise customer segments. It provides the allocation of data center infrastructure capex for general-purpose and accelerated servers, storage systems, and other auxiliary data center equipment. The report also discusses market trends, drivers of the leading cloud service providers’ capex growth during the quarter, and the outlook for the next year. To purchase this report, please contact us at [email protected].

…………………………………………………………………………………………………………………………………………………………………………………..
References:
Dell’Oro: 2H2026 Data Center Capex to Accelerate due to massive AI Deployments
PwC: Global AI data center spending to hit $31.6tn by 2050; Role of full stack orchestration layer explained
Nvidia CEO Huang: AI is the largest infrastructure buildout in human history; AI Data Center CAPEX will generate new revenue streams for operators
China vs U.S.: Race to Generate Power for AI Data Centers as Electricity Demand Soars
AI risks and backlash increase; Recap of the circular loop of fake AI profits and hyperscaler markups of private AI companies
Big tech spending on AI data centers and infrastructure vs the fiber optic buildout during the dot-com boom (& bust)
Analysis: Cisco, HPE/Juniper, and Nvidia network equipment for AI data centers
Networking chips and modules for AI data centers: Infiniband, Ultra Ethernet, Optical Connections
Expose: AI is more than a bubble; it’s a data center debt bomb
Will billions of dollars big tech is spending on Gen AI data centers produce a decent ROI?
Huge Risks for the proposed $500B AI Investments from Giant Wall Street firms
Dell’Oro: Telecom carriers are on a 5G SA spending spree with more to come
Dell’Oro Group, says that telecom wireless carriers have spent 208% more on 5G Standalone (SA) than they had on 4G Core functions at the same point in the technology’s lifecycle. However, 5G Mobile Core Network revenue growth is expected to slow over the next two years, as carriers put off transformation projects due to elevated server costs.
“The way the 3GPP specifications unfolded created an offset between 5G RAN spending and the implementation of 5G SA,” said Siân Morgan, Senior Director at Dell’Oro Group. “However, the complexity of the 5G SA is driving cumulative vendor revenues much higher than they were at the same stage in the LTE Evolved Packet Core (EPC) lifecycle.
“5G SA revenues have not yet peaked,” Morgan added. “The majority of mobile network operators haven’t made 5G SA services available to a broad base of their customers. Some operators are delaying core transformation projects because memory shortages are driving up server prices, but we expect double-digit 5G Mobile Core Network revenue growth to resume in 2028.”
Additional highlights from Mobile Core Network and Multi-access Edge Computing 5-Year Forecast July 2026 Report include:
- EMEA (Europe, Middle East and Africa) will drive the most Mobile Core Network revenue over the next five years.
- Despite being superseded by 5G, 4G core revenue grew in 2025, and Dell’Oro Group raised the forecast for this market.
- AI will have a variable impact on mobile core networks, with opportunities for efficiency and revenue generation, alongside a risk of escalating costs.

The Dell’Oro Group Mobile Core Network & Multi-Access Edge Computing Quarterly Report offers complete, in-depth coverage of the market with tables covering manufacturers’ revenue, shipments, and average selling prices for Traditional Packet Core, Evolved Packet Core, 5G Packet Core, Policy, Subscriber Data Management, Signaling, Circuit Switched Core, and IMS Core by geographic regions. To purchase this report, please contact us at [email protected].
……………………………………………………………………………………………………………………………………………………….
From Perplexity.ai and Ericsson:
Analysis:
5G SA differs from NSA because it uses a 5G core rather than relying on 4G core (EPC) anchoring, which makes it better suited for advanced capabilities like network slicing and more flexible service control. All 5G features and functions, e.g. 5G security, network slicing, MEC, etc require a 5G SA core network. 5G network operators can package differentiated services instead of treating 5G only as a faster broadband layer.
Adoption is already broadening geographically. Ericsson says more than 60 service providers had deployed or launched public 5G SA networks by the end of September 2024, with early leadership in North America, China, Southeast Asia, and Australia, and with deployments expanding into Latin America, the Gulf Cooperation Council, and South Africa.
Device readiness is also improving quickly. Ericsson notes that the share of announced 5G devices supporting SA was about 70 percent by the end of June 2024, which lowers one of the biggest historical blockers to mass adoption.
From a vendor and operator perspective, the value of SA is shifting from coverage to monetization. Dell’Oro says many operators already use SA for enterprise and fixed wireless access, even if they have not yet opened it broadly to consumers, which suggests the strongest initial revenues may come from business services before mass-market consumer plans.
Market Forecast:
The strongest public forecast in the sources is subscriber growth: Ericsson projects global 5G SA subscriptions will reach about 1.2 billion by the end of 2024 and approximately 3.6 billion by 2030, which would represent nearly 60 percent of all 5G subscriptions by that time.
On the infrastructure side, Dell’Oro expects the 5G mobile core network market to grow at a 6 percent CAGR from 2024 to 2029, largely driven by SA adoption, while MEC is forecast to grow faster at 17 percent CAGR because of network slicing, RedCap, and network APIs tied to Open Gateway.
A reasonable market view is that 2025–2027 will be the period when SA shifts from launch announcements to scale, especially as more operators convert consumer traffic, expand enterprise use cases, and retire older core dependencies. By the late 2020s, growth should be driven less by “first deployment” and more by monetization density: more SA subscribers, more eligible devices, and more services built on top of the SA core.ericsson+1
What to watch:
-
Consumer rollout pace. Operators that keep SA limited to enterprise and FWA will likely monetize more slowly than those that open it to consumers.
-
Device defaults. SA-enabled devices matter less if SA is not the default setting, so default-on support is an important adoption catalyst.
-
Enterprise use cases. Slicing, private wireless integration, and low-latency applications are likely to produce the clearest near-term ROI.
-
Regional timing. China and India are expected to remain major contributors, while Europe and parts of the Americas close the gap later in the decade.
References:
5G Standalone Revenue Triples 4G Core at Same Stage of Tech Cycle, According to Dell’Oro Group
GSA: 5G Non Terrestrial Networks, 5G SA and 5G Advanced gain momentum
Dell’Oro: Mobile Core Networks +15% in 2025; Ookla: Global Reality Check on 5G SA and 5G Advanced in 2026
Dell’Oro: RAN market stable, Mobile Core Network market +14% Y/Y with 72 5G SA core networks deployed
AT&T deploys nationwide 5G SA while Verizon lags and T-Mobile leads
Ericsson CEO’s strong statements on 5G SA, WRC 27, and AI in networks
Dell’Oro: AI RAN revenue forecast: $35B from 2026-to-2030; 3 types of AI RAN explained
According to a new AI RAN Advanced Research Report published by Dell’Oro Group, cumulative AI RAN revenue is projected to reach $35 B over the next five years (2026-2030). However, AI RAN is not expected to expand the overall RAN market.
“Our market assessment and long-term AI RAN position remain unchanged,” said Stefan Pongratz, Vice President at Dell’Oro Group. “AI RAN is already happening and will scale ahead of 6G. At the same time, these tools will enhance the RAN, but they are unlikely to expand the overall RAN market. Even as suppliers introduce new software-based subscription models, we expect AI RAN to generate little, if any, incremental RAN revenue the end of the forecast period,” continued Pongratz.
Additional highlights from the June 2026 AI RAN Advanced Research Report:
- The base-case forecast assumes that AI RAN will not expand the RAN market. Nevertheless, AI RAN is expected to become an important technology enabler as operators incorporate greater virtualization, intelligence, automation, and O-RAN capabilities into their RAN roadmaps.
- GPU RAN projections have been revised upward—GPU RAN is now expected to be a $1 B+ market by the end of the forecast period.
- In the near term, the AI RAN market will remain centered on AI-for-RAN, single-purpose deployments, non-GPU architectures, D-RAN, and 5G.
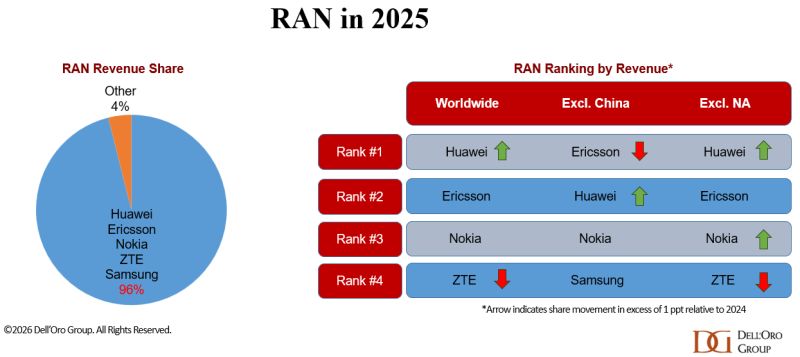
- Incumbent RAN radio and baseband suppliers are well-positioned in the initial AI RAN phase, driven primarily by AI-for-RAN upgrades leveraging existing hardware. Per Dell’Oro Group’s regular RAN coverage, the top five RAN suppliers contributed approximately 96 percent of 2025 RAN revenue. See charts below.
Dell’Oro Group’s AI RAN Advanced Research Report includes a 5-year forecast for AI RAN by location, tenancy, technology, and region. To purchase this report, please contact us at [email protected].
………………………………………………………………………………………………………………………………………………………………………….
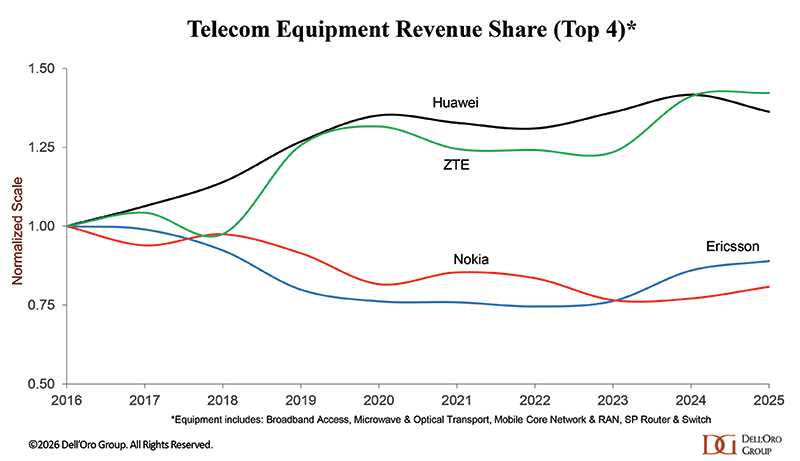
Total & Wireless Telecom Equipment Revenue- top 4 and top 3:

………………………………………………………………………………………………………………………………………………………………………………….
Analysis (Source: Perplexity.ai AND Google Gemini):
There are three versions of AI-RAN which are not mutually exclusive:
- AI for RAN: Embeds AI into the base software stack to automatically manage radio waves, optimize spectrum efficiency, enhance beamforming, and reduce energy consumption in real time. Nokia, Ericsson, NVIDIA.
- AI on RAN: Uses cell towers and base stations as decentralized computing nodes. This allows telecom networks to host AI workloads locally rather than sending all data to distant cloud servers, providing ultra-low latency for applications like robotics, AR/VR, and autonomous vehicles. Nokia, NVIDIA, and operator trial partners like T-Mobile, Indosat, and SoftBank.
- AI and RAN: Combines the two to support “Networks for AI,” where distributed telecom networks act as an active, intelligent backbone to serve end-user AI traffic. AI-RAN Alliance plus Nokia and NVIDIA as the most visible industry champions.
References:
AI RAN to Reach $35 B Over Next Five Years, According to Dell’Oro Group
NVIDIA AI RAN video: youtube.com/watch?v=hwLLBfzoSko&t=26
AI-Era Cloud Network Transformation: A Reference Architecture and Implementation Roadmap
Ericsson goes with custom silicon (rather than Nvidia GPUs) for AI RAN
Dell’Oro: RAN Market Stabilized in 2025 with 1% CAG forecast over next 5 years; Opinion on AI RAN, 5G Advanced, 6G RAN/Core risks
AI-RAN Reality Check: hype vs hesitation, shaky business case, no specific definition, no standards?
Analysis: Nvidia’s rumored new 6G AI-RAN – likely features/functions and industry impact
Dell’Oro: 2H2026 Data Center Capex to Accelerate due to massive AI Deployments
Dell’Oro: Analysis of the Nokia-NVIDIA-partnership on AI RAN
RAN silicon rethink – from purpose built products & ASICs to general purpose processors or GPUs for vRAN & AI RAN
Dell’Oro: AI RAN to account for 1/3 of RAN market by 2029; AI RAN Alliance membership increases but few telcos have joined
Dell’Oro: RAN revenue growth in 1Q2025; AI RAN is a conundrum
Dell’Oro: Global RAN market stable (again) in 1Q 2026; top 5 RAN vendors are unchanged
A recently published report from Dell’Oro Group indicates that the stable trends shaping the Radio Access Network (RAN) market in 2025 extended into the first quarter of 2026. Worldwide RAN revenue, excluding services, increased at a low-single-digit year-over-year rate in 1Q 2026, marking the fifth consecutive quarter where the market remained within a relatively narrow range (-4 to +4% year-over-year). However, market fundamentals remain constrained by slower mobile broadband growth.
“This positive start does not alter the fundamentals shaping the growth prospects of this market,” said Stefan Pongratz, Vice President for RAN market research at the Dell’Oro Group. “We attribute the improved conditions primarily to a favorable regional mix and easier comparisons in markets that experienced sharp declines. Meanwhile, RAN remains growth-constrained, and operators are increasingly preparing for a slower mobile broadband growth environment,” Pongratz added.
Additional highlights from the 1Q 2026 RAN report:
- Growth in EMEA and APAC offset weaker activity in North America.
- Revenue rankings were unchanged in 1Q 2026. Based on trailing four-quarter worldwide revenue, the top five RAN suppliers are Huawei, Ericsson, Nokia, ZTE, and Samsung [1.].
- Regional imbalances continue to shape the market recovery trajectory, with APAC excluding China improving while North America and China remain under pressure.
Note 1. There were no significant market share shifts quarter-to-quarter for these five vendors whose ranking remains the same. The ongoing war in Iran, with the Strait of Hormuz closed, has disrupted supply chains for specialized components, while higher energy prices are raising operational costs for infrastructure deployment, creating an increasingly complex environment for network equipment suppliers.

Dell’Oro Group’s RAN Quarterly Report offers a complete overview of the RAN industry, with tables covering manufacturers’ and market revenue for multiple RAN segments including 5G NR Sub-7 GHz, 5G NR mmWave, LTE, Macro BTS, small cells, Massive MIMO, and Cloud RAN. The report also tracks the RAN market by region and includes a four-quarter outlook. To purchase this report, please contact us by email at [email protected]
References:
Worldwide RAN Market Remained Stable in 1Q 2026, According to Dell’Oro Group
Dell’Oro: RAN Market Stabilized in 2025 with 1% CAG forecast over next 5 years; Opinion on AI RAN, 5G Advanced, 6G RAN/Core risks
Dell’Oro: Analysis of the Nokia-NVIDIA-partnership on AI RAN
ABI Research: mobile network spending to fall 29% from 2026-to-2031
Dell’Oro: RAN market stable, Mobile Core Network market +14% Y/Y with 72 5G SA core networks deployed
Market research firms Omdia and Dell’Oro: impact of 6G and AI investments on telcos
Mulit-vendor Open RAN stalls as Echostar/Dish shuts down it’s 5G network leaving Mavenir in the lurch
Telco investments in mobile core networks surge 83% in 2025-Q4, but what about ROI?
According to new data from market research firm Omdia (owned by Informa), 2025 Q4 investments 5G SA Core networks surged 83% year-over-year. For OEMs, this uptick suggests a pivot away from the stagnant 5G Standalone (SA) momentum of recent years. Omdia identified North America and EMEA as the primary growth engines for the quarter. “The surge in 5G core investment underscores CSPs’ strategic focus on enabling new revenue streams and digital transformation,” said Roberto Kompany, Principal Analyst Mobile Infrastructure at Omdia, in a statement. “This momentum is reflected in AT&T’s nationwide 5G SA and RedCap deployment and Verizon’s launch of a new enterprise-grade fixed wireless access (FWA) slice,” he said.
Ookla and Omdia recently noted accelerating 5G SA adoption in Europe, but the region continues to trail global leaders due to its low baseline. Spain remains a standout exception. Telefónica recently achieved a domestic milestone by deploying 5G SA in-building coverage via a Vantage Towers DAS, and has partnered with Airbus Helicopters to integrate 5G SA into manned and unmanned rotary-wing platforms for the Spanish armed forces. Despite broader deployments in the UK and Germany, a significant performance gap remains.
The GCC region ( Bahrain, Kuwait, Oman, Qatar, Saudi Arabia, and the UAE.) currently delivers median 5G SA download speeds up to five times faster than European averages. This disparity highlights a capability gap rather than a coverage issue between mature and emerging markets. The industry footprint is expanding, with Omdia reporting 88 commercial 5G SA deployments to date—a notable increase from the 72 reported by Dell’Oro in late 2025.
…………………………………………………………………………………………………………………………………………………………………………………………….
While Dell’Oro confirms the 5G SA Core market growth, it emphasized that subscriber migration and active utilization, rather than just “flags in the ground,” are the true long-term drivers for infrastructure spend. For the first time, the 5G Mobile Core Network (MCN) market accounted for 50 percent share of the total MCN market.
“In 2025, the MCN market recorded its highest year-over-year revenue growth rate since 2014,” stated Dave Bolan, Research Director at Dell’Oro Group. “This was driven by record-setting growth rates in all market segments: 4G MCN (highest since 2019), 5G MCN (highest since 2022), and Voice Core (highest since 2007). 4G MCN gains came from Caribbean and Latin America (CALA) and Europe, Middle East, Africa (EMEA) regions; 5G MCN from all regions; and Voice Core, primarily from Asia Pacific and EMEA regions.
“5G MCNs led the way in 2025 growth, as 5G Standalone (5G SA) networks reached an inflection point and moved towards mass market appeal, as more 5G SA networks expand in population coverage in urban, suburban, and rural areas. Voice Core was the next major contributor to growth in 2025, driven by planned 3G MCN shutdowns, which required upgrades from Circuit Switched Core to IMS Core, and IMS Core modernization to a cloud-native IMS Core for VoNR in 5G SA networks. Meanwhile, 4G MCNs expanded due to subscriber growth in Africa and South America,” added Bolan.
Looking ahead, Omdia forecasts sustained double-digit growth for 5G Core investments through 2026, fueled by the requirement for nationwide service parity and increased network capacity. This outlook favors the leading 5G Core vendors—Huawei, Ericsson, and Nokia—who currently maintain the highest market shares.
……………………………………………………………………………………………………………………………………………………………………………………………
ROI for 5G SA Core Networks?
The return on investment (ROI) for 5G Standalone (SA) core networks is currently at a critical inflection point. While initial years were marked by “bemoaning” slow momentum, 2025 and 2026 have seen a shift from pilot testing to an execution-driven phase with measurable, albeit varied, returns. In the 2025–2026 market, enterprise ROI for 5G Standalone (SA) is primarily driven by three high-growth segments: Private 5G Networks, RedCap IoT, and Network Slicing. While public 5G consumer returns remain steady, these B2B use cases are where Mobile Network Operators (MNOs) are finding the most immediate “killer applications.”
- Operational Efficiency: 5G SA cores are cloud-native, allowing for microservices that can be deployed in hours rather than days. This reduces long-term operational costs (OpEx) by automating network functions and improving energy efficiency per gigabyte transmitted.
- New Revenue Streams: Unlike 5G Non-Standalone (NSA), the SA core enables Network Slicing and Ultra-Reliable Low-Latency Communications (URLLC). These are essential for high-margin B2B services like industrial robotics, emergency services, and “SuperMobile” slicing for enterprises.
- Monetization of “Capability”: In regions like the GCC (Gulf Cooperation Council), 5G SA delivers speeds up to five times faster than European averages, allowing operators to charge for performance-based tiers rather than just data volume.
- Consumer Benefits: Early data from the UK indicates that 5G SA can extend device battery life by 11% to 22% due to its unified control plane, creating a tangible value proposition for premium consumer plans.
- The “Value Perception Gap”: Despite nationwide rollouts, some operators (like AT&T in late 2025) saw mobile service revenue grow by only 3.4%, barely outpacing inflation.
- Regional Disparity: ROI is strongest in North America and China, where industrial policy and sovereign wealth have accelerated deployment. In contrast, Europe faces a “regulatory quagmire” and higher costs for removing legacy equipment, slowing its path to profitability.
- The 6G Factor: Some operators are hesitant to invest billions in a full 5G SA overhaul if the technology is viewed as a “transitional” generation that may be superseded by 6G-ready cores in the late 2020s.
References:
https://www.telecoms.com/5g-6g/telcos-spend-more-on-the-core-as-5g-sa-picks-up
https://www.linkedin.com/pulse/february-newsletter-4q25-fy25-wireless-infrastructure-update-ug9ec/
Dell’Oro: Mobile Core Networks +15% in 2025; Ookla: Global Reality Check on 5G SA and 5G Advanced in 2026
Dell’Oro: RAN market stable, Mobile Core Network market +14% Y/Y with 72 5G SA core networks deployed
Dell’Oro: RAN market stable, Mobile Core Network market +14% Y/Y with 72 5G SA core networks deployed
Téral Research: 5G SA core network deployments accelerate after a very slow start
Analysts: Telco CAPEX crash looks to continue: mobile core network, RAN, and optical all expected to decline
Building and Operating a Cloud Native 5G SA Core Network
MCN Market Roared Back in 2025 With 15 Percent Growth, According to Dell’Oro Group
Dell’Oro: RAN revenue growth in 1Q2025; AI RAN is a conundrum
Dell’Oro Group just completed its 1Q-2025 Radio Access Network (RAN) report. Initial findings suggest that after two years of steep declines, market conditions improved in the quarter. Preliminary estimates show that worldwide RAN revenue, excluding services, stabilized year-over-year, resulting in the first growth quarter since 1Q-2023. Author Stefan Pongratz attributes the improved conditions to favorable regional mix and easy comparisons (investments were very low same quarter lasts year), rather than a change to the fundamentals that shape the RAN market.
Pongratz believes the long-term trajectory has not changed. “While it is exciting that RAN came in as expected and the full year outlook remains on track, the message we have communicated for some time now has not changed. The RAN market is still growth-challenged as regional 5G coverage imbalances, slower data traffic growth, and monetization challenges continue to weigh on the broader growth prospects,” he added.
Vendor rankings haven’t changed much in several years, as per this table:
Additional highlights from the 1Q 2025 RAN report:
– Strong growth in North America was enough to offset declines in CALA, China, and MEA.
– The picture is less favorable outside of North America. RAN, excluding North America, recorded a fifth consecutive quarter of declines.
– Revenue rankings did not change in 1Q 2025. The top 5 RAN suppliers (4-Quarter Trailing) based on worldwide revenues are Huawei, Ericsson, Nokia, ZTE, and Samsung.
– The top 5 RAN (4-Quarter Trailing) suppliers based on revenues outside of China are Ericsson, Nokia, Huawei, Samsung, and ZTE.
– The short-term outlook is mostly unchanged, with total RAN expected to remain stable in 2025 and RAN outside of China growing at a modest pace.
Dell’Oro Group’s RAN Quarterly Report offers a complete overview of the RAN industry, with tables covering manufacturers’ and market revenue for multiple RAN segments including 5G NR Sub-7 GHz, 5G NR mmWave, LTE, macro base stations and radios, small cells, Massive MIMO, Open RAN, and vRAN. The report also tracks the RAN market by region and includes a four-quarter outlook. To purchase this report, please contact us by email at [email protected]
………………………………………………………………………………………………………………………………………………………………………………..
Separately, Pongrantz says “there is great skepticism about AI’s ability to reverse the flat revenue trajectory that has defined network operators throughout the 4G and 5G cycles.”
The 3GPP AI/ML activities and roadmap are mostly aligned with the broader efficiency aspects of the AI RAN vision, primarily focused on automation, management data analytics (MDA), SON/MDT, and over-the-air (OTA) related work (CSI, beam management, mobility, and positioning).
Current AI/ML activities align well with the AI-RAN Alliance’s vision to elevate the RAN’s potential with more automation, improved efficiencies, and new monetization opportunities. The AI-RAN Alliance envisions three key development areas: 1) AI and RAN – improving asset utilization by using a common shared infrastructure for both RAN and AI workloads, 2) AI on RAN – enabling AI applications on the RAN, 3) AI for RAN – optimizing and enhancing RAN performance. Or from an operator standpoint, AI offers the potential to boost revenue or reduce capex and opex.
While operators generally don’t consider AI the end destination, they believe more openness, virtualization, and intelligence will play essential roles in the broader RAN automation journey.
Operators are not revising their topline growth or mobile data traffic projections upward as a result of AI growing in and around the RAN. Disappointing 4G/5G returns and the failure to reverse the flattish carrier revenue trajectory is helping to explain the increased focus on what can be controlled — AI RAN is currently all about improving the performance/efficiency and reducing opex.
Since the typical gains demonstrated so far are in the 10% to 30% range for specific features, the AI RAN business case will hinge crucially on the cost and power envelope—the risk appetite for growing capex/opex is limited.
The AI-RAN business case using new hardware is difficult to justify for single-purpose tenancy. However, if the operators can use the resources for both RAN and non-RAN workloads and/or the accelerated computing cost comes down (NVIDIA recently announced ARC-Compact, an AI-RAN solution designed for D-RAN), the TAM could expand. For now, the AI service provider vision, where carriers sell unused capacity at scale, remains somewhat far-fetched, and as a result, multi-purpose tenancy is expected to account for a small share of the broader AI RAN market over the near term.
In short, improving something already done by 10% to 30% is not overly exciting. However, suppose AI embedded in the radio signal processing can realize more significant gains or help unlock new revenue opportunities by improving site utilization and providing telcos with an opportunity to sell unused RAN capacity. In that case, there are reasons to be excited. But since the latter is a lower-likelihood play, the base case expectation is that AI RAN will produce tangible value-add, and the excitement level is moderate — or as the Swedes would say, it is lagom.
…………………………………………………………………………………………………………………………………………………………………………………………………………………………………………….
Editor’s Note:
ITU-R WP 5D is working on aspects related to AI in the Radio Access Network (RAN) as part of its IMT-2030 (6G) recommendations. IMT-2030 is expected to consider an appropriate AI-native new air interface that uses to the extent practicable, and proved demonstrated actionable AI to enhance the performance of radio interface functions such as symbol detection/decoding, channel estimation etc. An appropriate AI-native radio network would enable automated and intelligent networking services such as intelligent data perception, supply of on-demand capability etc. Radio networks that support applicable AI services would be fundamental to the design of IMT technologies to serve various AI applications, and the proposed directions include on-demand uplink/sidelink-centric, deep edge, and distributed machine learning.
In summary:
- ITU-R WP5D recognizes AI as one of the key technology trends for IMT-2030 (6G).
- This includes “native AI,” which encompasses both AI-enabled air interface design and radio network for AI services.
- AI is expected to play a crucial role in enhancing the capabilities and performance of 6G networks.
…………………………………………………………………………………………………………………………………………………………………………………………………………………………………………….
References:
Dell’Oro: Private RAN revenue declines slightly, but still doing relatively better than public RAN and WLAN markets
ITU-R WP 5D reports on: IMT-2030 (“6G”) Minimum Technology Performance Requirements; Evaluation Criteria & Methodology
https://www.itu.int/dms_pubrec/itu-r/rec/m/R-REC-M.2160-0-202311-I!!PDF-E.pdf
Dell’Oro: Global telecom CAPEX declined 10% YoY in 1st half of 2024
According to a recent report by Dell’Oro Group, telecom operators are now scaling back their investments in 5G and fixed broadband technologies. Of course, that’s nothing new as telco CAPEX has been declining for quite some time (see References below). Preliminary Dell’Oro findings show that the more challenging conditions that shaped the second half of 2023 extended into the first half of 2024.
Worldwide telecom capex, the sum of wireless and wireline/other telecom carrier investments, declined 10% year-over-year (YoY) in the first half of 2024, partly due to built-up inventory, weaker demand in China, India, and US, challenging 5G comparisons, excess capacity, and elevated uncertainty.
“The high-level message is clear. The flattish revenue trajectory and the difficulties with monetizing new technologies and opportunities are impacting the risk appetite and willingness to raise the capital intensity levels for extended periods,” said Stefan Pongratz, Vice President for RAN and Telecom Capex research at Dell’Oro Group. “In addition, the reduced gap between advanced and less advanced regions, when it comes to adopting new technologies, is impacting the investment intensity on the way up and down,” continued Pongratz.
Additional highlights from the September 2024 Telecom Capex report:
- Global carrier revenues are expected to increase at a 1 percent CAGR over the next 3 years.
- Worldwide telecom capex is projected to decline at a mid-single-digit rate in 2024 and at a negative 2 percent CAGR by 2026.
- The mix between wireless and wireline remains largely unchanged, reflecting challenging times still ahead for wireless. Wireless-related capex will decline at a 3 percent CAGR by 2026.
- Capital intensity ratios are modeled to approach 15 percent by 2026, down from 17 percent in 2023.
 In a previous Dell’Oro report last month, telecom equipment revenues fell by 17% worldwide during the first half of the year. Dell’Oro described that as ‘abysmal results’ and again blamed excess inventory, weaker demand in China, ‘challenging 5G comparisons’, and elevated uncertainty.
The Dell’Oro Group Telecom Capex Report provides in-depth coverage of around 50 telecom operators, highlighting carrier revenue, capital expenditure, and capital intensity trends. The report provides actual and 3-year forecast details by carrier, by region by country (United States, Canada, China, India, Japan, and South Korea), and by technology (wireless/wireline). To purchase this report, please contact by email at [email protected].
References:
Telecom Capex Down 10 Percent in 1H24, According to Dell’Oro Group
Dell’Oro: Abysmal revenue results continue: Ethernet Campus Switch and Worldwide Telecom Equipment + Telco Convergence Moves to Counter Cable Broadband
Analysts: Telco CAPEX crash looks to continue: mobile core network, RAN, and optical all expected to decline
Analysys Mason’s gloomy CAPEX forecast: “there will not be a cyclical recovery”
China Mobile & China Unicom increase revenues and profits in 2023, but will slash CAPEX in 2024
Dell’Oro: RAN market still declining with Huawei, Ericsson, Nokia, ZTE and Samsung top vendors
Highlights of Dell’Oro’s 5-year RAN forecast
Dell’Oro: 2023 global telecom equipment revenues declined 5% YoY; Huawei increases its #1 position
Dell’Oro & Omdia: Global RAN market declined in 2023 and again in 2024
Global 5G Market Snapshot; Dell’Oro and GSA Updates on 5G SA networks and devices
Dell’Oro: Abysmal revenue results continue: Ethernet Campus Switch and Worldwide Telecom Equipment + Telco Convergence Moves to Counter Cable Broadband
Dell’Oro Group recently reported that:
1. 2Q 2024 worldwide Ethernet Campus Switch revenues contracted year-over-year for the third quarter in a row. Ethernet campus switch sales hit an all-time high in 2Q 2023 and a year later, vendors are suffering in comparison.
“We expect another year-over-year contraction in sales next quarter, in 3Q 2024,” said Siân Morgan, Research Director at Dell’Oro Group. “However, the outlook is improving, and the Ethernet Campus Switch market is expected to return to growth in 4Q 2024.”
“While the economy in China remains soft, Huawei grew year-over-year campus switch revenues across the rest of Asia Pacific and CALA. Over half of Huawei’s campus switch sales were generated outside China,” added Morgan.
Additional highlights from the 2Q 2024 Ethernet Switch–Campus Report:
- The contraction in Ethernet campus switch sales was broad-based across both modular and fixed form factors, all verticals and regions.
- Sales to North America fell the most of any macro-economic region.
- Cisco grew campus switch revenues on a quarter-over-quarter basis, for the first time in a year.
The Dell’Oro Group’s Ethernet Switch–Campus Quarterly Report offers a detailed view of Ethernet switches built and optimized for deployment outside the data center, to connect users and things to the Local Area Networks. The report contains in-depth market and vendor-level information on manufacturers’ revenue, ports shipped, and average selling prices for both Modular and Fixed, and Fixed Managed and Unmanaged Ethernet Switches (100 Mbps, 1/2.5/5/10/25/40/50/100/400 Gbps), Power-over-Ethernet, plus regional breakouts as well as split by customer size (Enterprise vs. SMB) and vertical segments. To purchase these reports, please contact us by email at [email protected].
……………………………………………………………………………………………………….
2. Preliminary findings indicate that worldwide telecom equipment revenues across the six telecom programs tracked at Dell’Oro Group—Broadband Access, Microwave & Optical Transport, Mobile Core Network (MCN), Radio Access Network (RAN), and SP Router & Switch—declined 16% year-over-year (Y/Y) in 2Q24, recording a fourth consecutive quarter of double-digit contractions. Helping to explain the abysmal results are excess inventory, weaker demand in China, challenging 5G comparisons, and elevated uncertainty.
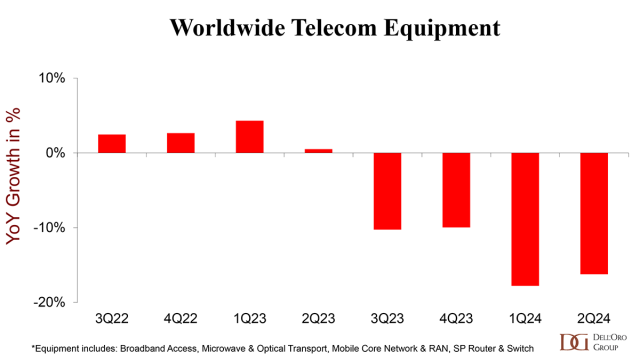
Regional output deceleration was broad-based in the second quarter of 2024, reflecting slower revenue growth on a Y/Y basis in all regions, including North America, EMEA, Asia Pacific, and CALA (Caribbean and Latin America). Varied momentum in activity in the first half was particularly significant in China – the total telecom equipment market in China stumbled in the second quarter, declining 17% Y/Y.
The downward pressure was not confined to a specific technology, and initial readings show that all six telecom programs declined in the second quarter. In addition to the wireless programs (RAN and MCN), which are still impacted by slower 5G deployments, spending on Service Provider Routers fell by a third in 2Q24.
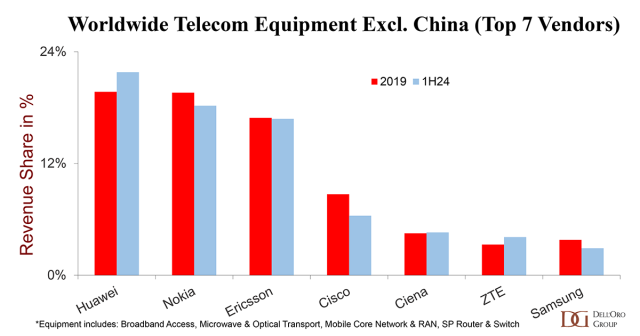
Supplier rankings were mostly unchanged. The top 7 suppliers in 1H24 accounted for 80% of the worldwide telecom equipment market and included Huawei, Nokia, Ericsson, ZTE, Cisco, Ciena, and Samsung. Huawei and ZTE combined gained nearly 3 percentage points of share between 2023 and 1H24.
Supplier positions differ slightly when we exclude the Chinese market. Despite the ongoing efforts by the U.S. government to curb Huawei’s rise, Huawei is still well positioned in the broader telecom equipment market, excluding China, which is up roughly two percentage points relative to 2019 levels.
- Even with the second half of 2024 expected to account for 54% of full-year revenues, market conditions are expected to remain challenging in 2024.
- The Dell’Oro analyst team collectively forecasts global telecom equipment revenues to contract 8 to 10% in 2024, even worse than the 4% decline in 2023.
3. U.S. Telcos Betting on Convergence and Scale To End Cable’s Broadband Reign
U.S. telcos have been very active the past two weeks with deals and partnerships.
- Verizon announced a $20B deal to acquire Frontier Communications and push the combined entity to a fiber footprint of 25 million homes and a fixed wireless footprint of approximately 60 million homes.
- AT&T announced partnerships with four open access network providers to help it expand the reach of its fiber services outside its existing wireline footprint. AT&T will serve as an ISP in these markets, delivering both residential and enterprise services via these partnerships. AT&T is on track to pass a minimum of 30 million homes with fiber by 2025 in its own footprint, as well as an additional 1.5 million homes through its Gigapower joint venture with BlackRock.
- AT&T has also quietly increased the availability of its Internet Air FWA (Fixed Wireless Access) services to over 130 markets, as It potentially positions the service to move beyond just a means of capturing existing DSL subscribers.
These deals follow on the heels of T-Mobile’s proposed acquisition of Lumos Networks, which is slated to pass 3.5 million homes with fiber by the end of 2028. Under the terms of the deal, Lumos will transition to a wholesale model with T-Mobile as the anchor ISP. This is exactly the type of arrangement T-Mobile has established with some of its other infrastructure partners. However, with its partial ownership of Lumos, T-Mobile can presumably generate better returns and healthier margins from its broadband service offerings. The joint venture also is consistent with T-Mobile’s goal of expanding its market presence and footprint without expending a significant amount of capital. In fact, if you take the $1.4B that T-Mobile will ultimately invest in Lumos as it increases its homes passed from 320K to 3.5M by the end of 2028, T-Mobile’s cost per home passed ends up being somewhat less than $500.
That $500 per home passed figure could be even lower should Lumos continue to secure additional American Rescue Plan Act (ARPA) Capital Project Fund grants as well as a portion of the $3.6 B in aggregate BEAD (Broadband Equity, Access, and Development) funding across North Carolina, South Carolina, and Virginia.
The primary reason for T-Mobile’s push into both direct fiber network ownership and partnerships with open access fiber providers is that the operator has over 1 million customers on a waiting list for its fixed wireless service. These customers can’t be served because they are in markets where T-Mobile does not have enough 5G capacity to serve them. As T-Mobile expands the reach of its fiber offering, it can not only provide service to these customers but also existing FWA subscribers. Once an FWA subscriber switches to T-Mobile Fiber, that opens the spectrum for additional FWA subscribers.
US telcos are moving quickly to expand the reach of their fiber, fixed wireless, and ISP services to complement their nationwide mobile networks because they smell blood among the largest cable operators. Telcos are disrupting the broadband market faster and more efficiently right now—a disruption that could very well be amplified by Federal and State subsidies.
With the rollout of 5G networks having had little impact on the profitability of mobile services, fixed wireless has emerged as the most successful use case for mobile network operators (MNOs) can monetize their excess 5G capacity. FWA’s timing couldn’t have been better, with inflation having increased from 2021 on, pushing subscribers to seek out more affordable—but still high quality—broadband service offerings. FWA hit the market providing a powerful combination of affordability, speed, and availability.
The success of FWA combined with overall fiber network expansions has given telcos a potent tool for not only the convergence of mobile and fixed broadband services but also the emergence of these services being offered on an almost nationwide basis. It’s pretty simple math. If you can offer a product or service to a larger number of end customers, the higher the likelihood of continued net subscriber additions, all other things being equal.
Even in markets where there is overlap between fixed wireless and that MNO’s own (or marketed) fiber broadband services, there isn’t really a danger of cannibalization, because the two services will very likely address very different subscribers. As the telcos’ ARPU (average revenue per unit) results have shown, subscribers are willing to pay more for fiber-based connectivity. In 2Q24, for example, AT&T announced that its fiber broadband ARPU is $69 and that the mix shift of its subscribers to fiber has pushed overall broadband ARPU up to $66.17, representing a 6% increase from 2Q23.
Meanwhile, in the second quarter, T-Mobile reported an ARPA figure of $142.54, which was up from $138.94 in 2Q23. Partially fueling that increase was an increase in the number of customers per account, due largely to the adoption of FWA services. Remember, T-Mobile prices and treats its FWA offering as an additional line of service, making it very simple to add to an existing T-Mobile account.
With a starting price point of $50 and typical download speeds ranging from 33-182 Mbps and upload speeds of 6-23 Mbps, T-Mobile is clearly targeting the low-mid cable broadband tiers—and having a great deal of success in converting those subscribers.
Going forward, the 1-2 punch of FWA and fiber will allow the largest telcos to have substantially larger broadband footprints than their cable competitors. Combine that with growing ISP relationships with open access providers and these telcos can expand their footprint and potential customer base further. And by expanding further, we don’t just mean total number of homes passed, but also businesses, enterprises, MDUs (multi-dwelling units), and data centers. Fiber footprint is as much about total route miles as it is about total passings. And those total route miles are, once again, increasing in value, after a prolonged slump.
For cable operators to successfully respond, consolidation likely has to be back on the table. The name of the game in the US right now is how to expand the addressable market of subscribers or risk being limited to existing geographic serving areas. Beyond that, continuing to focus on the aggressive bundling of converged services, which certainly has paid dividends in the form of new mobile subscribers.
Beyond that, being able to get to market quickly in new serving areas will be critical. In this time of frenzied buildouts and expansions, the importance of the first mover advantage can not be overstated.
The push and pull of broadband and wireless subscribers isn’t expected to slow down anytime soon. Certainly, with inflation continuing to put pressure on household budgets, consumers are going to be focused on keeping their communications costs low and looking for value wherever they can find it. That means we are returning to an environment where subscribers take advantage of introductory pricing on services only to switch providers to extend that introductory pricing once the initial offer expires. That shifting and its expected downward pressure on residential ARPU will likely be countered by increasing ARPUs at some providers as they move existing DSL customers to fiber or, in the case of cable operators, move customers to multi-gigabit tiers.
The US broadband market is definitely in for a wild ride over the next few years as the competitive landscape changes across many markets. The net result is certain to be shifts in market share and ebbs and flows in net subscriber additions depending on consumer sentiment. One thing that will remain constant is that value and reliability will remain key components of any subscription decision. The providers that deliver on that consistently will ultimately be the winners.
References:
Ethernet Campus Switch Revenues Plunge by 30 Percent in 2Q 2024, According to Dell’Oro Group
US Telcos Betting on Convergence and Scale To End Cable’s Broadband Reign
Dell’Oro: Private RAN revenue declines slightly, but still doing relatively better than public RAN and WLAN markets
Dell’Oro: Campus Ethernet Switch Revenues dropped 23% YoY in 1Q-2024
Dell’Oro: RAN revenues declined sharply in 2023 and will remain challenging in 2024; top 8 RAN vendors own the market
Dell’Oro: Broadband Equipment Spending to exceed $120B from 2022 to 2027
Dell’Oro: RAN Market to Decline 1% CAGR; Mobile Core Network growth reduced to 1% CAGR
Dell’Oro: Optical Transport market to hit $17B by 2027; Lumen Technologies 400G wavelength market
Nokia’s 760 global private networking contracts are mostly 4G-LTE Advanced
Backgrounder:
Private Wireless Radio Access Network (RAN) revenue growth slowed in the fourth quarter of 2023 on a year-over-year basis. However, full-year revenues accelerated by approximately 40% in 2023, propelling private wireless to comprise around 2% of the overall RAN market.
“Private wireless RANs are now growing at a formidable pace, in contrast to public RAN and enterprise WLAN – both segments are projected to contract in 2024,” said Stefan Pongratz, Vice President at Dell’Oro Group in April.
The top 3 Private Wireless RAN suppliers in 2023 were Huawei, Nokia, and Ericsson. Excluding China, they were Nokia, Ericsson, and Samsung.
……………………………………………………………………………………………………………………………………………..
Nokia leads in Private RANs:
Nokia recently told Fierce Network that it signed 30 new private networking contracts in the second quarter of 2024. Nokia has said that it has signed more than 760 private network contracts around the world. NGIC, Sigma Lithium and Solis are some of the most recent names it has signed.
Nokia said that 78% of its private network business is based on 4G LTE-Advanced [1.], compared to 18% being 5G only, and the remaining 4% combining the two broadband cellular technologies.
Note 1. In October 2010, LTE-Advanced successfully passed the ITU-R’s evaluation process and was found to meet or exceed IMT-Advanced requirements. It was standardized a “IMT Advanced,” which support low to high mobility applications and a wide range of data rates in accordance with user and service demands in multiple user environments. IMT Advanced also has capabilities for high quality multimedia applications within a wide range of services and platforms, providing a significant improvement in performance and quality of service.

Image courtesy of Research Gate
…………………………………………………………………………………………………………………………………………….
David de Lancellotti, VP of enterprise campus edge business at Nokia talked to Fierce about Nokia’s performance in the private networking space. “Thirty in Q2, and roughly 50 — a little more than 50 — in the first half,” he said of contracts signed.
“We kind of jumped into this a bit earlier than anybody else,” Nokia’s de Lancellotti explained. “I think we’ve always taken a real service provider approach in terms of quality, in terms of feature set [and] in terms of roadmap,” while noting Nokia’s “real drive to pick up the enterprise space.”
Industry verticals – transportation, energy and manufacturing – continue to “lead the way” for private networking contracts in Q2. “When we talk about transportation, I think that’s the port side of business, which continues to be strong for us,” David said.
References:
https://www.fierce-network.com/wireless/nokia
Private Wireless RAN Revenues up ~40 Percent in 2023, According to Dell’Oro Group
https://en.wikipedia.org/wiki/LTE_Advanced
https://www.itu.int/en/ITU-R/study-groups/rsg5/rwp5d/imt-adv/Pages/default.aspx
https://www.researchgate.net/figure/Network-architecture-of-LTE-Advanced_fig1_333886291